Grundlæggende statistik
| Institutionelle ejere | 67 total, 67 long only, 0 short only, 0 long/short - change of 13,56% MRQ |
| Gennemsnitlig porteføljeallokering | 0.0841 % - change of -5,54% MRQ |
| Institutionelle aktier (lange) | 4.713.824 (ex 13D/G) - change of 0,51MM shares 12,17% MRQ |
| Institutionel værdi (lang) | $ 157.130 USD ($1000) |
Institutionelt ejerskab og aktionærer
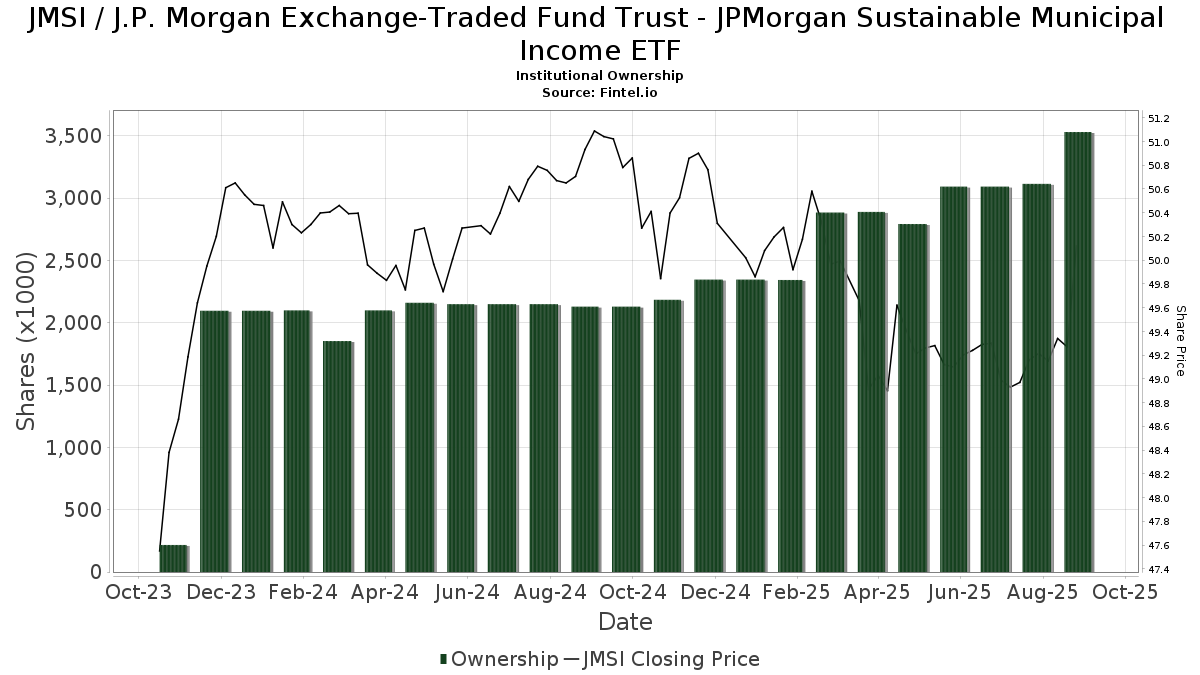
J.P. Morgan Exchange-Traded Fund Trust - JPMorgan Sustainable Municipal Income ETF (US:JMSI) har 67 institutionelle ejere og aktionærer, der har indsendt 13D/G- eller 13F-formularer til Securities Exchange Commission (SEC). Disse institutioner har i alt 4,713,824 aktier. Største aktionærer omfatter Betterment LLC, Jpmorgan Chase & Co, EP Wealth Advisors, Inc., Pnc Financial Services Group, Inc., Envestnet Asset Management Inc, Seeds Investor Llc, Raymond James Financial Inc, Ellevest, Inc., Mission Wealth Management, Lp, and Integrated Wealth Concepts LLC .
J.P. Morgan Exchange-Traded Fund Trust - JPMorgan Sustainable Municipal Income ETF (ARCA:JMSI) institutionel ejerskabsstruktur viser aktuelle positioner i virksomheden efter institutioner og fonde, samt seneste ændringer i positionsstørrelse. Større aktionærer kan omfatte individuelle investorer, investeringsforeninger, hedgefonde eller institutioner. Skema 13D angiver, at investoren besidder (eller besidder) mere end 5 % af virksomheden og har til hensigt (eller har til hensigt at) aktivt at forfølge en ændring i forretningsstrategi. Skema 13G indikerer en passiv investering på over 5%.
The share price as of February 27, 2026 is 51,16 / share. Previously, on March 3, 2025, the share price was 50,45 / share. This represents an increase of 1,41% over that period.
Fondens stemningsscore
Fund Sentiment Score (fka Ownership Accumulation Score) finder de aktier, der bliver mest købt af fonde. Det er resultatet af en sofistikeret, multi-faktor kvantitativ model, der identificerer virksomheder med de højeste niveauer af institutionel akkumulering. Scoringsmodellen bruger en kombination af den samlede stigning i oplyste ejere, ændringerne i porteføljeallokeringer i disse ejere og andre målinger. Tallet går fra 0 til 100, hvor højere tal indikerer et højere niveau af akkumulering for sine jævnaldrende, og 50 er gennemsnittet.
Opdateringsfrekvens: Dagligt
Se Ownership Explorer, som giver en liste over højest rangerende virksomheder.
AI+ Ask Fintel’s AI assistant about J.P. Morgan Exchange-Traded Fund Trust - JPMorgan Sustainable Municipal Income ETF.
Select a question to share a public post with an AI-crafted answer.
Thinking of good questions…
Institutionel Put/Call-forhold
Ud over at indberette standardaktie- og gældsudstedelser skal institutter med mere end 100 mill. aktiver under forvaltning også oplyse deres put- og call-optionsbeholdninger. Da salgsoptioner generelt indikerer negativ stemning, og købsoptioner indikerer positiv stemning, kan vi få en fornemmelse af den overordnede institutionelle stemning ved at plotte forholdet mellem put og kald. Diagrammet til højre viser det historiske put/call-forhold for dette instrument.
Brug af Put/Call Ratio som en indikator for investorernes stemning overvinder en af de vigtigste mangler ved at bruge totalt institutionelt ejerskab, som er, at en betydelig mængde af aktiver under forvaltning investeres passivt for at spore indekser. Passivt forvaltede fonde køber typisk ikke optioner, så indikatoren for put/call-forholdet følger mere nøje følelsen af aktivt forvaltede fonde.
13F og NPORT arkivering
Detaljer om 13F-arkivering er gratis. Detaljer om NP-ansøgninger kræver et premium-medlemskab. Grønne rækker angiver nye positioner. Røde rækker angiver lukkede positioner. Klik på linket ikon for at se den fulde transaktionshistorik.
Opgrader
for at låse premium-data op og eksportere til Excel ![]() .
.
| Fil dato | Kilde | Investor | Type | Gennemsnitlig pris (Øst) |
Aktier | Δ Aktier (%) |
Rapporteret Værdi ($1000) |
Δ Værdi (%) |
Port Alloc (%) |
|
|---|---|---|---|---|---|---|---|---|---|---|
| 2026-02-06 | 13F | Pnc Financial Services Group, Inc. | 210.433 | 11,98 | 10.602 | 12,33 | ||||
| 2026-02-17 | 13F | Bank Of America Corp /de/ | 0 | -100,00 | 0 | |||||
| 2026-02-17 | 13F | Old Mission Capital Llc | 3.991 | 201 | ||||||
| 2026-01-29 | 13F | UBS Group AG | 2.082 | 0,10 | 105 | 0,00 | ||||
| 2026-02-13 | 13F | Clarity Asset Management, Inc. | 1.134 | -43,38 | 57 | -43,00 | ||||
| 2026-01-28 | 13F | Amarillo National Bank | 14.207 | 0,00 | 716 | 0,28 | ||||
| 2026-01-26 | 13F | AE Wealth Management LLC | 0 | -100,00 | 0 | |||||
| 2026-02-18 | 13F | GWM Advisors LLC | 17.147 | 4,45 | 864 | 4,73 | ||||
| 2026-02-17 | 13F | Fmr Llc | 32.542 | 17,91 | 1.639 | 18,25 | ||||
| 2026-02-12 | 13F | Principal Securities, Inc. | 0 | -100,00 | 0 | |||||
| 2026-02-13 | 13F | Ally Invest Advisors Inc. | 5.784 | 2,25 | 291 | 2,46 | ||||
| 2026-01-23 | 13F | Vested Financial Planning, LLC | 4.173 | 0,00 | 210 | 0,48 | ||||
| 2026-01-28 | 13F | Consolidated Planning Corp | 31.381 | 4,63 | 1.581 | 4,91 | ||||
| 2026-02-10 | 13F | Blueline Advisors Llc | 66 | 3 | ||||||
| 2026-01-20 | 13F | AdvisorNet Financial, Inc | 3.680 | 0,00 | 185 | 0,54 | ||||
| 2026-02-13 | 13F | Mml Investors Services, Llc | 14.828 | 63,95 | 747 | 64,54 | ||||
| 2026-02-12 | 13F | Triumph Capital Management | 1.265 | 0,00 | 64 | 0,00 | ||||
| 2026-02-17 | 13F | Wealth Architects, LLC | 20.526 | 0,00 | 1.034 | 0,39 | ||||
| 2026-02-10 | 13F | Ellevest, Inc. | 138.876 | 10,22 | 6.997 | 10,57 | ||||
| 2026-02-17 | 13F | Advisory Services Network, LLC | 0 | -100,00 | 0 | |||||
| 2026-02-17 | 13F | GeoWealth Management, LLC | 52.064 | -21,45 | 2.623 | -21,21 | ||||
| 2026-01-26 | 13F | PFG Investments, LLC | 10.566 | 532 | ||||||
| 2026-02-12 | 13F | Commonwealth Equity Services, Llc | 7.435 | -1,50 | 375 | |||||
| 2026-02-03 | 13F | International Assets Investment Management, Llc | 5.900 | 0,00 | 297 | 2,41 | ||||
| 2026-02-13 | 13F | Integrated Wealth Concepts LLC | 85.218 | 4.293 | ||||||
| 2026-02-12 | 13F | Jane Street Group, Llc | 50.320 | -9,33 | 2.535 | -9,01 | ||||
| 2026-02-11 | 13F | LPL Financial LLC | 32.298 | 17,09 | 1.627 | 17,47 | ||||
| 2026-02-17 | 13F | Mercer Global Advisors Inc /adv | 19.373 | -5,14 | 976 | -4,78 | ||||
| 2026-01-28 | 13F | Fairway Wealth LLC | 19.393 | 64,96 | 977 | 65,59 | ||||
| 2026-02-17 | 13F | Raymond James Financial Inc | 142.712 | 9,42 | 7.190 | 9,76 | ||||
| 2026-02-09 | 13F | Hantz Financial Services, Inc. | 143 | 0 | ||||||
| 2026-01-29 | 13F | Comerica Bank | 4.807 | 0,00 | 242 | 0,41 | ||||
| 2026-01-30 | 13F | Us Bancorp \de\ | 80 | 4 | ||||||
| 2026-02-17 | 13F | Advisor Group Holdings, Inc. | 888 | 56,34 | 45 | 57,14 | ||||
| 2026-02-12 | 13F | Steward Partners Investment Advisory, Llc | 156 | 8 | ||||||
| 2026-01-14 | 13F | Wincap Financial Llc | 5.250 | 0,00 | 264 | 0,38 | ||||
| 2026-02-13 | 13F | Bay Colony Advisory Group, Inc d/b/a Bay Colony Advisors | 0 | -100,00 | 0 | |||||
| 2026-01-21 | 13F | McNamara Financial Services, Inc. | 11.579 | 0,00 | 583 | 0,34 | ||||
| 2026-02-06 | 13F | IFP Advisors, Inc | 2.542 | 0,00 | 128 | 0,79 | ||||
| 2026-02-10 | 13F | Goldman Sachs Group Inc | 4.477 | 226 | ||||||
| 2026-02-05 | 13F | Allworth Financial LP | 1.370 | 77,69 | 69 | 81,58 | ||||
| 2025-10-23 | 13F | StoneCrest Wealth Management, Inc. | 0 | -100,00 | 0 | |||||
| 2026-01-08 | 13F | Wealth Enhancement Advisory Services, Llc | 40.776 | 10,57 | 2.059 | 11,30 | ||||
| 2026-02-10 | 13F | Envestnet Asset Management Inc | 188.214 | 4,66 | 9.482 | 5,01 | ||||
| 2026-02-05 | 13F | Mission Wealth Management, Lp | 109.615 | -6,70 | 5.522 | -6,41 | ||||
| 2026-02-06 | 13F | Global Retirement Partners, LLC | 639 | 0,95 | 32 | 3,23 | ||||
| 2026-02-11 | 13F | Jpmorgan Chase & Co | 897.065 | -0,54 | 45.194 | -0,22 | ||||
| 2026-02-13 | 13F | Morgan Stanley | 3.836 | 3,42 | 193 | 3,76 | ||||
| 2026-01-14 | 13F | ORG Partners LLC | 43.978 | 0,00 | 2.216 | 0,32 | ||||
| 2026-02-12 | 13F | Rossby Financial, LCC | 812 | 29,51 | 41 | 29,03 | ||||
| 2026-01-15 | 13F | Xena Financial Planning, LLC | 7.699 | 388 | ||||||
| 2025-11-12 | 13F | Angeles Wealth Management, Llc | 0 | -100,00 | 0 | |||||
| 2026-02-04 | 13F | GGM Financials LLC | 1.479 | 75 | ||||||
| 2025-11-14 | 13F | SRS Capital Advisors, Inc. | 0 | -100,00 | 0 | |||||
| 2026-01-21 | 13F | Flagship Harbor Advisors, Llc | 8.030 | 43,93 | 405 | 44,29 | ||||
| 2026-01-27 | 13F | Seeds Investor Llc | 149.036 | 10,86 | 7.508 | 11,21 | ||||
| 2026-02-17 | 13F | Jones Financial Companies Lllp | 41.009 | 23,50 | 2.066 | 24,16 | ||||
| 2026-02-17 | 13F | Citadel Advisors Llc | 4.067 | -24,29 | 205 | -24,16 | ||||
| 2026-01-29 | 13F | Financial Life Planners | 0 | -100,00 | 0 | |||||
| 2025-10-30 | 13F | Twin Peaks Wealth Advisors, LLC | 0 | -100,00 | 0 | -100,00 | ||||
| 2026-02-10 | 13F | Root Financial Partners, LLC | 1 | -99,94 | 0 | -100,00 | ||||
| 2026-02-17 | 13F | Elequin Capital Lp | 46.481 | 137,90 | 2.342 | 138,63 | ||||
| 2026-02-12 | 13F | Betterment LLC | 1.595.871 | 17,30 | 80 | 17,65 | ||||
| 2025-11-20 | 13F | First Affirmative Financial Network | 7.808 | 0,04 | 392 | 1,82 | ||||
| 2026-02-05 | 13F | Elyxium Wealth, LLC | 1 | 0 | ||||||
| 2026-02-13 | 13F | Financial Network Wealth Advisors LLC | 1.566 | 0,97 | 79 | 1,30 | ||||
| 2026-02-18 | 13F | EP Wealth Advisors, Inc. | 379.716 | 42,33 | 19.130 | 45,10 | ||||
| 2026-01-12 | 13F | Skyline Advisors, Inc. | 8.995 | 0,95 | 453 | 1,34 | ||||
| 2026-01-22 | 13F | Maseco Llp | 519 | 0,00 | 26 | 0,00 | ||||
| 2026-02-13 | 13F | Fiduciary Trust Co | 37.971 | 12,58 | 1.913 | 12,94 | ||||
| 2026-01-26 | 13F | Merit Financial Group, LLC | 4.025 | 203 | ||||||
| 2026-02-13 | 13F | Aptus Capital Advisors, LLC | 1.806 | 0,33 | 91 | 0,00 | ||||
| 2026-02-17 | 13F | Royal Bank Of Canada | 476 | -97,08 | 24 | -97,07 | ||||
| 2026-01-23 | 13F | Assetmark, Inc | 53 | 3 | ||||||
| 2026-02-13 | 13F | Colony Group, LLC | 40.044 | 0,21 | 2.017 | 0,55 | ||||
| 2026-01-21 | 13F | Modera Wealth Management, LLC | 64.378 | -9,98 | 3.243 | -9,69 | ||||
| 2025-11-14 | 13F | Cetera Investment Advisers | 0 | -100,00 | 0 | -100,00 | ||||
| 2026-02-10 | 13F/A | Northwestern Mutual Wealth Management Co | 69.172 | -1,36 | 3.485 | -1,05 |