Grundlæggende statistik
| Institutionelle ejere | 173 total, 173 long only, 0 short only, 0 long/short - change of 8,12% MRQ |
| Gennemsnitlig porteføljeallokering | 0.6711 % - change of -1,92% MRQ |
| Institutionelle aktier (lange) | 59.990.784 (ex 13D/G) - change of 16,26MM shares 37,19% MRQ |
| Institutionel værdi (lang) | $ 1.996.220 USD ($1000) |
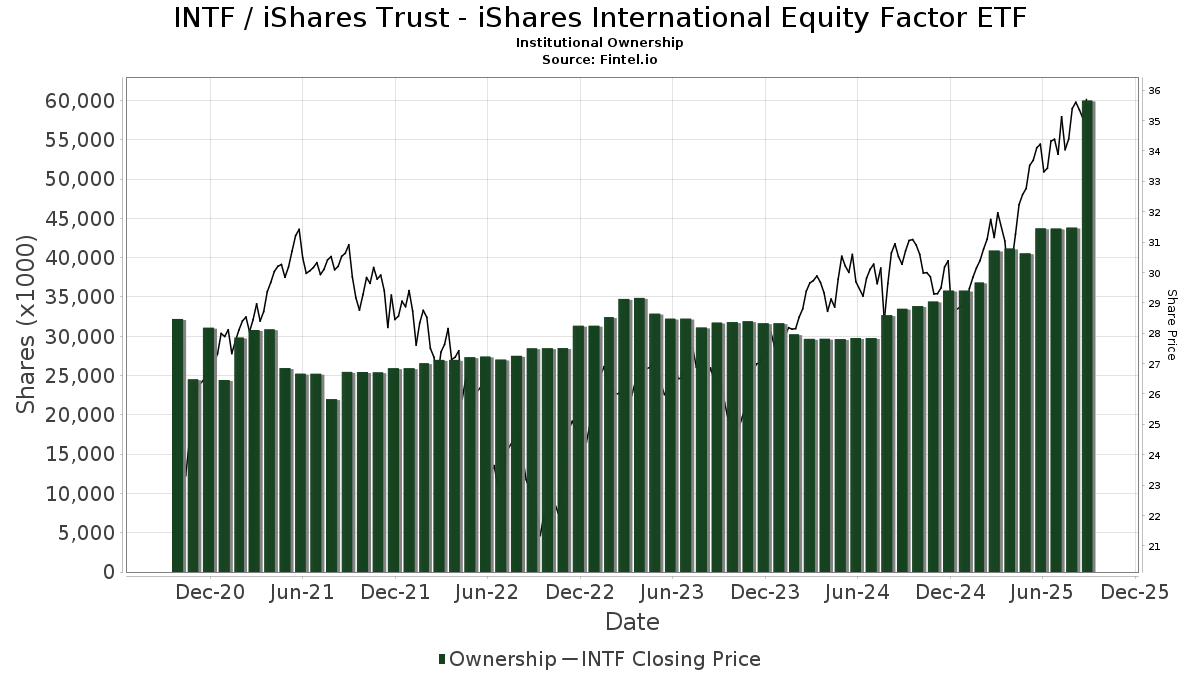
Institutionelt ejerskab og aktionærer
iShares Trust - iShares International Equity Factor ETF (US:INTF) har 173 institutionelle ejere og aktionærer, der har indsendt 13D/G- eller 13F-formularer til Securities Exchange Commission (SEC). Disse institutioner har i alt 59,990,784 aktier. Største aktionærer omfatter Northwestern Mutual Wealth Management Co, Strategic Financial Services, Inc,, Halbert Hargrove Global Advisors, Llc, Tolleson Wealth Management, Inc., Invesco Ltd., Clearwater Capital Advisors, LLC, Atomi Financial Group, Inc., Jpmorgan Chase & Co, Integrated Wealth Concepts LLC, and Kestra Investment Management, LLC .
iShares Trust - iShares International Equity Factor ETF (ARCA:INTF) institutionel ejerskabsstruktur viser aktuelle positioner i virksomheden efter institutioner og fonde, samt seneste ændringer i positionsstørrelse. Større aktionærer kan omfatte individuelle investorer, investeringsforeninger, hedgefonde eller institutioner. Skema 13D angiver, at investoren besidder (eller besidder) mere end 5 % af virksomheden og har til hensigt (eller har til hensigt at) aktivt at forfølge en ændring i forretningsstrategi. Skema 13G indikerer en passiv investering på over 5%.
The share price as of September 10, 2025 is 35,69 / share. Previously, on September 10, 2024, the share price was 30,10 / share. This represents an increase of 18,57% over that period.
Fondens stemningsscore
Fund Sentiment Score (fka Ownership Accumulation Score) finder de aktier, der bliver mest købt af fonde. Det er resultatet af en sofistikeret, multi-faktor kvantitativ model, der identificerer virksomheder med de højeste niveauer af institutionel akkumulering. Scoringsmodellen bruger en kombination af den samlede stigning i oplyste ejere, ændringerne i porteføljeallokeringer i disse ejere og andre målinger. Tallet går fra 0 til 100, hvor højere tal indikerer et højere niveau af akkumulering for sine jævnaldrende, og 50 er gennemsnittet.
Opdateringsfrekvens: Dagligt
Se Ownership Explorer, som giver en liste over højest rangerende virksomheder.
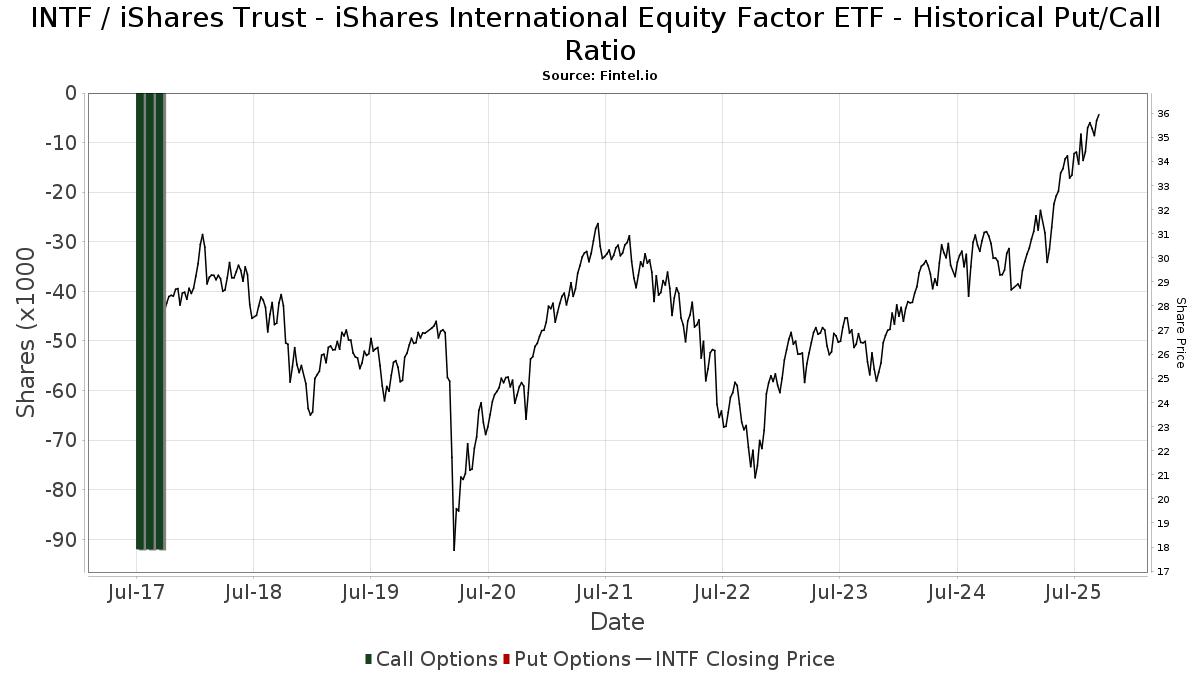
Institutionel Put/Call-forhold
Ud over at indberette standardaktie- og gældsudstedelser skal institutter med mere end 100 mill. aktiver under forvaltning også oplyse deres put- og call-optionsbeholdninger. Da salgsoptioner generelt indikerer negativ stemning, og købsoptioner indikerer positiv stemning, kan vi få en fornemmelse af den overordnede institutionelle stemning ved at plotte forholdet mellem put og kald. Diagrammet til højre viser det historiske put/call-forhold for dette instrument.
Brug af Put/Call Ratio som en indikator for investorernes stemning overvinder en af de vigtigste mangler ved at bruge totalt institutionelt ejerskab, som er, at en betydelig mængde af aktiver under forvaltning investeres passivt for at spore indekser. Passivt forvaltede fonde køber typisk ikke optioner, så indikatoren for put/call-forholdet følger mere nøje følelsen af aktivt forvaltede fonde.
13F og NPORT arkivering
Detaljer om 13F-arkivering er gratis. Detaljer om NP-ansøgninger kræver et premium-medlemskab. Grønne rækker angiver nye positioner. Røde rækker angiver lukkede positioner. Klik på linket ikon for at se den fulde transaktionshistorik.
Opgrader
for at låse premium-data op og eksportere til Excel ![]() .
.
| Fil dato | Kilde | Investor | Type | Gennemsnitlig pris (Øst) |
Aktier | Δ Aktier (%) |
Rapporteret Værdi ($1000) |
Δ Værdi (%) |
Port Alloc (%) |
|
|---|---|---|---|---|---|---|---|---|---|---|
| 2025-07-16 | 13F/A | CX Institutional | 7.469 | 1,69 | 0 | |||||
| 2025-08-13 | 13F | Beacon Pointe Advisors, LLC | 12.815 | 0,04 | 439 | 10,89 | ||||
| 2025-08-08 | 13F | Kingsview Wealth Management, LLC | 70.527 | -0,62 | 2.414 | 10,33 | ||||
| 2025-07-18 | 13F | SigFig Wealth Management, LLC | 123.649 | 3,95 | 4.225 | 14,22 | ||||
| 2025-05-07 | 13F | Horan Capital Advisors, LLC. | 6.642 | 205 | ||||||
| 2025-07-21 | 13F | HighMark Wealth Management LLC | 151 | 5 | ||||||
| 2025-04-21 | 13F | Nelson, Van Denburg & Campbell Wealth Management Group, LLC | 0 | -100,00 | 0 | -100,00 | ||||
| 2025-08-07 | 13F | Brio Consultants, LLC | 241.659 | 11,93 | 8.272 | 24,23 | ||||
| 2025-07-24 | 13F | Capital Advisors, Ltd. LLC | 13.268 | 0,23 | 0 | |||||
| 2025-08-14 | 13F | Operose Advisors LLC | 800 | 0,00 | 27 | 12,50 | ||||
| 2025-07-31 | 13F | AlTi Global, Inc. | 84.127 | -36,23 | 2.880 | -29,23 | ||||
| 2025-07-16 | 13F | New Insight Wealth Advisors | 19.982 | 41,93 | 684 | 57,37 | ||||
| 2025-08-14 | 13F | Mariner, LLC | 81.369 | 2,58 | 2.785 | 13,86 | ||||
| 2025-08-06 | 13F | North Capital, Inc. | 108 | 1,89 | 4 | 0,00 | ||||
| 2025-06-26 | NP | FINT - Frontier Asset Total International Equity ETF | 229.075 | -10,71 | 7.383 | -3,75 | ||||
| 2025-07-08 | 13F | RMR Wealth Builders | 9.874 | 338 | ||||||
| 2025-07-17 | 13F | LexAurum Advisors, LLC | 21.763 | -2,50 | 745 | 8,14 | ||||
| 2025-08-19 | 13F | Advisory Services Network, LLC | 6.000 | 203 | ||||||
| 2025-07-14 | 13F | U.S. Capital Wealth Advisors, LLC | 21.320 | 30,40 | 730 | 44,64 | ||||
| 2025-08-11 | 13F | Westover Capital Advisors, LLC | 0 | -100,00 | 0 | |||||
| 2025-08-13 | 13F | Cerity Partners LLC | 71.293 | -1,70 | 2.440 | 9,12 | ||||
| 2025-08-11 | 13F | Strategic Wealth Partners, Ltd. | 976 | 33 | ||||||
| 2025-08-12 | 13F | Blueprint Investment Partners LLC | 0 | -100,00 | 0 | |||||
| 2025-08-12 | 13F | Ascent Wealth Partners, LLC | 16.085 | 0,00 | 551 | 10,89 | ||||
| 2025-08-14 | 13F | Aqr Capital Management Llc | 36.543 | 19,66 | 1.251 | 32,84 | ||||
| 2025-08-01 | 13F | Strategic Financial Services, Inc, | 8.575.507 | -0,95 | 293.540 | 9,94 | ||||
| 2025-08-06 | 13F | AE Wealth Management LLC | 25 | 0,00 | 1 | |||||
| 2025-07-10 | 13F | Exchange Traded Concepts, Llc | 236.515 | -1,27 | 8.096 | 9,58 | ||||
| 2025-08-14 | 13F | Royal Bank Of Canada | 13.033 | 74,85 | 446 | 93,07 | ||||
| 2025-08-28 | 13F/A | Tolleson Wealth Management, Inc. | 2.851.077 | 4,34 | 97.592 | 15,81 | ||||
| 2025-05-14 | 13F | Van Hulzen Asset Management, LLC | 0 | -100,00 | 0 | -100,00 | ||||
| 2025-08-13 | 13F | Russell Investments Group, Ltd. | 831 | 28 | ||||||
| 2025-08-14 | 13F | Jane Street Group, Llc | 381.780 | 26,84 | 13.068 | 40,79 | ||||
| 2025-08-14 | 13F | Mml Investors Services, Llc | 12.246 | 1,44 | 0 | |||||
| 2025-08-07 | 13F | Vise Technologies, Inc. | 26.213 | 897 | ||||||
| 2025-08-07 | 13F | Weil Company, Inc. | 412.946 | 16,61 | 14.135 | 29,43 | ||||
| 2025-07-15 | 13F | EWG Elevate Inc. | 59.564 | 363,93 | 2.039 | 415,95 | ||||
| 2025-05-14 | 13F | CIBC Private Wealth Group, LLC | 0 | -100,00 | 0 | |||||
| 2025-07-08 | 13F | Baker Ellis Asset Management LLC | 27.800 | -9,74 | 952 | 0,21 | ||||
| 2025-08-13 | 13F | Summit Financial, LLC | 18.691 | -23,82 | 640 | -15,48 | ||||
| 2025-04-11 | 13F | Princeton Global Asset Management LLC | 0 | -100,00 | 0 | |||||
| 2025-08-14 | 13F | Susquehanna International Group, Llp | 76.066 | 63,18 | 2.604 | 81,14 | ||||
| 2025-08-14 | 13F | CIBC World Markets Inc. | 12.196 | 417 | ||||||
| 2025-08-07 | 13F | Allworth Financial LP | 2.020 | -6,09 | 69 | 1,47 | ||||
| 2025-08-14 | 13F | Atomi Financial Group, Inc. | 1.771.706 | 2,44 | 60.645 | 13,70 | ||||
| 2025-07-17 | 13F | HB Wealth Management, LLC | 14.015 | 63,54 | 480 | 81,44 | ||||
| 2025-08-14 | 13F | UBS Group AG | 441.395 | 1,91 | 15.109 | 13,11 | ||||
| 2025-08-14 | 13F | Diversify Advisory Services, LLC | 59.350 | 30,35 | 2.087 | 42,10 | ||||
| 2025-08-05 | 13F | Landmark Wealth Management, Inc. | 31.371 | 0,00 | 1.074 | 10,96 | ||||
| 2025-07-31 | 13F | Buckingham Strategic Partners | 6.051 | -7,79 | 207 | 2,48 | ||||
| 2025-08-06 | 13F | Commonwealth Equity Services, Llc | 91.289 | -8,20 | 3 | 0,00 | ||||
| 2025-07-10 | 13F | Orgel Wealth Management, LLC | 8.733 | 0,48 | 299 | 11,19 | ||||
| 2025-07-29 | 13F | Fundamentun, Llc | 61.760 | -3,27 | 2.114 | 7,42 | ||||
| 2025-08-15 | 13F | CI Private Wealth, LLC | 879.447 | -2,15 | 30.103 | 8,61 | ||||
| 2025-07-28 | 13F | ForthRight Wealth Management, LLC | 9.872 | 0,00 | 338 | 10,86 | ||||
| 2025-08-11 | 13F | Wealthspire Advisors, LLC | 13.158 | 0,91 | 450 | 11,94 | ||||
| 2025-08-14 | 13F | Qube Research & Technologies Ltd | 0 | -100,00 | 0 | |||||
| 2025-08-14 | 13F | Ameriprise Financial Inc | 1.059.484 | 61,24 | 36.264 | 78,96 | ||||
| 2025-08-14 | 13F/A | Rockefeller Capital Management L.P. | 65.252 | -1,58 | 2.234 | 9,25 | ||||
| 2025-08-12 | 13F | MAI Capital Management | 325 | 0,00 | 11 | 10,00 | ||||
| 2025-08-06 | 13F | HORAN Wealth, LLC | 6.642 | 227 | ||||||
| 2025-08-13 | 13F | Northwestern Mutual Wealth Management Co | 15.878.455 | 54.816,15 | 543.519 | 60.901,01 | ||||
| 2025-08-14 | 13F | Citadel Advisors Llc | 42.097 | 136,09 | 1.441 | 162,30 | ||||
| 2025-08-14 | 13F | Raymond James Financial Inc | 948.892 | -1,46 | 32.481 | 9,37 | ||||
| 2025-08-06 | 13F | DDFG, Inc | 226.977 | 1,97 | 7.769 | 13,18 | ||||
| 2025-07-31 | 13F | Cambridge Investment Research Advisors, Inc. | 88.910 | 31,82 | 3 | 50,00 | ||||
| 2025-08-13 | 13F | Flow Traders U.s. Llc | 0 | -100,00 | 0 | |||||
| 2025-08-14 | 13F | Colony Group, LLC | 123.915 | 65,82 | 4.242 | 84,07 | ||||
| 2025-08-14 | 13F | Mercer Global Advisors Inc /adv | 0 | -100,00 | 0 | |||||
| 2025-07-17 | 13F | Janney Montgomery Scott LLC | 18.765 | 0,00 | 1 | |||||
| 2025-07-24 | 13F | Us Bancorp \de\ | 3.977 | 0,00 | 136 | 11,48 | ||||
| 2025-08-04 | 13F | Atria Investments Llc | 101.440 | -8,11 | 3.472 | 2,00 | ||||
| 2025-07-17 | 13F | Halbert Hargrove Global Advisors, Llc | 3.195.954 | 0,44 | 109.397 | 11,47 | ||||
| 2025-08-05 | 13F | Meridian Management Co | 267.156 | -5,70 | 9.030 | 3,34 | ||||
| 2025-08-11 | 13F | HighTower Advisors, LLC | 273.723 | 5,08 | 9.370 | 16,63 | ||||
| 2025-04-16 | 13F | Smithbridge Asset Management Inc/de | 0 | -100,00 | 0 | -100,00 | ||||
| 2025-08-06 | 13F | Quadrant Private Wealth Management, LLC | 0 | -100,00 | 0 | |||||
| 2025-08-14 | 13F | Wells Fargo & Company/mn | 561.257 | -36,09 | 19.212 | -29,07 | ||||
| 2025-09-04 | 13F/A | Advisor Group Holdings, Inc. | 123.437 | 974,95 | 4.209 | 1.088,70 | ||||
| 2025-07-25 | 13F | Cwm, Llc | 851.829 | -6,62 | 29 | 3,57 | ||||
| 2025-07-25 | 13F | Hemington Wealth Management | 871 | 0,00 | 0 | |||||
| 2025-08-11 | 13F | Aptus Capital Advisors, LLC | 11.092 | 0,03 | 380 | 11,14 | ||||
| 2025-07-21 | 13F | Ameriflex Group, Inc. | 194 | 0,00 | 7 | 20,00 | ||||
| 2025-08-15 | 13F | Captrust Financial Advisors | 94.543 | 0,00 | 3.236 | 11,01 | ||||
| 2025-07-11 | 13F | Rockwood Wealth Management, LLC | 10.000 | 0,00 | 342 | 11,04 | ||||
| 2025-08-13 | 13F | Northern Trust Corp | 8.320 | 0,00 | 285 | 10,94 | ||||
| 2025-07-28 | 13F | Harbour Investments, Inc. | 30 | 1 | ||||||
| 2025-07-07 | 13F | Versant Capital Management, Inc | 4.452 | 0,00 | 152 | 10,95 | ||||
| 2025-07-24 | 13F | Blair William & Co/il | 125 | 0,00 | 4 | 33,33 | ||||
| 2025-08-18 | 13F/A | Kestra Investment Management, LLC | 1.237.354 | -45,98 | 42.355 | -40,04 | ||||
| 2025-04-23 | 13F | Mascagni Wealth Management, Inc. | 0 | -100,00 | 0 | -100,00 | ||||
| 2025-08-06 | 13F | Horan Securities, Inc. | 6.642 | 0,00 | 227 | 11,27 | ||||
| 2025-07-29 | 13F | Foster & Motley Inc | 410.664 | -11,87 | 14 | 0,00 | ||||
| 2025-07-25 | 13F | JustInvest LLC | 9.495 | -0,01 | 325 | 11,30 | ||||
| 2025-08-06 | 13F | Stokes Family Office, LLC | 807.176 | 41,47 | 27.630 | 57,03 | ||||
| 2025-08-12 | 13F | J.w. Cole Advisors, Inc. | 15.620 | 10,69 | 535 | 22,76 | ||||
| 2025-04-23 | 13F | Legacy Advisors, LLC | 0 | -100,00 | 0 | |||||
| 2025-08-01 | 13F | Envestnet Asset Management Inc | 1.055.237 | 8,29 | 36.121 | 20,20 | ||||
| 2025-05-12 | 13F | Independent Advisor Alliance | 0 | -100,00 | 0 | |||||
| 2025-08-12 | 13F | O'shaughnessy Asset Management, Llc | 7.005 | -14,27 | 240 | -4,78 | ||||
| 2025-08-14 | 13F | Obsido Oy | 259.933 | 1,66 | 8.898 | 12,83 | ||||
| 2025-08-14 | 13F | Ancora Advisors, LLC | 563 | 19 | ||||||
| 2025-07-10 | 13F | Sovran Advisors, LLC | 6.072 | 208 | ||||||
| 2025-08-15 | 13F | Morgan Stanley | 655.614 | -4,16 | 22.442 | 6,37 | ||||
| 2025-08-01 | 13F | First Command Advisory Services, Inc. | 760.428 | 3,89 | 26.029 | 15,03 | ||||
| 2025-08-14 | 13F | Smartleaf Asset Management LLC | 448 | -94,52 | 15 | -94,09 | ||||
| 2025-07-29 | 13F | Signature Estate & Investment Advisors Llc | 56.319 | -36,37 | 1.928 | -29,39 | ||||
| 2025-05-09 | 13F | Wade Financial Advisory, Inc | 318.745 | 9,44 | 9.830 | 17,53 | ||||
| 2025-08-06 | 13F | Savant Capital, LLC | 28.975 | -12,81 | 992 | -3,22 | ||||
| 2025-07-11 | 13F | Farther Finance Advisors, LLC | 203.335 | 8,57 | 6.960 | 20,25 | ||||
| 2025-08-13 | 13F | Avestar Capital, LLC | 145.907 | 28,85 | 4.994 | 43,01 | ||||
| 2025-07-10 | 13F | Wedmont Private Capital | 30.272 | 0,02 | 1.041 | 15,04 | ||||
| 2025-07-14 | 13F | Park Avenue Securities Llc | 9.570 | -0,57 | 0 | |||||
| 2025-07-14 | 13F | Seascape Capital Management | 13.851 | 2,37 | 0 | |||||
| 2025-07-21 | 13F | Pflug Koory, LLC | 500 | 0,00 | 17 | 13,33 | ||||
| 2025-08-12 | 13F | Clearwater Capital Advisors, LLC | 1.843.707 | -0,53 | 63.110 | 10,41 | ||||
| 2025-08-11 | 13F | Wescott Financial Advisory Group, LLC | 10.665 | -5,45 | 365 | 5,19 | ||||
| 2025-07-22 | 13F | Merit Financial Group, LLC | 15.104 | 1,68 | 517 | 12,88 | ||||
| 2025-08-27 | 13F | Stonebridge Wealth Management, LLC | 65.845 | 2.254 | ||||||
| 2025-08-14 | 13F | Financial Engines Advisors L.L.C. | 6.141 | 210 | ||||||
| 2025-08-08 | 13F | Cetera Investment Advisers | 11.238 | -21,93 | 385 | -13,32 | ||||
| 2025-08-12 | 13F | LPL Financial LLC | 250.523 | 179,48 | 8.575 | 210,24 | ||||
| 2025-07-10 | 13F | Sterling Financial Group, Inc. | 623.742 | 39,57 | 21.351 | 54,91 | ||||
| 2025-07-28 | 13F | Sagespring Wealth Partners, Llc | 148.756 | 19,17 | 5.092 | 32,27 | ||||
| 2025-08-12 | 13F | Proequities, Inc. | 0 | 0 | ||||||
| 2025-08-08 | 13F | Pnc Financial Services Group, Inc. | 1.466 | 0,00 | 50 | 11,11 | ||||
| 2025-08-11 | 13F | Citigroup Inc | 4.095 | 45,11 | 140 | 60,92 | ||||
| 2025-07-23 | 13F | Heck Capital Advisors, LLC | 59.956 | -42,41 | 2.052 | -36,07 | ||||
| 2025-08-08 | 13F | Avantax Advisory Services, Inc. | 19.799 | 0,09 | 678 | 10,98 | ||||
| 2025-08-14 | 13F | Wiley Bros.-aintree Capital, Llc | 10.817 | 0,00 | 370 | 10,12 | ||||
| 2025-08-07 | 13F | CENTRAL TRUST Co | 1.046 | 0,00 | 36 | 9,38 | ||||
| 2025-07-24 | 13F | IFP Advisors, Inc | 1.267 | 0,48 | 43 | 13,16 | ||||
| 2025-07-09 | 13F | Thrive Wealth Management, LLC | 341.743 | -6,75 | 11.698 | 3,49 | ||||
| 2025-08-14 | 13F | Integrated Wealth Concepts LLC | 1.344.337 | 11,10 | 46.017 | 23,31 | ||||
| 2025-07-18 | 13F | Bartlett & Co. Wealth Management Llc | 460 | -87,80 | 16 | -87,07 | ||||
| 2025-08-14 | 13F | Fmr Llc | 5.453 | 6,57 | 187 | 18,47 | ||||
| 2025-08-12 | 13F | Inscription Capital, LLC | 0 | -100,00 | 0 | |||||
| 2025-08-14 | 13F | Sunbelt Securities, Inc. | 197 | 0,00 | 6 | -16,67 | ||||
| 2025-08-13 | 13F | Summit Wealth Group Llc / Co | 13.052 | 447 | ||||||
| 2025-08-18 | 13F/A | National Bank Of Canada /fi/ | 5.964 | 0,00 | 204 | 11,48 | ||||
| 2025-08-13 | 13F | Colonial Trust Advisors | 520 | 0,00 | 18 | 6,25 | ||||
| 2025-08-13 | 13F | SageView Advisory Group, LLC | 8.228 | -0,66 | 282 | 10,59 | ||||
| 2025-07-09 | 13F | Archer Investment Management, LLC | 32.517 | -22,12 | 1.113 | -13,52 | ||||
| 2025-08-13 | 13F | Mount Yale Investment Advisors, LLC | 34.102 | 1.167 | ||||||
| 2025-07-31 | 13F | Cabot Wealth Management Inc | 56.430 | 1,28 | 1.932 | 12,40 | ||||
| 2025-08-27 | 13F | Barnes Wealth Management Group, Inc | 7.560 | -2,70 | 259 | 7,95 | ||||
| 2025-04-29 | 13F | Callan Capital, LLC | 749.022 | -2,67 | 23.100 | 4,52 | ||||
| 2025-08-05 | 13F | Dynasty Wealth Management, Llc | 108.416 | -12,15 | 3.711 | -2,47 | ||||
| 2025-08-19 | 13F | Newbridge Financial Services Group, Inc. | 27.544 | 943 | ||||||
| 2025-08-13 | 13F | GeoWealth Management, LLC | 10.847 | -13,29 | 371 | -3,64 | ||||
| 2025-08-07 | 13F | Parkside Financial Bank & Trust | 3.450 | 0,00 | 118 | 11,32 | ||||
| 2025-08-08 | 13F | Horizon Family Wealth, Inc. | 129.770 | 0,16 | 4.442 | 11,19 | ||||
| 2025-08-12 | 13F | Jpmorgan Chase & Co | 1.485.415 | 0,00 | 50.846 | 10,99 | ||||
| 2025-08-15 | 13F | Kestra Advisory Services, LLC | 90.606 | 1.085,32 | 3.101 | 1.219,57 | ||||
| 2025-07-10 | 13F | Wealth Enhancement Advisory Services, Llc | 7.206 | -39,28 | 247 | -32,51 | ||||
| 2025-08-13 | 13F | Invesco Ltd. | 2.520.000 | 0,00 | 86.260 | 10,99 | ||||
| 2025-04-10 | 13F | Retirement Planning Group | 0 | -100,00 | 0 | |||||
| 2025-08-14 | 13F | Modern Wealth Management, LLC | 750.747 | -2,90 | 25.698 | 7,78 | ||||
| 2025-04-22 | 13F/A | NorthRock Partners, LLC | 0 | -100,00 | 0 | -100,00 | ||||
| 2025-07-24 | 13F | GFG Capital, LLC | 0 | 0 | ||||||
| 2025-07-25 | 13F | RHS Financial, LLC | 120.956 | 22,83 | 4.140 | 36,36 | ||||
| 2025-08-05 | 13F | Magnolia Capital Advisors Llc | 45.591 | 26,35 | 1.561 | 40,29 | ||||
| 2025-07-31 | 13F | Sage Mountain Advisors LLC | 42.634 | 1,96 | 1.459 | 13,19 | ||||
| 2025-08-08 | 13F | Gts Securities Llc | 21.199 | 726 | ||||||
| 2025-08-14 | 13F | EP Wealth Advisors, Inc. | 7.248 | 0,01 | 248 | 11,21 | ||||
| 2025-08-14 | 13F | GWM Advisors LLC | 18.448 | -18,00 | 631 | -8,95 | ||||
| 2025-07-29 | 13F | Private Trust Co Na | 827 | 28 | ||||||
| 2025-08-11 | 13F | CFS Investment Advisory Services, LLC | 30.824 | -10,31 | 1 | 0,00 | ||||
| 2025-08-08 | 13F | Creative Planning | 70.731 | -0,94 | 2.421 | 9,95 | ||||
| 2025-07-30 | 13F | Phillips Financial Management, Llc | 318.396 | -19,45 | 10.899 | -10,61 | ||||
| 2025-08-11 | 13F | Principal Securities, Inc. | 37.914 | 5.129,52 | 1.298 | 6.385,00 | ||||
| 2025-08-06 | 13F | Mark Sheptoff Financial Planning, Llc | 35 | 0,00 | 1 | 0,00 | ||||
| 2025-08-04 | 13F | Beirne Wealth Consulting Services, LLC | 108.240 | 2,37 | 3.706 | 13,62 | ||||
| 2025-08-14 | 13F | Bank Of America Corp /de/ | 337.171 | 1,67 | 11.541 | 12,85 | ||||
| 2025-07-25 | 13F | Concord Wealth Partners | 0 | -100,00 | 0 | |||||
| 2025-08-05 | 13F | Sigma Planning Corp | 26.603 | 911 | ||||||
| 2025-07-23 | 13F | Armbruster Capital Management, Inc. | 32.775 | 39,02 | 1.122 | 54,20 | ||||
| 2025-07-16 | 13F | Signature Resources Capital Management, LLC | 1.576 | 0,00 | 54 | 10,42 | ||||
| 2025-08-06 | 13F | Stone House Investment Management, LLC | 1.069 | 37 | ||||||
| 2025-08-15 | 13F | Equitable Holdings, Inc. | 113.540 | 37,21 | 3.886 | 52,27 | ||||
| 2025-07-23 | 13F | Citizens National Bank Trust Department | 135.288 | -1,23 | 4.631 | 9,61 | ||||
| 2025-08-13 | 13F | Jones Financial Companies Lllp | 123.974 | 23,30 | 4.236 | 35,51 | ||||
| 2025-07-24 | 13F | Edge Financial Advisors LLC | 33.340 | -17,02 | 1.141 | -7,91 | ||||
| 2025-08-14 | 13F | Snowden Capital Advisors LLC | 9.982 | 0,00 | 342 | 11,07 | ||||
| 2025-07-14 | 13F | GAMMA Investing LLC | 1.006 | 0,00 | 34 | 9,68 | ||||
| 2025-08-04 | 13F | Assetmark, Inc | 101 | -95,58 | 3 | -95,71 | ||||
| 2025-07-09 | 13F | Lincoln Capital Corp | 46.920 | -2,50 | 1.606 | 8,22 | ||||
| 2025-07-14 | 13F | Acropolis Investment Management, LLC | 301.413 | 4,14 | 10.317 | 15,60 | ||||
| 2025-08-14 | 13F | 10Elms LLP | 2.069 | 0,00 | 71 | 11,11 | ||||
| 2025-08-08 | 13F | Capital Investment Advisory Services, LLC | 8.160 | -60,28 | 279 | -55,92 | ||||
| 2025-08-12 | 13F | Global Retirement Partners, LLC | 220 | 0,00 | 8 | 16,67 | ||||
| 2025-08-11 | 13F | Private Advisor Group, LLC | 6.395 | 219 | ||||||
| 2025-08-14 | 13F/A | Skopos Labs, Inc. | 395 | 14 |