Grundlæggende statistik
| Institutionelle ejere | 152 total, 152 long only, 0 short only, 0 long/short - change of 5,52% MRQ |
| Gennemsnitlig porteføljeallokering | 0.3499 % - change of -9,07% MRQ |
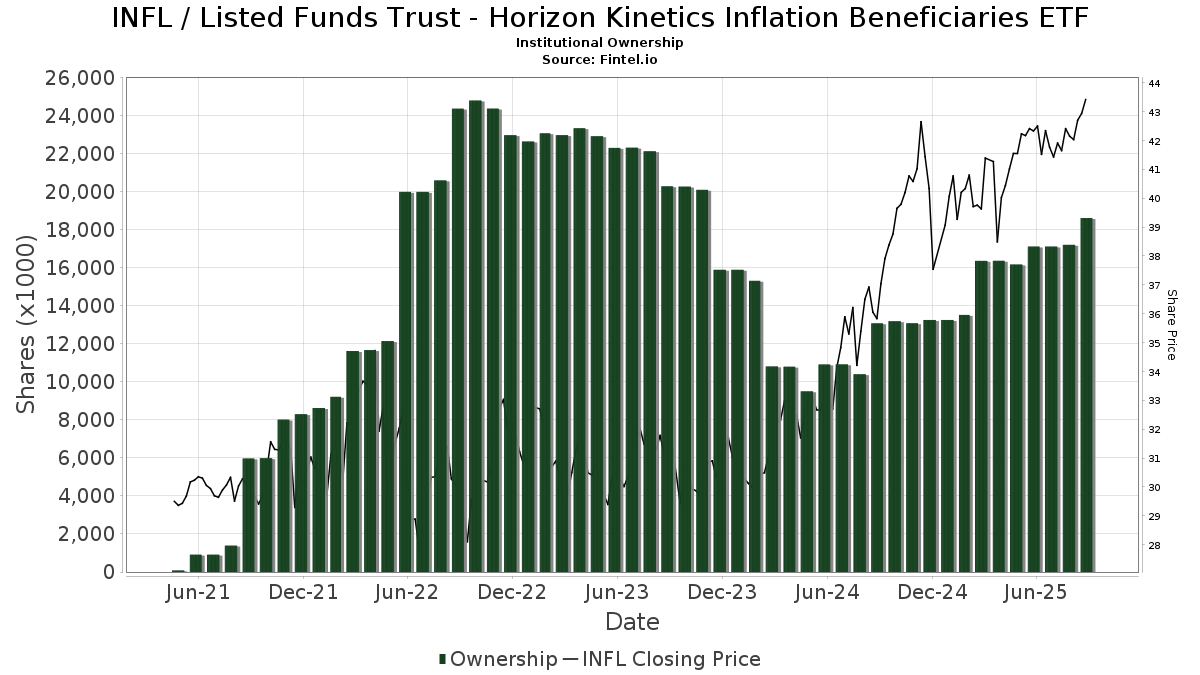
| Institutionelle aktier (lange) | 18.627.973 (ex 13D/G) - change of 1,50MM shares 8,78% MRQ |
| Institutionel værdi (lang) | $ 755.243 USD ($1000) |
Institutionelt ejerskab og aktionærer
Listed Funds Trust - Horizon Kinetics Inflation Beneficiaries ETF (US:INFL) har 152 institutionelle ejere og aktionærer, der har indsendt 13D/G- eller 13F-formularer til Securities Exchange Commission (SEC). Disse institutioner har i alt 18,627,973 aktier. Største aktionærer omfatter Jpmorgan Chase & Co, Oxford Financial Group Ltd, LPL Financial LLC, Wells Fargo & Company/mn, Royal Bank Of Canada, One Charles Private Wealth Services, LLC, Rockefeller Capital Management L.P., UBS Group AG, Bank of New York Mellon Corp, and Janney Montgomery Scott LLC .
Listed Funds Trust - Horizon Kinetics Inflation Beneficiaries ETF (ARCA:INFL) institutionel ejerskabsstruktur viser aktuelle positioner i virksomheden efter institutioner og fonde, samt seneste ændringer i positionsstørrelse. Større aktionærer kan omfatte individuelle investorer, investeringsforeninger, hedgefonde eller institutioner. Skema 13D angiver, at investoren besidder (eller besidder) mere end 5 % af virksomheden og har til hensigt (eller har til hensigt at) aktivt at forfølge en ændring i forretningsstrategi. Skema 13G indikerer en passiv investering på over 5%.
The share price as of September 17, 2025 is 43,52 / share. Previously, on September 18, 2024, the share price was 37,04 / share. This represents an increase of 17,49% over that period.
Fondens stemningsscore
Fund Sentiment Score (fka Ownership Accumulation Score) finder de aktier, der bliver mest købt af fonde. Det er resultatet af en sofistikeret, multi-faktor kvantitativ model, der identificerer virksomheder med de højeste niveauer af institutionel akkumulering. Scoringsmodellen bruger en kombination af den samlede stigning i oplyste ejere, ændringerne i porteføljeallokeringer i disse ejere og andre målinger. Tallet går fra 0 til 100, hvor højere tal indikerer et højere niveau af akkumulering for sine jævnaldrende, og 50 er gennemsnittet.
Opdateringsfrekvens: Dagligt
Se Ownership Explorer, som giver en liste over højest rangerende virksomheder.
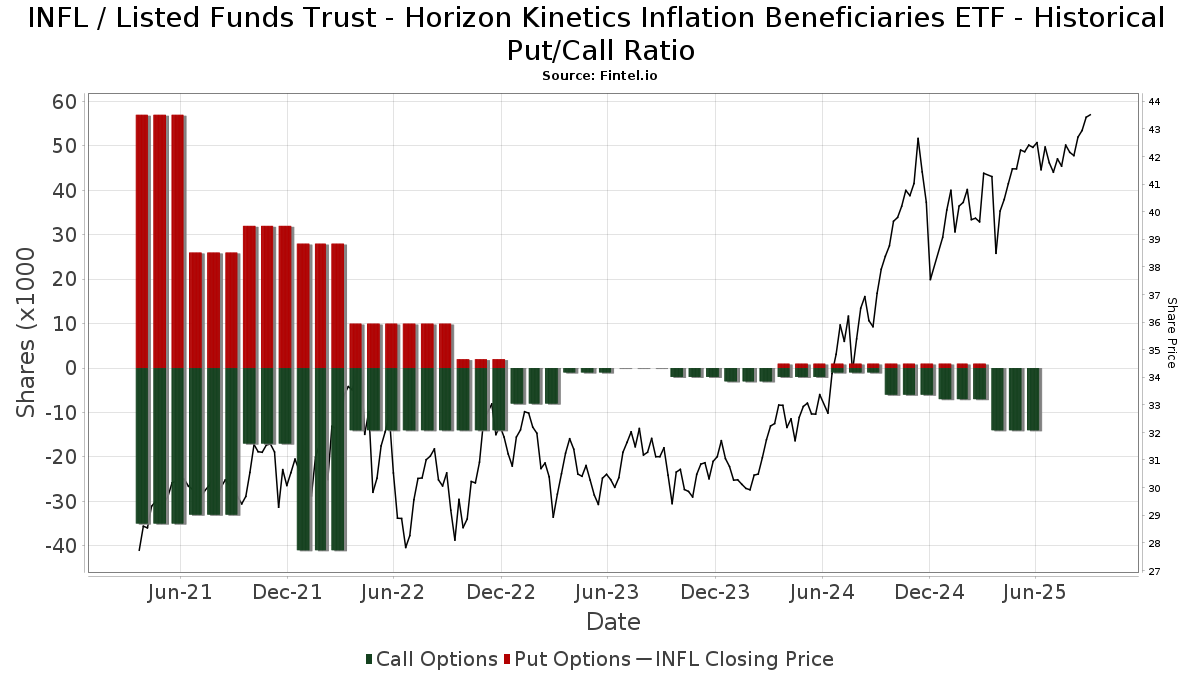
Institutionel Put/Call-forhold
Ud over at indberette standardaktie- og gældsudstedelser skal institutter med mere end 100 mill. aktiver under forvaltning også oplyse deres put- og call-optionsbeholdninger. Da salgsoptioner generelt indikerer negativ stemning, og købsoptioner indikerer positiv stemning, kan vi få en fornemmelse af den overordnede institutionelle stemning ved at plotte forholdet mellem put og kald. Diagrammet til højre viser det historiske put/call-forhold for dette instrument.
Brug af Put/Call Ratio som en indikator for investorernes stemning overvinder en af de vigtigste mangler ved at bruge totalt institutionelt ejerskab, som er, at en betydelig mængde af aktiver under forvaltning investeres passivt for at spore indekser. Passivt forvaltede fonde køber typisk ikke optioner, så indikatoren for put/call-forholdet følger mere nøje følelsen af aktivt forvaltede fonde.
13F og NPORT arkivering
Detaljer om 13F-arkivering er gratis. Detaljer om NP-ansøgninger kræver et premium-medlemskab. Grønne rækker angiver nye positioner. Røde rækker angiver lukkede positioner. Klik på linket ikon for at se den fulde transaktionshistorik.
Opgrader
for at låse premium-data op og eksportere til Excel ![]() .
.
| Fil dato | Kilde | Investor | Type | Gennemsnitlig pris (Øst) |
Aktier | Δ Aktier (%) |
Rapporteret Værdi ($1000) |
Δ Værdi (%) |
Port Alloc (%) |
|
|---|---|---|---|---|---|---|---|---|---|---|
| 2025-08-25 | 13F/A | Promus Capital, LLC | 300 | 0,00 | 13 | 0,00 | ||||
| 2025-07-15 | 13F | Mather Group, Llc. | 0 | -100,00 | 0 | |||||
| 2025-09-04 | 13F/A | Advisor Group Holdings, Inc. | 39.704 | 282,54 | 1.674 | 297,62 | ||||
| 2025-08-14 | 13F | TT Capital Management LLC | 9.362 | 386 | ||||||
| 2025-08-14 | 13F | GWM Advisors LLC | 12.009 | 9,36 | 506 | 13,45 | ||||
| 2025-08-12 | 13F | Waterloo Capital, L.P. | 95.399 | 4.023 | ||||||
| 2025-08-14 | 13F | Mml Investors Services, Llc | 7.053 | -9,44 | 0 | |||||
| 2025-04-23 | 13F | VisionPoint Advisory Group, LLC | 0 | -100,00 | 0 | |||||
| 2025-08-12 | 13F | CIBC Private Wealth Group, LLC | 41 | 2 | ||||||
| 2025-07-10 | 13F | Focus Financial Network, Inc. | 4.937 | -1,24 | 208 | 2,46 | ||||
| 2025-07-14 | 13F | Painted Porch Advisors LLC | 420 | 0,00 | 18 | 0,00 | ||||
| 2025-07-16 | 13F | Essex Financial Services, Inc. | 4.788 | 202 | ||||||
| 2025-07-29 | 13F | Private Trust Co Na | 865 | 801,04 | 36 | 1.100,00 | ||||
| 2025-08-06 | 13F | Garrison Point Advisors, Llc | 9.929 | -2,74 | 419 | 0,97 | ||||
| 2025-08-08 | 13F | EagleClaw Capital Managment, LLC | 87.555 | 1,14 | 3.692 | 4,92 | ||||
| 2025-07-28 | 13F | Copia Wealth Management | 12.469 | 55,32 | 526 | 61,04 | ||||
| 2025-07-14 | 13F | GAMMA Investing LLC | 840 | 0,00 | 35 | 2,94 | ||||
| 2025-07-31 | 13F | Brinker Capital Investments, LLC | 0 | -100,00 | 0 | -100,00 | ||||
| 2025-07-08 | 13F | Lowe Wealth Advisors, LLC | 245.118 | 4,16 | 10.337 | 8,05 | ||||
| 2025-08-08 | 13F | Creative Planning | 6.547 | -0,86 | 276 | 2,99 | ||||
| 2025-05-15 | 13F | Hrt Financial Lp | 0 | -100,00 | 0 | |||||
| 2025-08-01 | 13F | Bank of Jackson Hole Trust | 1.433 | 60 | ||||||
| 2025-08-07 | 13F | King Luther Capital Management Corp | 696 | 3,73 | ||||||
| 2025-08-14 | 13F | Colony Group, LLC | 40.288 | 70,85 | 1.699 | 77,24 | ||||
| 2025-08-13 | 13F | Cresset Asset Management, LLC | 29.857 | 0,00 | 1.259 | 3,79 | ||||
| 2025-08-15 | 13F | CI Private Wealth, LLC | 84.636 | 3.569 | ||||||
| 2025-08-06 | 13F | Moors & Cabot, Inc. | 120.943 | -9,90 | 5.100 | -6,52 | ||||
| 2025-07-21 | 13F/A | Abacus Planning Group, Inc. | 47.345 | 21,78 | 1.997 | 26,33 | ||||
| 2025-08-11 | 13F | HighTower Advisors, LLC | 96.756 | -4,17 | 4.080 | -0,58 | ||||
| 2025-07-30 | 13F | Lionsbridge Wealth Management LLC | 41.706 | -1,80 | 1.759 | 1,85 | ||||
| 2025-08-14 | 13F | Wells Fargo & Company/mn | 660.707 | 39,10 | 27.862 | 44,31 | ||||
| 2025-08-12 | 13F | Auxano Advisors, LLC | 12.897 | -25,61 | 544 | -22,87 | ||||
| 2025-07-31 | 13F | Carlton Hofferkamp & Jenks Wealth Management, LLC | 8.054 | -8,48 | 335 | -4,83 | ||||
| 2025-08-14 | 13F | Fmr Llc | 4 | 300,00 | 0 | |||||
| 2025-07-15 | 13F | Evanson Asset Management, LLC | 9.533 | 0,43 | 402 | 4,16 | ||||
| 2025-07-18 | 13F | Trilogy Capital Inc. | 22.615 | -7,18 | 954 | -3,74 | ||||
| 2025-08-14 | 13F | D. E. Shaw & Co., Inc. | 11.849 | -3,08 | 500 | 0,60 | ||||
| 2025-08-14 | 13F | Mariner, LLC | 10.498 | 87,46 | 443 | 94,71 | ||||
| 2025-08-11 | 13F | Wealthspire Advisors, LLC | 39.267 | 3,40 | 1.656 | 7,26 | ||||
| 2025-08-14 | 13F | Hilltop Holdings Inc. | 69.407 | 2.927 | ||||||
| 2025-07-30 | 13F | Schwartz Investment Counsel Inc | 19.000 | 0,00 | 801 | 3,76 | ||||
| 2025-08-12 | 13F | Meridian Wealth Advisors, LLC | 14.778 | 48,25 | 623 | 53,83 | ||||
| 2025-08-19 | 13F | National Asset Management, Inc. | 7.346 | -17,89 | 310 | -9,12 | ||||
| 2025-08-07 | 13F | Resources Investment Advisors, LLC. | 73.142 | 0,25 | 3.084 | 4,01 | ||||
| 2025-08-14 | 13F | Intrepid Family Office Llc | 85.000 | 0,00 | 3.584 | 3,73 | ||||
| 2025-08-15 | 13F | Captrust Financial Advisors | 261.245 | -0,37 | 11.017 | 3,36 | ||||
| 2025-07-11 | 13F | Compass Ion Advisors, LLC | 38.766 | -1,14 | 1.635 | 2,57 | ||||
| 2025-08-14 | 13F/A | Rockefeller Capital Management L.P. | 338.868 | 12,74 | 14.290 | 16,96 | ||||
| 2025-08-14 | 13F | Warren Averett Asset Management, LLC | 14.412 | 608 | ||||||
| 2025-07-10 | 13F | Wealth Enhancement Advisory Services, Llc | 25.760 | 0,00 | 1.094 | 4,39 | ||||
| 2025-08-13 | 13F | Baird Financial Group, Inc. | 122.583 | -1,64 | 5.169 | 2,03 | ||||
| 2025-05-02 | 13F | BlackRock, Inc. | 0 | -100,00 | 0 | |||||
| 2025-08-01 | 13F | Envestnet Asset Management Inc | 156.922 | 11,83 | 6.617 | 16,01 | ||||
| 2025-08-14 | 13F | STAR Financial Bank | 0 | -100,00 | 0 | |||||
| 2025-07-30 | NP | ENDW - Cambria Endowment Style ETF | 1.643 | 69 | ||||||
| 2025-08-06 | 13F | Commonwealth Equity Services, Llc | 274.555 | 0,95 | 12 | 0,00 | ||||
| 2025-08-18 | 13F | Second Line Capital, LLC | 5.184 | -6,26 | 219 | -2,68 | ||||
| 2025-08-05 | 13F | Atlas Wealth Partners, LLC | 121.905 | 1,35 | 5 | 25,00 | ||||
| 2025-07-29 | 13F | Stratos Wealth Advisors, LLC | 50.199 | 9,34 | 2.117 | 13,40 | ||||
| 2025-08-13 | 13F | Northwestern Mutual Wealth Management Co | 61 | -12,86 | 3 | 0,00 | ||||
| 2025-07-21 | 13F | Ameriflex Group, Inc. | 1.208 | 0,00 | 51 | 2,04 | ||||
| 2025-08-14 | 13F | Coastal Bridge Advisors, LLC | 35.855 | 5,39 | 1.512 | 9,33 | ||||
| 2025-08-11 | 13F | Aptus Capital Advisors, LLC | 199.321 | 100,44 | 8.405 | 107,94 | ||||
| 2025-08-01 | 13F | Bessemer Group Inc | 38 | 0,00 | 0 | |||||
| 2025-08-08 | 13F | Pnc Financial Services Group, Inc. | 9.078 | -12,15 | 383 | -9,05 | ||||
| 2025-07-31 | 13F | Trademark Financial Management, LLC | 9.989 | 4,07 | 421 | 7,95 | ||||
| 2025-07-16 | 13F | One + One Wealth Management, Llc | 0 | -100,00 | 0 | |||||
| 2025-07-31 | 13F | Cambridge Investment Research Advisors, Inc. | 19.658 | -24,34 | 1 | -100,00 | ||||
| 2025-08-14 | 13F | Principia Wealth Advisory, LLC | 8.838 | 13,76 | 372 | 24,41 | ||||
| 2025-08-14 | 13F | Citadel Advisors Llc | Put | 0 | -100,00 | 0 | ||||
| 2025-08-14 | 13F | Citadel Advisors Llc | Call | 0 | -100,00 | 0 | ||||
| 2025-08-12 | 13F | Steward Partners Investment Advisory, Llc | 49.918 | -0,05 | 2.105 | 3,69 | ||||
| 2025-04-04 | 13F | Quent Capital, LLC | 0 | -100,00 | 0 | |||||
| 2025-07-30 | 13F | Cullen/frost Bankers, Inc. | 122.600 | -28,72 | 5.170 | -26,05 | ||||
| 2025-07-31 | 13F | Oppenheimer & Co Inc | 11.474 | -1,73 | 484 | 1,90 | ||||
| 2025-08-05 | 13F | Sigma Planning Corp | 9.388 | 0,10 | 396 | 3,67 | ||||
| 2025-08-14 | 13F | Coppell Advisory Solutions LLC | 0 | -100,00 | 0 | |||||
| 2025-05-07 | 13F | Spectrum Wealth Counsel, LLC | 3.861 | 0,00 | 157 | 6,12 | ||||
| 2025-07-22 | 13F | DAVENPORT & Co LLC | 51.514 | 1,86 | 2.172 | 5,69 | ||||
| 2025-07-31 | 13F | Leavell Investment Management, Inc. | 34.101 | 1.438 | ||||||
| 2025-08-14 | 13F | Stifel Financial Corp | 41.591 | 54,72 | 1.754 | 60,53 | ||||
| 2025-07-15 | 13F | Cranbrook Wealth Management, LLC | 0 | -100,00 | 0 | |||||
| 2025-08-15 | 13F | Morgan Stanley | 32.413 | 427,56 | 1.367 | 448,59 | ||||
| 2025-07-08 | 13F | Baker Ellis Asset Management LLC | 21.570 | -7,89 | 910 | -4,42 | ||||
| 2025-07-24 | 13F | JNBA Financial Advisors | 16.941 | -8,83 | 714 | -5,43 | ||||
| 2025-08-11 | 13F | NewEdge Wealth, LLC | 85.558 | 0,01 | 3.594 | 3,36 | ||||
| 2025-08-13 | 13F | Financial Freedom, LLC | 215 | 0,47 | 9 | 12,50 | ||||
| 2025-08-07 | 13F | Proficio Capital Partners LLC | 66.315 | 370,99 | 2.797 | 388,81 | ||||
| 2025-07-16 | 13F | Perigon Wealth Management, LLC | 12.000 | 0,00 | 506 | 3,90 | ||||
| 2025-08-14 | 13F | Guardian Wealth Advisors, Llc / Nc | 96.004 | 6,77 | 4.048 | 10,75 | ||||
| 2025-08-08 | 13F | Cetera Investment Advisers | 9.905 | 12,40 | 418 | 16,48 | ||||
| 2025-08-14 | 13F | Comerica Bank | 1.019 | -29,24 | 43 | -27,59 | ||||
| 2025-08-14 | 13F | Ausdal Financial Partners, Inc. | 14.234 | -4,12 | 600 | -0,50 | ||||
| 2025-07-23 | 13F | Pure Portfolios Holdings Llc | 16.217 | 6,19 | 684 | 10,16 | ||||
| 2025-08-14 | 13F | First Foundation Advisors | 37.762 | 1.592 | ||||||
| 2025-08-13 | 13F | Beacon Pointe Advisors, LLC | 17.461 | 736 | ||||||
| 2025-08-13 | 13F | Scotia Capital Inc. | 4.870 | 205 | ||||||
| 2025-07-31 | 13F | Stegent Equity Advisors, Inc. | 20.373 | -0,85 | 859 | 2,87 | ||||
| 2025-08-13 | 13F | Truvestments Capital Llc | 0 | -100,00 | 0 | |||||
| 2025-08-18 | 13F/A | Kestra Investment Management, LLC | 149.653 | -46,30 | 6.311 | -44,30 | ||||
| 2025-07-17 | 13F | Janney Montgomery Scott LLC | 279.661 | 10,49 | 12 | 10,00 | ||||
| 2025-07-29 | 13F | Straight Path Wealth Management | 17.355 | 3,58 | 732 | 7,34 | ||||
| 2025-07-30 | 13F | Phillips Financial Management, Llc | 20.816 | 871 | ||||||
| 2025-07-14 | 13F | U.S. Capital Wealth Advisors, LLC | 7.100 | 24,56 | 299 | 29,44 | ||||
| 2025-07-31 | 13F | Longview Financial Advisors, Inc. | 165.818 | -1,74 | 6.993 | 1,94 | ||||
| 2025-07-18 | 13F | Philip James Wealth Mangement, LLC | 150.777 | 1,24 | 6.358 | 5,02 | ||||
| 2025-07-28 | 13F | Mowery & Schoenfeld Wealth Management, LLC | 0 | -100,00 | 0 | |||||
| 2025-08-18 | NP | GVEQX - Government Street Equity Fund | 25.000 | 1.054 | ||||||
| 2025-08-11 | 13F | Aspen Investment Management Inc | 5.914 | 0,00 | 0 | |||||
| 2025-08-14 | 13F | Raymond James Financial Inc | 173.656 | 2,70 | 7.323 | 6,55 | ||||
| 2025-07-17 | 13F | Moody Lynn & Lieberson, Llc | 0 | -100,00 | 0 | |||||
| 2025-08-14 | 13F | Jane Street Group, Llc | 25.264 | 260,97 | 1.065 | 275,00 | ||||
| 2025-08-14 | 13F | UBS Group AG | 336.085 | -14,65 | 14.173 | -11,46 | ||||
| 2025-08-13 | 13F | Congress Wealth Management LLC / DE / | 20.558 | 0,62 | 867 | 4,34 | ||||
| 2025-08-14 | 13F | Qube Research & Technologies Ltd | 2.674 | -56,19 | 113 | -54,84 | ||||
| 2025-07-29 | 13F | Stratos Wealth Partners, LTD. | 36.294 | 0,75 | 1.531 | 4,51 | ||||
| 2025-05-06 | 13F | Hamilton Point Investment Advisors, LLC | Call | 0 | -100,00 | 0 | ||||
| 2025-08-11 | 13F | Private Advisor Group, LLC | 33.531 | 238,70 | 1.414 | 251,49 | ||||
| 2025-08-12 | 13F | LPL Financial LLC | 1.188.679 | 4,52 | 50.127 | 8,43 | ||||
| 2025-08-12 | 13F | Horizon Kinetics Asset Management Llc | 102.956 | 4,69 | 4.342 | 8,61 | ||||
| 2025-08-12 | 13F | Global Retirement Partners, LLC | 62 | 3 | ||||||
| 2025-05-14 | 13F | Flow Traders U.s. Llc | 0 | -100,00 | 0 | |||||
| 2025-07-30 | 13F | D.a. Davidson & Co. | 5.238 | 221 | ||||||
| 2025-07-08 | 13F | Nbc Securities, Inc. | 100 | 0,00 | 0 | |||||
| 2025-07-21 | 13F | Hilltop National Bank | 188.413 | 51,81 | 7.945 | 68,11 | ||||
| 2025-08-01 | 13F | Ferguson Shapiro LLC | 15.181 | -18,94 | 640 | -15,90 | ||||
| 2025-08-05 | 13F | Bank Of Montreal /can/ | 2.100 | 16,67 | 89 | 20,55 | ||||
| 2025-08-12 | 13F | One Charles Private Wealth Services, LLC | 496.766 | 1,87 | 20.949 | 5,68 | ||||
| 2025-08-08 | 13F | Gts Securities Llc | 26.717 | 272,36 | 1.127 | 286,94 | ||||
| 2025-08-14 | 13F | Susquehanna International Group, Llp | 42.054 | 20,17 | 1.773 | 24,68 | ||||
| 2025-08-12 | 13F | Jpmorgan Chase & Co | 4.775.405 | 15,15 | 201.379 | 19,45 | ||||
| 2025-08-14 | 13F | Susquehanna International Group, Llp | Call | 14.700 | 620 | |||||
| 2025-08-14 | 13F | LM Advisors LLC | 7.074 | 0 | ||||||
| 2025-07-29 | 13F | Mezzasalma Advisors, LLC | 14.805 | 0,43 | 624 | 4,17 | ||||
| 2025-08-14 | 13F | Smartleaf Asset Management LLC | 63 | 0,00 | 3 | 0,00 | ||||
| 2025-07-24 | 13F | IFP Advisors, Inc | 110.448 | -4,99 | 4.658 | -2,45 | ||||
| 2025-08-07 | 13F | Guidance Capital, Inc | 22.667 | 9,37 | 932 | 8,12 | ||||
| 2025-08-13 | 13F | Crescent Grove Advisors, LLC | 0 | -100,00 | 0 | |||||
| 2025-07-24 | 13F | Us Bancorp \de\ | 31 | -46,55 | 1 | -50,00 | ||||
| 2025-08-14 | 13F | CoreCap Advisors, LLC | 158 | 0,00 | 7 | 0,00 | ||||
| 2025-07-28 | 13F | BRYN MAWR TRUST Co | 478 | 16,30 | 20 | 25,00 | ||||
| 2025-08-04 | 13F | Spire Wealth Management | 44.985 | -1,64 | 1.897 | 2,04 | ||||
| 2025-08-07 | 13F | New England Private Wealth Advisors LLC | 7.725 | 322 | ||||||
| 2025-08-14 | 13F | NCM Capital Management, LLC | 107.349 | 15,47 | 4.526 | 19,77 | ||||
| 2025-07-22 | 13F | Autumn Glory Partners, LLC | 13.623 | 0,00 | 574 | 3,80 | ||||
| 2025-08-14 | 13F | Group One Trading, L.p. | 100 | 4 | ||||||
| 2025-08-14 | 13F | Pecaut & Co. | 48.150 | 0,00 | 2.030 | 3,73 | ||||
| 2025-08-05 | 13F | Simplex Trading, Llc | 37 | 0 | ||||||
| 2025-07-21 | 13F | Ameritas Advisory Services, LLC | 741 | 31 | ||||||
| 2025-08-14 | 13F | Citadel Advisors Llc | 0 | -100,00 | 0 | |||||
| 2025-08-13 | 13F | Kayne Anderson Rudnick Investment Management Llc | 0 | -100,00 | 0 | |||||
| 2025-08-11 | 13F | Blue Bell Private Wealth Management, Llc | 2.050 | 0,00 | 86 | 3,61 | ||||
| 2025-08-19 | 13F | Advisory Services Network, LLC | 49.541 | 265,99 | 2.048 | 272,36 | ||||
| 2025-08-13 | 13F | Independent Family Office, LLC | 134.886 | 28,03 | 5.763 | 34,56 | ||||
| 2025-08-14 | 13F | Royal Bank Of Canada | 639.896 | 16,23 | 26.984 | 20,57 | ||||
| 2025-08-13 | 13F | SCS Capital Management LLC | 113.925 | -0,64 | 4.804 | 3,09 | ||||
| 2025-08-14 | 13F | Bank Of America Corp /de/ | 2.115 | -33,07 | 89 | -30,47 | ||||
| 2025-07-11 | 13F | Caldwell Securities, Inc | 0 | -100,00 | 0 | |||||
| 2025-07-22 | 13F | Macroview Investment Management Llc | 7.874 | 0,08 | 332 | 4,08 | ||||
| 2025-07-16 | 13F | Magnus Financial Group LLC | 4.773 | 201 | ||||||
| 2025-08-05 | 13F | Aviance Capital Partners, LLC | 5.897 | 0,10 | 249 | 3,77 | ||||
| 2025-07-31 | 13F | Briaud Financial Planning, Inc | 712 | 0,00 | 0 | |||||
| 2025-08-13 | 13F | Cerity Partners LLC | 42.852 | 3,97 | 1.807 | 7,88 | ||||
| 2025-08-13 | 13F | Twin Peaks Wealth Advisors, LLC | 233 | 10 | ||||||
| 2025-07-08 | 13F | Parallel Advisors, LLC | 50 | 0,00 | 2 | 0,00 | ||||
| 2025-08-08 | 13F | Larson Financial Group LLC | 0 | -100,00 | 0 | |||||
| 2025-08-14 | 13F | Atomi Financial Group, Inc. | 20.131 | 51,16 | 849 | 56,75 | ||||
| 2025-08-04 | 13F | Atria Investments Llc | 15.094 | 62,02 | 637 | 68,25 | ||||
| 2025-08-12 | 13F | Proequities, Inc. | 0 | 0 | ||||||
| 2025-07-16 | 13F | Signaturefd, Llc | 211 | 0,48 | 9 | 0,00 | ||||
| 2025-08-06 | 13F | AE Wealth Management LLC | 215 | 9 | ||||||
| 2025-08-04 | 13F | JDM Financial Group LLC | 273 | 0,00 | 12 | 0,00 | ||||
| 2025-08-06 | 13F | Pekin Hardy Strauss, Inc. | 57.788 | -0,08 | 2.437 | 3,66 | ||||
| 2025-08-14 | 13F | IHT Wealth Management, LLC | 14.559 | 1,17 | 614 | 4,97 | ||||
| 2025-08-05 | 13F | Bank of New York Mellon Corp | 307.225 | -3,58 | 12.956 | 0,02 | ||||
| 2025-08-14 | 13F | Oxford Financial Group Ltd | 4.002.592 | 0,18 | 168.789 | 3,92 | ||||
| 2025-08-08 | 13F | Cornerstone Advisors Asset Management, Inc | 15.031 | 0,00 | 634 | 3,60 | ||||
| 2025-04-15 | 13F | Reuter James Wealth Management, Llc | 0 | -100,00 | 0 |