Grundlæggende statistik
| Institutionelle ejere | 156 total, 156 long only, 0 short only, 0 long/short - change of 3,29% MRQ |
| Gennemsnitlig porteføljeallokering | 0.2156 % - change of -0,59% MRQ |
| Institutionelle aktier (lange) | 6.241.018 (ex 13D/G) - change of 0,66MM shares 11,91% MRQ |
| Institutionel værdi (lang) | $ 429.395 USD ($1000) |
Institutionelt ejerskab og aktionærer
iShares Trust - iShares Morningstar Mid-Cap Value ETF (US:IMCV) har 156 institutionelle ejere og aktionærer, der har indsendt 13D/G- eller 13F-formularer til Securities Exchange Commission (SEC). Disse institutioner har i alt 6,241,018 aktier. Største aktionærer omfatter Morgan Stanley, Raymond James Financial Inc, Equitable Holdings, Inc., Orgel Wealth Management, LLC, EQ ADVISORS TRUST - EQ/Mid Cap Value Managed Volatility Portfolio Class IB, Commonwealth Equity Services, Llc, Bank Of America Corp /de/, LPL Financial LLC, Advisor Group Holdings, Inc., and Wells Fargo & Company/mn .
iShares Trust - iShares Morningstar Mid-Cap Value ETF (NasdaqGM:IMCV) institutionel ejerskabsstruktur viser aktuelle positioner i virksomheden efter institutioner og fonde, samt seneste ændringer i positionsstørrelse. Større aktionærer kan omfatte individuelle investorer, investeringsforeninger, hedgefonde eller institutioner. Skema 13D angiver, at investoren besidder (eller besidder) mere end 5 % af virksomheden og har til hensigt (eller har til hensigt at) aktivt at forfølge en ændring i forretningsstrategi. Skema 13G indikerer en passiv investering på over 5%.
The share price as of September 10, 2025 is 79,39 / share. Previously, on September 10, 2024, the share price was 74,06 / share. This represents an increase of 7,20% over that period.

Fondens stemningsscore
Fund Sentiment Score (fka Ownership Accumulation Score) finder de aktier, der bliver mest købt af fonde. Det er resultatet af en sofistikeret, multi-faktor kvantitativ model, der identificerer virksomheder med de højeste niveauer af institutionel akkumulering. Scoringsmodellen bruger en kombination af den samlede stigning i oplyste ejere, ændringerne i porteføljeallokeringer i disse ejere og andre målinger. Tallet går fra 0 til 100, hvor højere tal indikerer et højere niveau af akkumulering for sine jævnaldrende, og 50 er gennemsnittet.
Opdateringsfrekvens: Dagligt
Se Ownership Explorer, som giver en liste over højest rangerende virksomheder.
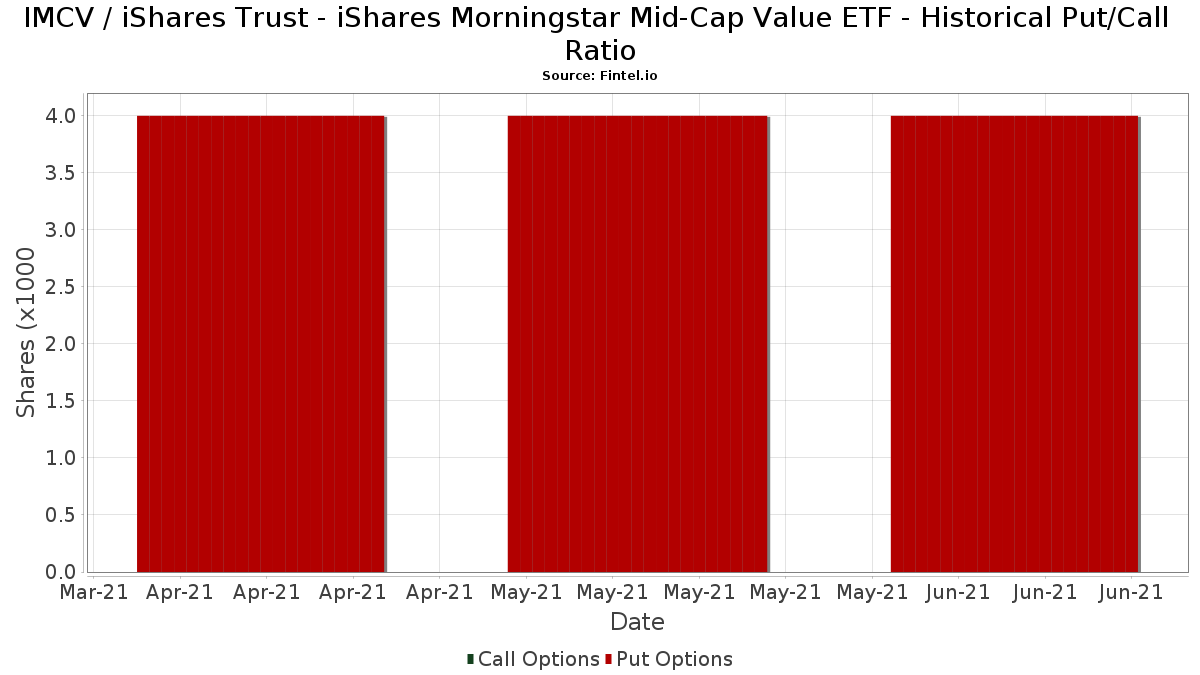
Institutionel Put/Call-forhold
Ud over at indberette standardaktie- og gældsudstedelser skal institutter med mere end 100 mill. aktiver under forvaltning også oplyse deres put- og call-optionsbeholdninger. Da salgsoptioner generelt indikerer negativ stemning, og købsoptioner indikerer positiv stemning, kan vi få en fornemmelse af den overordnede institutionelle stemning ved at plotte forholdet mellem put og kald. Diagrammet til højre viser det historiske put/call-forhold for dette instrument.
Brug af Put/Call Ratio som en indikator for investorernes stemning overvinder en af de vigtigste mangler ved at bruge totalt institutionelt ejerskab, som er, at en betydelig mængde af aktiver under forvaltning investeres passivt for at spore indekser. Passivt forvaltede fonde køber typisk ikke optioner, så indikatoren for put/call-forholdet følger mere nøje følelsen af aktivt forvaltede fonde.
13F og NPORT arkivering
Detaljer om 13F-arkivering er gratis. Detaljer om NP-ansøgninger kræver et premium-medlemskab. Grønne rækker angiver nye positioner. Røde rækker angiver lukkede positioner. Klik på linket ikon for at se den fulde transaktionshistorik.
Opgrader
for at låse premium-data op og eksportere til Excel ![]() .
.
| Fil dato | Kilde | Investor | Type | Gennemsnitlig pris (Øst) |
Aktier | Δ Aktier (%) |
Rapporteret Værdi ($1000) |
Δ Værdi (%) |
Port Alloc (%) |
|
|---|---|---|---|---|---|---|---|---|---|---|
| 2025-08-14 | 13F | Diversify Advisory Services, LLC | 16.776 | 10,05 | 1.308 | 19,67 | ||||
| 2025-08-04 | 13F | Creative Financial Designs Inc /adv | 154 | 0,65 | 12 | 0,00 | ||||
| 2025-05-05 | 13F | IFP Advisors, Inc | 0 | -100,00 | 0 | |||||
| 2025-07-11 | 13F | Pinnacle Bancorp, Inc. | 56 | 4 | ||||||
| 2025-08-11 | 13F | Citigroup Inc | 9.252 | 70,17 | 703 | 74,19 | ||||
| 2025-07-17 | 13F | Oakworth Capital, Inc. | 3.430 | 0,00 | 261 | 2,36 | ||||
| 2025-08-11 | 13F | Principal Securities, Inc. | 20.007 | 3.337,63 | 1.520 | 3.434,88 | ||||
| 2025-07-16 | 13F | New Insight Wealth Advisors | 3.392 | 0,00 | 258 | 2,39 | ||||
| 2025-08-12 | 13F | LPL Financial LLC | 218.922 | 28,72 | 16.634 | 31,82 | ||||
| 2025-08-14 | 13F | Operose Advisors LLC | 642 | 0,00 | 49 | 2,13 | ||||
| 2025-08-08 | 13F | Cetera Investment Advisers | 47.852 | 115,99 | 3.636 | 121,24 | ||||
| 2025-08-13 | 13F | Jones Financial Companies Lllp | 4.293 | 42,25 | 324 | 46,61 | ||||
| 2025-08-14 | 13F | UBS Group AG | 103.060 | 0,70 | 7.830 | 3,12 | ||||
| 2025-07-15 | 13F | Revisor Wealth Management LLC | 3.428 | -4,46 | 267 | 0,38 | ||||
| 2025-07-30 | 13F | Retirement Planning Group | 16.780 | -6,61 | 1.275 | -4,35 | ||||
| 2025-07-31 | 13F | Cambridge Investment Research Advisors, Inc. | 43.890 | 554,78 | 3 | |||||
| 2025-08-14 | 13F | Ancora Advisors, LLC | 66 | 0,00 | 5 | 25,00 | ||||
| 2025-07-30 | 13F | Black Diamond Financial, LLC | 110.769 | -12,17 | 8.416 | -10,05 | ||||
| 2025-07-22 | 13F | Marietta Wealth Management, LLC | 81.441 | 6,12 | 6.188 | 8,68 | ||||
| 2025-08-04 | 13F | Jim Saulnier & Associates, Llc | 26.375 | -5,88 | 2.004 | -3,61 | ||||
| 2025-08-14 | 13F | Stifel Financial Corp | 43.502 | 0,92 | 3.305 | 3,35 | ||||
| 2025-07-22 | 13F | Red Tortoise LLC | 2 | 0,00 | 0 | |||||
| 2025-07-08 | 13F | Parallel Advisors, LLC | 4.850 | 36,62 | 369 | 39,92 | ||||
| 2025-07-17 | 13F | Sound Income Strategies, LLC | 54 | 0,00 | 4 | 0,00 | ||||
| 2025-08-19 | 13F | Cape Investment Advisory, Inc. | 4.258 | 0,02 | 324 | 2,54 | ||||
| 2025-08-14 | 13F | First Manhattan Co | 7.438 | 0,00 | 565 | 2,54 | ||||
| 2025-08-11 | 13F | HighTower Advisors, LLC | 3.586 | 272 | ||||||
| 2025-08-01 | 13F | Gwn Securities Inc. | 4.092 | 11,77 | 312 | 14,76 | ||||
| 2025-07-21 | 13F | Ameritas Advisory Services, LLC | 768 | 58 | ||||||
| 2025-07-30 | 13F | D.a. Davidson & Co. | 3.197 | 243 | ||||||
| 2025-08-13 | 13F | Summit Financial, LLC | 3.028 | 0,50 | 230 | 3,14 | ||||
| 2025-08-13 | 13F | Level Four Advisory Services, Llc | 12.367 | 0,01 | 940 | 2,40 | ||||
| 2025-07-15 | 13F | James J. Burns & Company, LLC | 20.510 | 235,19 | 1.558 | 243,93 | ||||
| 2025-08-12 | 13F | Proequities, Inc. | 0 | 0 | ||||||
| 2025-08-14 | 13F | Guardian Wealth Advisors, Llc / Nc | 1.208 | -14,27 | 92 | -12,50 | ||||
| 2025-08-14 | 13F | Raymond James Financial Inc | 395.910 | 18,20 | 30.081 | 21,06 | ||||
| 2025-08-11 | 13F | Western Wealth Management, LLC | 2.801 | 0,04 | 213 | 2,42 | ||||
| 2025-08-13 | 13F | Jackson Creek Investment Advisors LLC | 9.460 | 1,21 | 1 | |||||
| 2025-08-14 | 13F | Colony Group, LLC | 24.892 | -19,50 | 1.891 | -17,57 | ||||
| 2025-07-25 | 13F | Courage Miller Partners, LLC | 20.296 | -1,36 | 1.542 | 1,05 | ||||
| 2025-08-14 | 13F | Vivaldi Capital Management, LLC | 26.647 | 18,00 | 2.025 | 20,84 | ||||
| 2025-08-08 | 13F | Pnc Financial Services Group, Inc. | 573 | -13,44 | 44 | -12,24 | ||||
| 2025-08-14 | 13F | Integrated Wealth Concepts LLC | 6.427 | 11,23 | 488 | 14,02 | ||||
| 2025-08-14 | 13F | Smartleaf Asset Management LLC | 2.317 | 18,82 | 175 | 23,24 | ||||
| 2025-08-14 | 13F | Clark Capital Management Group, Inc. | 90.046 | 6.842 | ||||||
| 2025-08-08 | 13F | Emerald Investment Partners, Llc | 36 | 3 | ||||||
| 2025-08-06 | 13F | Commonwealth Equity Services, Llc | 270.105 | 33,06 | 21 | 33,33 | ||||
| 2025-07-09 | 13F | Burt Wealth Advisors | 27.722 | 91,45 | 2.106 | 96,09 | ||||
| 2025-08-05 | 13F | Huntington National Bank | 0 | -100,00 | ||||||
| 2025-07-14 | 13F | Park Avenue Securities Llc | 13.272 | 1 | ||||||
| 2025-07-30 | 13F | Caliber Wealth Management, LLC / KS | 25.541 | -0,24 | 1.941 | 2,16 | ||||
| 2025-07-14 | 13F | Armstrong Advisory Group, Inc | 0 | -100,00 | 0 | |||||
| 2025-08-07 | 13F | Summit Asset Management, LLC | 4.216 | -5,81 | 320 | -3,61 | ||||
| 2025-08-08 | 13F | Islay Capital Management, Llc | 30 | 0,00 | 2 | 0,00 | ||||
| 2025-07-17 | 13F | Gleason Group, Inc. | 266 | 0,76 | 20 | 5,26 | ||||
| 2025-07-21 | 13F | Crews Bank & Trust | 305 | 0,00 | 23 | 4,55 | ||||
| 2025-08-05 | 13F | Bank Of Montreal /can/ | 3.221 | 0,66 | 245 | 2,95 | ||||
| 2025-08-14 | 13F | Royal Bank Of Canada | 92.623 | 146,97 | 7.038 | 152,89 | ||||
| 2025-08-12 | 13F | Global Retirement Partners, LLC | 2.286 | 4.133,33 | 174 | 4.225,00 | ||||
| 2025-08-12 | 13F | Archer Investment Corp | 103 | 24,10 | 8 | 16,67 | ||||
| 2025-08-13 | 13F | Russell Investments Group, Ltd. | 71 | 0,00 | 5 | 0,00 | ||||
| 2025-08-15 | 13F | Equitable Holdings, Inc. | 390.168 | -1,65 | 29.645 | 0,72 | ||||
| 2025-08-04 | 13F | Flagship Harbor Advisors, Llc | 7.021 | 4,51 | 533 | 7,03 | ||||
| 2025-07-29 | 13F | Private Trust Co Na | 832 | 16,69 | 63 | 21,15 | ||||
| 2025-04-29 | 13F | Hm Payson & Co | 500 | -27,01 | 37 | -26,00 | ||||
| 2025-08-15 | 13F | Morgan Stanley | 679.807 | -5,22 | 51.652 | -2,94 | ||||
| 2025-08-12 | 13F | Jpmorgan Chase & Co | 18.151 | 95,87 | 1.379 | 100,73 | ||||
| 2025-08-14 | 13F | Financial Advisory Service, Inc. | 0 | -100,00 | 0 | |||||
| 2025-07-30 | 13F | Pacific Sun Financial Corp | 8.130 | -6,23 | 618 | -4,04 | ||||
| 2025-07-10 | 13F | Orgel Wealth Management, LLC | 359.977 | 5,71 | 27.351 | 8,27 | ||||
| 2025-07-24 | 13F | Us Bancorp \de\ | 505 | 0,00 | 38 | 2,70 | ||||
| 2025-08-08 | 13F | Creative Planning | 6.442 | 0,61 | 489 | 2,95 | ||||
| 2025-08-11 | 13F | Hopwood Financial Services, Inc. | 960 | 0,00 | 73 | 1,41 | ||||
| 2025-07-08 | 13F | Zrc Wealth Management, Llc | 254 | 0,79 | 19 | 5,56 | ||||
| 2025-08-14 | 13F | Comerica Bank | 13.501 | 1,06 | 1.026 | 3,43 | ||||
| 2025-07-14 | 13F | LaFleur & Godfrey LLC | 8.456 | 0,67 | 642 | 3,05 | ||||
| 2025-08-14 | 13F | Bank Of America Corp /de/ | 219.604 | 6,63 | 16.686 | 9,20 | ||||
| 2025-08-05 | 13F | GHP Investment Advisors, Inc. | 83.380 | -0,11 | 6.335 | 2,31 | ||||
| 2025-07-10 | 13F | Wealth Enhancement Advisory Services, Llc | 16.662 | -6,89 | 1.296 | -2,34 | ||||
| 2025-07-14 | 13F | Matrix Trust Co | 201.752 | 1,63 | 15 | 7,14 | ||||
| 2025-07-22 | 13F | Sage Financial Group Inc | 6.780 | -5,98 | 515 | -3,56 | ||||
| 2025-07-23 | 13F | Prime Capital Investment Advisors, LLC | 5.304 | 0,00 | 403 | 2,29 | ||||
| 2025-08-11 | 13F | Cornerstone Planning Group LLC | 15 | 1 | ||||||
| 2025-08-14 | 13F | Jane Street Group, Llc | 0 | -100,00 | 0 | |||||
| 2025-07-29 | 13F | Rodgers & Associates, LTD | 100.912 | 7,15 | 7.667 | 9,73 | ||||
| 2025-08-06 | 13F | Savant Capital, LLC | 5.592 | 2,57 | 425 | 4,95 | ||||
| 2025-07-28 | 13F | Harbour Investments, Inc. | 15 | 0,00 | 1 | 0,00 | ||||
| 2025-08-01 | 13F | Trust Investment Advisors | 2.795 | 0,18 | 212 | 2,91 | ||||
| 2025-07-29 | 13F | Madison Wealth Partners, Inc | 8.616 | 9,15 | 655 | 11,79 | ||||
| 2025-08-14 | 13F | Mml Investors Services, Llc | 42.420 | 25,51 | 3 | 50,00 | ||||
| 2025-07-29 | 13F | Woodard & Co Asset Management Group Inc /adv | 5.652 | -28,11 | 429 | -26,42 | ||||
| 2025-08-14 | 13F | Mariner, LLC | 58.333 | 4,63 | 4.432 | 7,16 | ||||
| 2025-08-15 | 13F | Tower Research Capital LLC (TRC) | 0 | -100,00 | 0 | |||||
| 2025-07-09 | 13F | Dynamic Advisor Solutions LLC | 25.742 | 1.956 | ||||||
| 2025-07-15 | 13F | MCF Advisors LLC | 300 | 0,00 | 23 | 0,00 | ||||
| 2025-08-11 | 13F | Aptus Capital Advisors, LLC | 1.208 | -14,27 | 92 | -12,50 | ||||
| 2025-08-06 | 13F | First Horizon Advisors, Inc. | 217 | 16 | ||||||
| 2025-07-22 | 13F | Merit Financial Group, LLC | 27.450 | 12,34 | 2.086 | 15,07 | ||||
| 2025-08-26 | NP | EQ ADVISORS TRUST - EQ/Mid Cap Value Managed Volatility Portfolio Class IB | 353.811 | -2,05 | 26.883 | 0,31 | ||||
| 2025-07-17 | 13F | Janney Montgomery Scott LLC | 5.370 | 0,00 | 0 | |||||
| 2025-07-25 | 13F | Cwm, Llc | 3.837 | -25,78 | 0 | |||||
| 2025-08-05 | 13F | Plante Moran Financial Advisors, LLC | 3.453 | 0,00 | 262 | 2,34 | ||||
| 2025-08-14 | 13F | McIlrath & Eck, LLC | 540 | 0,00 | 41 | 2,50 | ||||
| 2025-08-14 | 13F | Silvercrest Asset Management Group Llc | 2.706 | 0,00 | 206 | 2,50 | ||||
| 2025-08-13 | 13F | Cresset Asset Management, LLC | 2.745 | 0,00 | 209 | 2,46 | ||||
| 2025-08-14 | 13F | Lebenthal Global Advisors, LLC | 55.748 | 0,66 | 4.236 | 3,09 | ||||
| 2025-08-07 | 13F | Kestra Private Wealth Services, Llc | 3.796 | -15,10 | 288 | -12,99 | ||||
| 2025-08-12 | 13F | Bedel Financial Consulting, Inc. | 75.666 | 1,15 | 5.749 | 6,76 | ||||
| 2025-08-14 | 13F | Citadel Advisors Llc | 0 | -100,00 | 0 | |||||
| 2025-07-30 | 13F | Bogart Wealth, LLC | 464 | 0,22 | 35 | 2,94 | ||||
| 2025-08-12 | 13F | Trivant Custom Portfolio Group, LLC | 5.687 | 13,72 | 432 | 16,44 | ||||
| 2025-07-10 | 13F | Sovran Advisors, LLC | 24.024 | 1.858 | ||||||
| 2025-08-06 | 13F | AE Wealth Management LLC | 0 | -100,00 | 0 | |||||
| 2025-08-05 | 13F | swisspartners Advisors Ltd | 111.620 | 3,25 | 8.471 | 19,43 | ||||
| 2025-08-12 | 13F | O'shaughnessy Asset Management, Llc | 439 | 0,00 | 33 | 3,13 | ||||
| 2025-08-13 | 13F | Northwestern Mutual Wealth Management Co | 50.321 | -1,68 | 3.823 | 0,68 | ||||
| 2025-07-14 | 13F | AdvisorNet Financial, Inc | 155 | 0,00 | 12 | 0,00 | ||||
| 2025-07-22 | 13F | Steele Capital Management, Inc. | 201.752 | 1,63 | 15.329 | 4,09 | ||||
| 2025-08-06 | 13F | DDFG, Inc | 31.915 | 6,26 | 2.425 | 8,80 | ||||
| 2025-08-08 | 13F | TD Capital Management LLC | 202 | 0,50 | 15 | 7,14 | ||||
| 2025-07-17 | 13F | Beacon Capital Management, LLC | 1.404 | 0,00 | 107 | 1,92 | ||||
| 2025-08-08 | 13F | Avantax Advisory Services, Inc. | 60.956 | 4,77 | 4.631 | 7,30 | ||||
| 2025-08-12 | 13F | Ameritas Investment Partners, Inc. | 115 | 0,00 | 9 | 0,00 | ||||
| 2025-08-15 | 13F | Kestra Advisory Services, LLC | 7.562 | 37,72 | 575 | 41,03 | ||||
| 2025-08-01 | 13F | Envestnet Asset Management Inc | 123.020 | 335,19 | 9.347 | 345,73 | ||||
| 2025-08-14 | 13F | GWM Advisors LLC | 945 | 0,53 | 72 | 2,90 | ||||
| 2025-08-14 | 13F | Wells Fargo & Company/mn | 212.788 | 27,26 | 16.168 | 30,33 | ||||
| 2025-08-01 | 13F | Transcend Wealth Collective, Llc | 2.803 | 0,00 | 213 | 2,42 | ||||
| 2025-08-07 | 13F | Cahill Financial Advisors Inc | 4.325 | 0,58 | 329 | 3,14 | ||||
| 2025-08-14 | 13F | Ameriprise Financial Inc | 66.651 | 1,94 | 5.068 | 4,32 | ||||
| 2025-08-12 | 13F | WealthTrak Capital Management LLC | 4.104 | 2,47 | 312 | 4,71 | ||||
| 2025-07-14 | 13F | Signature Securities Group Corporation | 23.119 | -15,61 | 1.757 | -13,58 | ||||
| 2025-08-05 | 13F | Tiaa Trust, National Association | 3.098 | 0,00 | 235 | 2,62 | ||||
| 2025-08-12 | 13F | Steward Partners Investment Advisory, Llc | 13 | 0,00 | 1 | |||||
| 2025-07-29 | 13F | Aire Advisors, Llc | 40.696 | 9,20 | 3.092 | 11,87 | ||||
| 2025-07-29 | 13F | Salomon & Ludwin, LLC | 162 | 0,00 | 13 | 0,00 | ||||
| 2025-07-25 | 13F | Atria Wealth Solutions, Inc. | 25.407 | -6,20 | 1.930 | -3,93 | ||||
| 2025-08-04 | 13F | Assetmark, Inc | 482 | 20,20 | 37 | 24,14 | ||||
| 2025-08-13 | 13F | Baird Financial Group, Inc. | 17.237 | 21,14 | 1.310 | 24,08 | ||||
| 2025-08-14 | 13F | Quantinno Capital Management LP | 0 | -100,00 | 0 | |||||
| 2025-07-21 | 13F | Ameriflex Group, Inc. | 417 | 0,00 | 31 | 3,33 | ||||
| 2025-08-15 | 13F | Captrust Financial Advisors | 12.311 | -10,60 | 935 | -8,42 | ||||
| 2025-08-18 | 13F | Geneos Wealth Management Inc. | 5.394 | 98,60 | 410 | 103,48 | ||||
| 2025-08-08 | 13F | Bouchey Financial Group Ltd | 2.808 | 0,00 | 213 | 2,40 | ||||
| 2025-08-14 | 13F | EP Wealth Advisors, Inc. | 43.166 | 0,00 | 3.280 | 2,40 | ||||
| 2025-08-12 | 13F | J.w. Cole Advisors, Inc. | 5.656 | 430 | ||||||
| 2025-08-14 | 13F | Susquehanna International Group, Llp | 7.643 | -78,00 | 581 | -77,49 | ||||
| 2025-08-08 | 13F | Altfest L J & Co Inc | 3.601 | -50,87 | 274 | -49,72 | ||||
| 2025-07-08 | 13F | Nbc Securities, Inc. | 300 | 0,00 | 0 | |||||
| 2025-08-01 | 13F | PCA Investment Advisory Services Inc. | 13.988 | 0,16 | 1.063 | 2,51 | ||||
| 2025-08-18 | 13F | N.E.W. Advisory Services LLC | 0 | -100,00 | 0 | |||||
| 2025-08-13 | 13F | M&t Bank Corp | 13.727 | -3,74 | 1.043 | -1,42 | ||||
| 2025-08-13 | 13F | Willis Johnson & Associates, Inc. | 4.529 | 0,00 | 344 | 2,38 | ||||
| 2025-08-15 | 13F | CI Private Wealth, LLC | 18.300 | -3,93 | 1.390 | -1,63 | ||||
| 2025-07-29 | NP | EBI - Longview Advantage ETF | 0 | -100,00 | 0 | -100,00 | ||||
| 2025-09-04 | 13F/A | Advisor Group Holdings, Inc. | 218.051 | 4,97 | 16.567 | 7,49 | ||||
| 2025-08-13 | 13F | Millstone Evans Group, LLC | 38.783 | -3,07 | 2.947 | -0,74 | ||||
| 2025-07-22 | 13F | DAVENPORT & Co LLC | 52.522 | 78,58 | 3.991 | 82,94 | ||||
| 2025-08-11 | 13F | Private Advisor Group, LLC | 4.984 | 379 | ||||||
| 2025-08-06 | 13F | Ipsen Advisor Group LLC | 82.303 | 2,75 | 6.253 | 5,23 | ||||
| 2025-07-30 | 13F | Atlantic Edge Private Wealth Management, LLC | 0 | -100,00 | 0 | |||||
| 2025-08-04 | 13F | Clear Investment Research, Llc | 2.012 | 0,20 | 153 | 2,01 | ||||
| 2025-08-12 | 13F | BlackRock, Inc. | 1.500 | 0,00 | 114 | 1,80 | ||||
| 2025-07-25 | 13F | LRI Investments, LLC | 22.656 | 0,00 | 1.721 | 2,44 | ||||
| 2025-07-09 | 13F | Beacon Financial Group | 2.836 | 0,18 | 215 | 2,38 | ||||
| 2025-07-24 | 13F | rebel Financial LLC | 4.342 | 330 | ||||||
| 2025-08-14 | 13F | Fmr Llc | 3.405 | -15,26 | 259 | -13,42 | ||||
| 2025-07-29 | 13F | Gladwyn Financial Advisors, Inc. | 72 | 5 | ||||||
| 2025-08-07 | 13F | Parkside Financial Bank & Trust | 510 | 0,00 | 39 | 2,70 |