Grundlæggende statistik
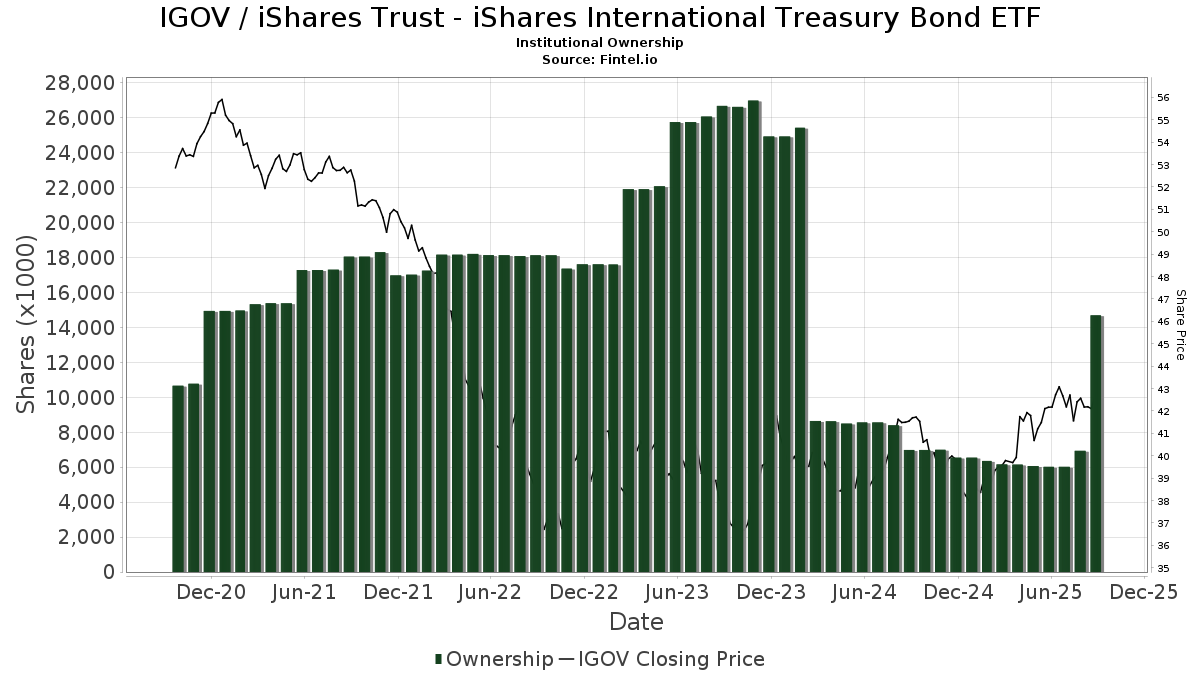
| Institutionelle ejere | 142 total, 142 long only, 0 short only, 0 long/short - change of -1,38% MRQ |
| Gennemsnitlig porteføljeallokering | 0.3271 % - change of -5,72% MRQ |
| Institutionelle aktier (lange) | 8.783.263 (ex 13D/G) - change of -0,19MM shares -2,09% MRQ |
| Institutionel værdi (lang) | $ 360.064 USD ($1000) |
Institutionelt ejerskab og aktionærer
iShares Trust - iShares International Treasury Bond ETF (US:IGOV) har 142 institutionelle ejere og aktionærer, der har indsendt 13D/G- eller 13F-formularer til Securities Exchange Commission (SEC). Disse institutioner har i alt 8,783,263 aktier. Største aktionærer omfatter Creative Planning, Checchi Capital Advisers, LLC, Wells Fargo & Company/mn, Evoke Wealth, Llc, Kovitz Investment Group Partners, LLC, Raymond James Financial Inc, Mackenzie Financial Corp, Leuthold Group, Llc, LPL Financial LLC, and Aspect Partners, LLC .
iShares Trust - iShares International Treasury Bond ETF (NasdaqGM:IGOV) institutionel ejerskabsstruktur viser aktuelle positioner i virksomheden efter institutioner og fonde, samt seneste ændringer i positionsstørrelse. Større aktionærer kan omfatte individuelle investorer, investeringsforeninger, hedgefonde eller institutioner. Skema 13D angiver, at investoren besidder (eller besidder) mere end 5 % af virksomheden og har til hensigt (eller har til hensigt at) aktivt at forfølge en ændring i forretningsstrategi. Skema 13G indikerer en passiv investering på over 5%.
The share price as of February 27, 2026 is 42,99 / share. Previously, on March 3, 2025, the share price was 39,09 / share. This represents an increase of 9,98% over that period.
Fondens stemningsscore
Fund Sentiment Score (fka Ownership Accumulation Score) finder de aktier, der bliver mest købt af fonde. Det er resultatet af en sofistikeret, multi-faktor kvantitativ model, der identificerer virksomheder med de højeste niveauer af institutionel akkumulering. Scoringsmodellen bruger en kombination af den samlede stigning i oplyste ejere, ændringerne i porteføljeallokeringer i disse ejere og andre målinger. Tallet går fra 0 til 100, hvor højere tal indikerer et højere niveau af akkumulering for sine jævnaldrende, og 50 er gennemsnittet.
Opdateringsfrekvens: Dagligt
Se Ownership Explorer, som giver en liste over højest rangerende virksomheder.
AI+ Ask Fintel’s AI assistant about iShares Trust - iShares International Treasury Bond ETF.
Select a question to share a public post with an AI-crafted answer.
Thinking of good questions…
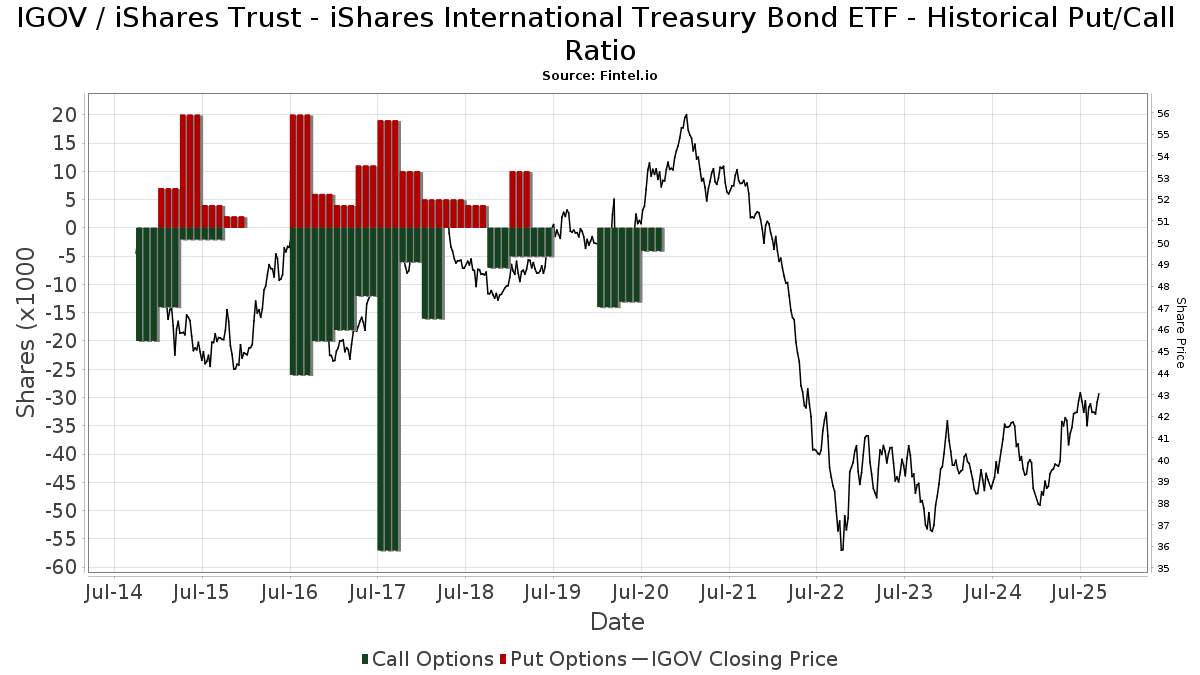
Institutionel Put/Call-forhold
Ud over at indberette standardaktie- og gældsudstedelser skal institutter med mere end 100 mill. aktiver under forvaltning også oplyse deres put- og call-optionsbeholdninger. Da salgsoptioner generelt indikerer negativ stemning, og købsoptioner indikerer positiv stemning, kan vi få en fornemmelse af den overordnede institutionelle stemning ved at plotte forholdet mellem put og kald. Diagrammet til højre viser det historiske put/call-forhold for dette instrument.
Brug af Put/Call Ratio som en indikator for investorernes stemning overvinder en af de vigtigste mangler ved at bruge totalt institutionelt ejerskab, som er, at en betydelig mængde af aktiver under forvaltning investeres passivt for at spore indekser. Passivt forvaltede fonde køber typisk ikke optioner, så indikatoren for put/call-forholdet følger mere nøje følelsen af aktivt forvaltede fonde.
13D/G-arkivering
Vi præsenterer 13D/G ansøgninger separat fra 13F ansøgninger på grund af den forskellige behandling af SEC. 13D/G-ansøgninger kan indgives af grupper af investorer (med én ledende), hvorimod 13F-ansøgninger ikke kan. Dette resulterer i situationer, hvor en investor kan indsende en 13D/G, der rapporterer én værdi for de samlede aktier (der repræsenterer alle de aktier, der ejes af investorgruppen), men derefter indsender en 13F, der rapporterer en anden værdi for de samlede aktier (der udelukkende repræsenterer deres egne) ejendomsret). Det betyder, at aktieejerskab af 13D/G-arkiver og 13F-arkiveringer ofte ikke er direkte sammenlignelige, så vi præsenterer dem separat.
Bemærk: Fra den 16. maj 2021 viser vi ikke længere ejere, der ikke har indsendt en 13D/G inden for det seneste år. Tidligere viste vi den fulde historie af 13D/G-arkiver. Generelt skal enheder, der er forpligtet til at indgive 13D/G-ansøgninger, indgive mindst årligt, før de indsender en afsluttende ansøgning. Dog forlader fonde nogle gange positioner uden at indsende en afsluttende ansøgning (dvs. de afvikler), så visning af den fulde historie resulterede nogle gange i forvirring om det nuværende ejerskab. For at undgå forvirring viser vi nu kun 'aktuelle' ejere - det vil sige - ejere, der har anmeldt inden for det seneste år.
Upgrade to unlock premium data.
| Fil dato | Form | Investor | Forrige Aktier |
Seneste Aktier |
Δ Aktier (Procent) |
Ejendomsret (Procent) |
Δ Ejerskab (Procent) |
|
|---|---|---|---|---|---|---|---|---|
| 2025-07-15 | BlackRock Portfolio Management LLC | 613,065 | 644,448 | 5.12 | 2.30 | -59.65 |
13F og NPORT arkivering
Detaljer om 13F-arkivering er gratis. Detaljer om NP-ansøgninger kræver et premium-medlemskab. Grønne rækker angiver nye positioner. Røde rækker angiver lukkede positioner. Klik på linket ikon for at se den fulde transaktionshistorik.
Opgrader
for at låse premium-data op og eksportere til Excel ![]() .
.
| Fil dato | Kilde | Investor | Type | Gennemsnitlig pris (Øst) |
Aktier | Δ Aktier (%) |
Rapporteret Værdi ($1000) |
Δ Værdi (%) |
Port Alloc (%) |
|
|---|---|---|---|---|---|---|---|---|---|---|
| 2026-02-20 | 13F | Kovitz Investment Group Partners, LLC | 268.837 | -38,42 | 11.200 | -39,78 | ||||
| 2026-01-29 | 13F | Inscription Capital, LLC | 179.518 | -14,99 | 7.479 | -16,86 | ||||
| 2026-01-27 | 13F | TD Waterhouse Canada Inc. | 30.206 | 45,37 | 1.257 | 41,71 | ||||
| 2026-01-29 | 13F | Comerica Bank | 7.630 | 0,30 | 318 | -2,16 | ||||
| 2026-02-13 | 13F | Morgan Stanley | 111.409 | -59,31 | 4.641 | -60,21 | ||||
| 2026-02-13 | 13F | Smartleaf Asset Management LLC | 4.862 | 2.023,14 | 203 | 2.155,56 | ||||
| 2026-01-27 | 13F | PFG Advisors | 32.579 | 75,87 | 1.357 | 71,99 | ||||
| 2026-01-28 | 13F | Israel Discount Bank of New York | 40.456 | 234,46 | 1.685 | 227,18 | ||||
| 2026-02-13 | 13F | Mml Investors Services, Llc | 13.661 | 147,17 | 569 | 142,13 | ||||
| 2026-02-13 | 13F | Aptus Capital Advisors, LLC | 239 | 10 | ||||||
| 2026-02-14 | 13F | Rockefeller Capital Management L.P. | 846 | 1,32 | 35 | 0,00 | ||||
| 2026-02-10 | 13F | Godfrey Financial Associates, Inc. | 560 | 23 | ||||||
| 2026-02-12 | 13F | Renaissance Technologies Llc | 0 | -100,00 | 0 | |||||
| 2026-02-17 | 13F | Quadrature Capital Ltd | 52.829 | 2.201 | ||||||
| 2026-02-06 | 13F | Global Retirement Partners, LLC | 10 | -65,52 | 0 | -100,00 | ||||
| 2026-01-26 | 13F | BCS Wealth Management | 5.300 | 221 | ||||||
| 2026-01-22 | 13F | FSC Wealth Advisors, LLC | 0 | -100,00 | 0 | |||||
| 2026-02-11 | 13F | Mascagni Wealth Management, Inc. | 9.033 | -10,62 | 376 | -12,56 | ||||
| 2026-01-02 | 13F | Insight Wealth Strategies, LLC | 0 | -100,00 | 0 | |||||
| 2026-02-13 | 13F | MAI Capital Management | 210 | -13,58 | 9 | -20,00 | ||||
| 2026-01-20 | 13F | SOA Wealth Advisors, LLC. | 7 | 0,00 | 0 | |||||
| 2025-10-10 | 13F | Signal Advisors Wealth, LLC | 0 | -100,00 | 0 | |||||
| 2026-01-15 | 13F | Columbus Macro, LLC | 66.705 | 37,97 | 2.779 | 34,92 | ||||
| 2025-11-12 | 13F | Legacy Capital Group California, Inc. | 0 | -100,00 | 0 | |||||
| 2025-10-30 | 13F | Twin Peaks Wealth Advisors, LLC | 0 | -100,00 | 0 | -100,00 | ||||
| 2026-02-17 | 13F | Creative Planning | 1.431.301 | 10,44 | 59.628 | 8,01 | ||||
| 2026-01-26 | 13F | Cwm, Llc | 5.119 | -2,72 | 0 | |||||
| 2026-02-12 | 13F | Hm Payson & Co | 1.200 | 0,00 | 50 | -3,92 | ||||
| 2026-02-17 | 13F | Bank Of America Corp /de/ | 183.077 | -31,13 | 7.627 | -32,66 | ||||
| 2026-01-15 | 13F | One + One Wealth Management, Llc | 27.484 | -15,08 | 1.145 | -16,98 | ||||
| 2025-10-24 | 13F | Vicus Capital | 0 | -100,00 | 0 | |||||
| 2026-02-11 | 13F | Franklin Resources Inc | 1.065 | 44 | ||||||
| 2026-02-11 | 13F | Allianz Asset Management GmbH | 104.319 | 135,97 | 4.346 | 130,75 | ||||
| 2026-02-04 | 13F | Ground Swell Capital, LLC | 5.334 | 222 | ||||||
| 2026-02-03 | 13F | International Assets Investment Management, Llc | 36 | 2 | ||||||
| 2026-02-17 | 13F | Minichmacgregor Wealth Management, Llc | 6.643 | -11,18 | 278 | -12,89 | ||||
| 2025-10-15 | 13F | Client First Investment Management LLC | 0 | -100,00 | 0 | |||||
| 2025-10-28 | 13F | First National Corp /ma/ /adv | 5.138 | 0,00 | 219 | -0,90 | ||||
| 2025-10-28 | 13F | BRYN MAWR TRUST Co | 532 | -99,73 | 23 | -99,74 | ||||
| 2026-02-10 | 13F | Hazlett, Burt & Watson, Inc. | 861 | 1,29 | 0 | |||||
| 2026-02-17 | 13F | Rothschild Capital Partners, LLC | 15.542 | 45,55 | 647 | 42,51 | ||||
| 2025-11-14 | 13F | Vance Wealth, Inc. | 0 | -100,00 | 0 | |||||
| 2026-01-29 | 13F | Dunhill Financial, LLC | 15 | -74,58 | ||||||
| 2026-02-09 | 13F | Fisher Asset Management, LLC | 112.825 | -18,85 | 4.700 | -20,63 | ||||
| 2026-02-18 | 13F | Mackenzie Financial Corp | 250.449 | 0,00 | 10.441 | -2,15 | ||||
| 2026-02-06 | 13F | Larson Financial Group LLC | 0 | -100,00 | 0 | |||||
| 2026-01-21 | 13F | Flagship Harbor Advisors, Llc | 503 | 21 | ||||||
| 2026-02-12 | 13F | Bank Of Montreal /can/ | 20.547 | 4.093,27 | 856 | 4.175,00 | ||||
| 2026-02-13 | 13F | Wells Fargo & Company/mn | 484.229 | 14,51 | 20.173 | 11,98 | ||||
| 2026-01-27 | 13F | Brighton Jones Llc | 0 | -100,00 | 0 | |||||
| 2025-10-16 | 13F | Townsend Asset Management Corp /nc/ /adv | 0 | -100,00 | 0 | |||||
| 2026-02-02 | 13F | Heritage Financial Services, LLC | 13.546 | 0,00 | 564 | -2,25 | ||||
| 2026-02-06 | 13F | IFP Advisors, Inc | 15.839 | 4,69 | 660 | 2,33 | ||||
| 2026-02-13 | 13F | Manufacturers Life Insurance Company, The | 0 | -100,00 | 0 | |||||
| 2026-01-23 | 13F | Assetmark, Inc | 2.257 | 0,00 | 94 | -2,08 | ||||
| 2026-02-03 | 13F | SBI Securities Co., Ltd. | 3.247 | -9,60 | 135 | -11,76 | ||||
| 2026-02-11 | 13F | Cerity Partners LLC | 78.065 | 54,71 | 3.252 | 51,33 | ||||
| 2026-02-12 | 13F | Wealthspire Advisors, LLC | 0 | -100,00 | 0 | |||||
| 2026-02-06 | 13F | Empirical Asset Management, LLC | 57.040 | -10,85 | 2.376 | -12,81 | ||||
| 2026-01-23 | 13F | Optima Capital Llc | 78 | 3 | ||||||
| 2026-02-10 | 13F | Old Peak Finance LLC | 14.086 | 587 | ||||||
| 2026-02-12 | 13F | Steward Partners Investment Advisory, Llc | 196 | 0,00 | 8 | 0,00 | ||||
| 2025-10-20 | 13F | Allspring Global Investments Holdings, LLC | 0 | -100,00 | 0 | |||||
| 2026-02-06 | 13F | HighTower Advisors, LLC | 0 | -100,00 | 0 | |||||
| 2026-02-17 | 13F | Raymond James Financial Inc | 251.226 | -0,66 | 10.466 | -2,85 | ||||
| 2026-02-04 | 13F | Pensionmark Financial Group, Llc | 77.637 | 10,49 | 3.234 | 8,05 | ||||
| 2026-02-06 | 13F | EverSource Wealth Advisors, LLC | 0 | -100,00 | 0 | |||||
| 2026-02-11 | 13F | LPL Financial LLC | 237.641 | 122,27 | 9.900 | 117,39 | ||||
| 2026-01-14 | 13F | Net Worth Advisory Group | 26.722 | 244,27 | 1.113 | 237,27 | ||||
| 2026-02-18 | 13F | Beacon Pointe Advisors, LLC | 147.020 | 804,29 | 6.125 | 784,97 | ||||
| 2026-01-07 | 13F | Sovereign Financial Group, Inc. | 15.513 | 0,01 | 646 | -2,12 | ||||
| 2026-01-28 | 13F | HB Wealth Management, LLC | 5.373 | 0,00 | 224 | -2,19 | ||||
| 2026-02-05 | 13F | Cambridge Investment Research Advisors, Inc. | 5.057 | -55,07 | 0 | |||||
| 2026-02-17 | 13F | DZ BANK AG Deutsche Zentral Genossenschafts Bank, Frankfurt am Main | 0 | -100,00 | 0 | |||||
| 2026-01-21 | 13F | Sound Income Strategies, LLC | 174 | 7 | ||||||
| 2026-02-17 | 13F | Advisory Services Network, LLC | 18.842 | 15,22 | 785 | 12,64 | ||||
| 2026-02-13 | 13F | Ieq Capital, Llc | 13.194 | 0,00 | 550 | -2,31 | ||||
| 2026-02-06 | 13F | Brown Wealth Management, Llc | 0 | -100,00 | 0 | |||||
| 2026-02-03 | 13F | RFG Advisory, LLC | 77.953 | 13,85 | 3.248 | 11,35 | ||||
| 2026-02-13 | 13F | Mariner, LLC | 14.556 | -17,66 | 606 | -19,52 | ||||
| 2026-02-04 | 13F | Pure Financial Advisors, Inc. | 5.638 | 0,04 | 235 | -2,50 | ||||
| 2026-01-08 | 13F | Wealth Enhancement Advisory Services, Llc | 20.057 | -32,09 | 836 | -32,91 | ||||
| 2026-02-17 | 13F | Two Sigma Securities, Llc | 4.832 | 201 | ||||||
| 2026-01-21 | 13F/A | Euro Pacific Asset Management, LLC | 48.868 | 9,56 | 2 | 100,00 | ||||
| 2026-01-22 | 13F | Fiduciary Alliance LLC | 6.027 | 0,00 | 251 | -1,95 | ||||
| 2026-02-11 | 13F | Parallel Advisors, LLC | 518 | 463,04 | 22 | 600,00 | ||||
| 2026-02-12 | 13F | Betterment LLC | 60.265 | 24,50 | 3 | 0,00 | ||||
| 2026-02-02 | 13F | Vista Capital Partners, Inc. | 12.370 | -2,07 | 515 | -4,28 | ||||
| 2026-01-12 | 13F | Skyline Advisors, Inc. | 0 | -100,00 | 0 | |||||
| 2026-02-12 | 13F | BlackRock, Inc. | 132.640 | 4,68 | 5.526 | 2,37 | ||||
| 2026-02-17 | 13F | Royal Bank Of Canada | 168.179 | 0,10 | 7.006 | -2,12 | ||||
| 2026-02-05 | 13F | Leuthold Group, Llc | 248.737 | -1,31 | 10.362 | -3,49 | ||||
| 2026-01-16 | 13F | Ronald Blue Trust, Inc. | 0 | -100,00 | 0 | |||||
| 2026-01-07 | 13F | VERITY Wealth Advisors | 9.601 | 0,00 | 400 | -2,44 | ||||
| 2026-02-13 | 13F | North Ridge Wealth Advisors, Inc. | 0 | -100,00 | 0 | |||||
| 2025-11-25 | 13F | Briaud Financial Planning, Inc | 0 | -100,00 | 0 | |||||
| 2026-02-06 | 13F | Pnc Financial Services Group, Inc. | 36.565 | -0,07 | 1.523 | -2,25 | ||||
| 2025-12-16 | 13F | Garde Capital, Inc. | 0 | -100,00 | 0 | |||||
| 2026-02-17 | 13F | Warren Averett Asset Management, LLC | 186 | 8 | ||||||
| 2026-02-05 | 13F | Td Private Client Wealth Llc | 8.329 | -67,34 | 347 | -68,14 | ||||
| 2026-01-29 | 13F | UBS Group AG | 145.306 | -16,68 | 6.053 | -18,52 | ||||
| 2026-02-13 | 13F | Avos Capital Management, LLC | 182.842 | 3,03 | 7.617 | 0,75 | ||||
| 2026-01-16 | 13F | Bangor Savings Bank | 150 | 0,00 | 6 | 0,00 | ||||
| 2026-01-26 | 13F | AE Wealth Management LLC | 97.607 | 22,02 | 4.066 | 19,34 | ||||
| 2026-01-23 | 13F | Aspect Partners, LLC | 191.150 | 7.963 | ||||||
| 2026-01-28 | 13F | Barrett & Company, Inc. | 140 | 0,00 | 6 | 0,00 | ||||
| 2026-02-13 | 13F | Citigroup Inc | 37.243 | 7,41 | 1.552 | 5,01 | ||||
| 2026-02-17 | 13F | Lazard Asset Management Llc | 13.728 | 572 | ||||||
| 2025-11-14 | 13F | Susquehanna International Group, Llp | 0 | -100,00 | 0 | |||||
| 2026-02-10 | 13F/A | Northwestern Mutual Wealth Management Co | 13.358 | 556 | ||||||
| 2026-02-12 | 13F | Adviser Investments LLC | 8.358 | -12,47 | 348 | -14,29 | ||||
| 2026-02-17 | 13F | Jones Financial Companies Lllp | 121.092 | 22,99 | 5.045 | 21,02 | ||||
| 2026-01-13 | 13F | CoreCap Advisors, LLC | 8 | -55,56 | 0 | |||||
| 2026-02-17 | 13F | Ameriprise Financial Inc | 6.613 | -67,94 | 276 | -68,68 | ||||
| 2026-02-20 | 13F | Sunbelt Securities, Inc. | 40 | 0,00 | 2 | 0,00 | ||||
| 2026-01-16 | 13F | Red Lighthouse Investment Management, Llc | 5.937 | 0,00 | 247 | -1,98 | ||||
| 2025-11-13 | 13F | Quartz Partners, LLC | 0 | -100,00 | 0 | |||||
| 2026-02-09 | 13F | Clear Investment Research, Llc | 0 | -100,00 | 0 | -100,00 | ||||
| 2026-01-22 | 13F | Upper Left Wealth Management, LLC | 16.512 | 16,92 | 688 | 14,31 | ||||
| 2026-02-18 | 13F | Caitlin John, LLC | 249 | 0,00 | 10 | 0,00 | ||||
| 2026-02-06 | 13F | Evoke Wealth, Llc | 329.024 | 28,67 | 13.707 | 25,83 | ||||
| 2026-01-23 | 13F | Farther Finance Advisors, LLC | 16.010 | 14,82 | 667 | 12,31 | ||||
| 2026-02-10 | 13F/A | MJT & Associates Financial Advisory Group, Inc. | 25 | 0,00 | 1 | 0,00 | ||||
| 2026-01-16 | 13F | Compagnie Lombard Odier SCmA | 10.473 | 436 | ||||||
| 2026-02-12 | 13F | Commonwealth Equity Services, Llc | 30.427 | 1,97 | 1.268 | 126.600,00 | ||||
| 2026-02-17 | 13F | Cetera Investment Advisers | 43.388 | 37,23 | 1.808 | 34,25 | ||||
| 2026-01-23 | 13F | Nbt Bank N A /ny | 42 | -99,43 | 0 | -100,00 | ||||
| 2026-01-27 | 13F | Evergreen Capital Management Llc | 10.035 | 0,00 | 418 | -2,11 | ||||
| 2026-02-13 | 13F | Quattro Advisors LLC | 2.991 | 125 | ||||||
| 2026-02-03 | 13F | Crossmark Global Holdings, Inc. | 22.275 | 0,00 | 928 | -2,22 | ||||
| 2026-01-21 | 13F | DMG Group, LLC | 77.210 | 69,52 | 3.217 | 65,77 | ||||
| 2026-02-13 | 13F | Neuberger Berman Group LLC | 54.478 | 14,84 | 2.270 | 12,33 | ||||
| 2026-02-10 | 13F | Envestnet Asset Management Inc | 152.811 | 41,22 | 6.366 | 38,12 | ||||
| 2026-02-17 | 13F | Advisor Group Holdings, Inc. | 24.582 | -18,49 | 1.024 | -20,06 | ||||
| 2026-02-02 | 13F | Chapman Financial Group, Llc | 18.134 | -6,20 | 755 | -8,26 | ||||
| 2026-02-17 | 13F | Old Mission Capital Llc | 0 | -100,00 | 0 | |||||
| 2026-02-13 | 13F | Change Path, LLC | 16.960 | -2,56 | 707 | -4,72 | ||||
| 2026-01-27 | 13F | Checchi Capital Advisers, LLC | 617.443 | 7,18 | 25.723 | 4,82 | ||||
| 2026-02-19 | 13F | Invesco Ltd. | 15.733 | -6,73 | 655 | -8,77 | ||||
| 2026-02-17 | 13F | Fmr Llc | 241 | 63,95 | 10 | 66,67 | ||||
| 2026-02-11 | 13F | Jpmorgan Chase & Co | 187.946 | -5,62 | 7.830 | -7,71 | ||||
| 2026-02-17 | 13F | Obsido Oy | 10.145 | -20,67 | 423 | -22,43 | ||||
| 2025-09-26 | 13F | Capital A Wealth Management, LLC | 1.119 | 46 | ||||||
| 2026-02-02 | 13F | Oppenheimer & Co Inc | 9.328 | 0,00 | 389 | -2,27 | ||||
| 2026-02-12 | 13F | Haven Private, LLC | 28.745 | 11,70 | 1.198 | 9,22 | ||||
| 2026-02-05 | 13F | Bank Julius Baer & Co. Ltd, Zurich | 18.415 | -6,63 | 767 | -8,69 | ||||
| 2025-11-13 | 13F | GeoWealth Management, LLC | 0 | -100,00 | 0 | |||||
| 2026-01-26 | 13F | Patriot Financial Group Insurance Agency, LLC | 153.303 | 6,79 | 6.387 | 4,43 | ||||
| 2026-02-10 | 13F | Natixis Advisors, L.p. | 12.796 | 6,84 | 1 | |||||
| 2026-01-28 | 13F | Old National Bancorp /in/ | 71.506 | 0,56 | 2.979 | -1,68 | ||||
| 2026-02-12 | 13F | Rossby Financial, LCC | 584 | 0,00 | 24 | 0,00 | ||||
| 2026-02-06 | 13F | Tortoise Investment Management, LLC | 0 | -100,00 | 0 | |||||
| 2026-02-09 | 13F | Topel & Distasi Wealth Management, LLC | 80.188 | 2,84 | 3.341 | 0,57 | ||||
| 2026-02-06 | 13F | Fortis Group Advisors, LLC | 0 | -100,00 | 0 | |||||
| 2026-02-02 | 13F | Truist Financial Corp | 46.459 | 1.935 | ||||||
| 2026-02-17 | 13F | Fairview Capital Investment Management, Llc | 54.185 | 0,37 | 2.257 | -1,83 | ||||
| 2025-09-18 | NP | ABXB - TrimTabs Donoghue Forlines Tactical High Yield ETF | 11.478 | 476 | ||||||
| 2026-02-10 | 13F | Goldman Sachs Group Inc | 33.517 | -51,24 | 1.396 | -52,32 | ||||
| 2026-02-17 | 13F | Citadel Advisors Llc | 16.167 | -80,88 | 674 | -81,32 | ||||
| 2026-02-17 | 13F | Summit Trail Advisors, Llc | 70.969 | -1,78 | 2.957 | -3,93 | ||||
| 2026-02-17 | 13F | NorthRock Partners, LLC | 11.154 | 465 | ||||||
| 2026-02-12 | 13F | Financial Engines Advisors L.L.C. | 123.713 | 1,21 | 5.154 | -1,04 | ||||
| 2026-01-28 | 13F | Geneos Wealth Management Inc. | 88 | 4 | ||||||
| 2026-02-13 | 13F | Colony Group, LLC | 28.315 | 12,60 | 1.180 | 10,08 | ||||
| 2026-02-17 | 13F | Northern Trust Corp | 9.684 | 403 | ||||||
| 2026-02-11 | 13F | Argonautica Private Wealth Management, Inc | 7.245 | -63,58 | 302 | -64,46 | ||||
| 2026-02-12 | 13F | CIBC Private Wealth Group, LLC | 839 | 0,00 | 35 | -2,86 | ||||
| 2026-02-11 | 13F | ARGI Investment Services, LLC | 73.077 | 3.044 | ||||||
| 2026-02-12 | 13F | Jane Street Group, Llc | 113.424 | 4.725 | ||||||
| 2026-02-12 | 13F | IFC & Insurance Marketing, Inc. | 420 | 0 | ||||||
| 2026-02-09 | 13F | Harbour Investments, Inc. | 238 | 0,00 | 10 | -10,00 | ||||
| 2026-02-10 | 13F | Bnp Paribas Arbitrage, Sa | 0 | -100,00 | 0 | |||||
| 2025-11-05 | 13F | Boyd Watterson Asset Management Llc/oh | 0 | -100,00 | 0 | |||||
| 2026-02-06 | 13F | Covestor Ltd | 5.647 | 586,15 | 0 | |||||
| 2026-02-13 | 13F | Kestra Advisory Services, LLC | 779 | 32 | ||||||
| 2025-11-14 | 13F | Destination Wealth Management | 0 | -100,00 | 0 |