Grundlæggende statistik
| Institutionelle ejere | 154 total, 152 long only, 0 short only, 2 long/short - change of -1,28% MRQ |
| Gennemsnitlig porteføljeallokering | 0.0714 % - change of -40,03% MRQ |
| Institutionelle aktier (lange) | 2.058.395 (ex 13D/G) - change of -0,35MM shares -14,43% MRQ |
| Institutionel værdi (lang) | $ 165.895 USD ($1000) |
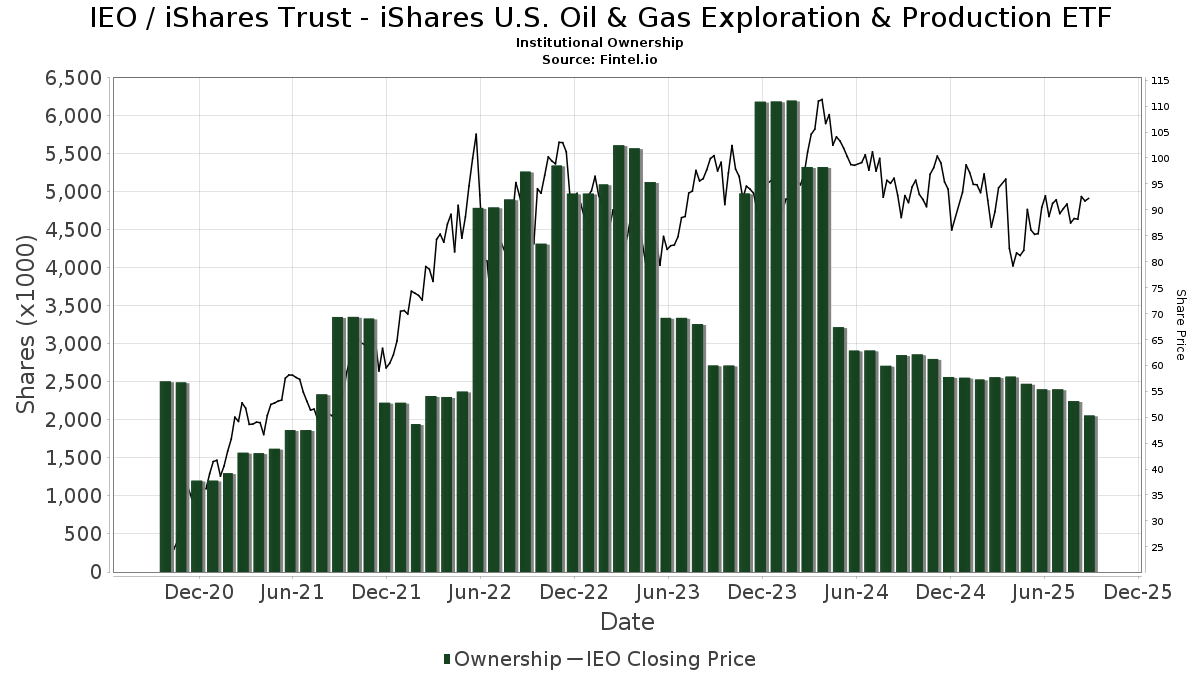
Institutionelt ejerskab og aktionærer
iShares Trust - iShares U.S. Oil & Gas Exploration & Production ETF (US:IEO) har 154 institutionelle ejere og aktionærer, der har indsendt 13D/G- eller 13F-formularer til Securities Exchange Commission (SEC). Disse institutioner har i alt 2,058,395 aktier. Største aktionærer omfatter Morgan Stanley, Bank Of America Corp /de/, LPL Financial LLC, Wells Fargo & Company/mn, EP Wealth Advisors, Inc., Envestnet Asset Management Inc, UBS Group AG, Ameriprise Financial Inc, Commonwealth Equity Services, Llc, and Citadel Advisors Llc .
iShares Trust - iShares U.S. Oil & Gas Exploration & Production ETF (BATS:IEO) institutionel ejerskabsstruktur viser aktuelle positioner i virksomheden efter institutioner og fonde, samt seneste ændringer i positionsstørrelse. Større aktionærer kan omfatte individuelle investorer, investeringsforeninger, hedgefonde eller institutioner. Skema 13D angiver, at investoren besidder (eller besidder) mere end 5 % af virksomheden og har til hensigt (eller har til hensigt at) aktivt at forfølge en ændring i forretningsstrategi. Skema 13G indikerer en passiv investering på over 5%.
The share price as of September 15, 2025 is 90,50 / share. Previously, on September 16, 2024, the share price was 90,68 / share. This represents a decline of 0,19% over that period.
Fondens stemningsscore
Fund Sentiment Score (fka Ownership Accumulation Score) finder de aktier, der bliver mest købt af fonde. Det er resultatet af en sofistikeret, multi-faktor kvantitativ model, der identificerer virksomheder med de højeste niveauer af institutionel akkumulering. Scoringsmodellen bruger en kombination af den samlede stigning i oplyste ejere, ændringerne i porteføljeallokeringer i disse ejere og andre målinger. Tallet går fra 0 til 100, hvor højere tal indikerer et højere niveau af akkumulering for sine jævnaldrende, og 50 er gennemsnittet.
Opdateringsfrekvens: Dagligt
Se Ownership Explorer, som giver en liste over højest rangerende virksomheder.
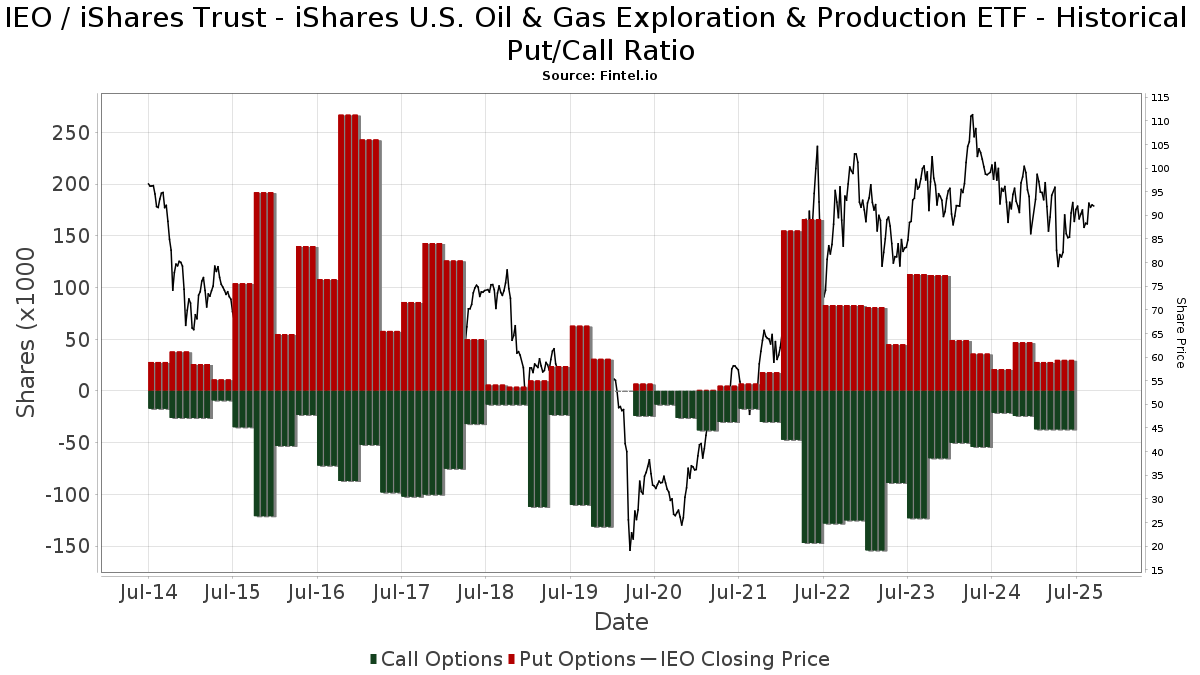
Institutionel Put/Call-forhold
Ud over at indberette standardaktie- og gældsudstedelser skal institutter med mere end 100 mill. aktiver under forvaltning også oplyse deres put- og call-optionsbeholdninger. Da salgsoptioner generelt indikerer negativ stemning, og købsoptioner indikerer positiv stemning, kan vi få en fornemmelse af den overordnede institutionelle stemning ved at plotte forholdet mellem put og kald. Diagrammet til højre viser det historiske put/call-forhold for dette instrument.
Brug af Put/Call Ratio som en indikator for investorernes stemning overvinder en af de vigtigste mangler ved at bruge totalt institutionelt ejerskab, som er, at en betydelig mængde af aktiver under forvaltning investeres passivt for at spore indekser. Passivt forvaltede fonde køber typisk ikke optioner, så indikatoren for put/call-forholdet følger mere nøje følelsen af aktivt forvaltede fonde.
13F og NPORT arkivering
Detaljer om 13F-arkivering er gratis. Detaljer om NP-ansøgninger kræver et premium-medlemskab. Grønne rækker angiver nye positioner. Røde rækker angiver lukkede positioner. Klik på linket ikon for at se den fulde transaktionshistorik.
Opgrader
for at låse premium-data op og eksportere til Excel ![]() .
.
| Fil dato | Kilde | Investor | Type | Gennemsnitlig pris (Øst) |
Aktier | Δ Aktier (%) |
Rapporteret Værdi ($1000) |
Δ Værdi (%) |
Port Alloc (%) |
|
|---|---|---|---|---|---|---|---|---|---|---|
| 2025-08-12 | 13F | Main Management LLC | 100 | 0,00 | 0 | |||||
| 2025-08-13 | 13F | Providence Capital Advisors, LLC | 275 | 24 | ||||||
| 2025-08-14 | 13F | Fiduciary Trust Co | 3.005 | 0,00 | 266 | -6,34 | ||||
| 2025-08-08 | 13F | Larson Financial Group LLC | 155 | 0,65 | 14 | -7,14 | ||||
| 2025-08-12 | 13F | RiverFront Investment Group, LLC | 7.066 | 626 | ||||||
| 2025-05-05 | 13F | IFP Advisors, Inc | 0 | -100,00 | 0 | |||||
| 2025-08-04 | 13F | Spire Wealth Management | 125 | -1,57 | 11 | -8,33 | ||||
| 2025-07-21 | 13F | HighMark Wealth Management LLC | 176 | 0,57 | 16 | -6,25 | ||||
| 2025-07-23 | 13F | Mraz, Amerine & Associates, Inc. | 6.591 | 1,81 | 584 | -3,32 | ||||
| 2025-08-13 | 13F | Financial Freedom, LLC | 157 | 0,00 | 14 | -7,14 | ||||
| 2025-04-21 | 13F | Nelson, Van Denburg & Campbell Wealth Management Group, LLC | 0 | -100,00 | 0 | |||||
| 2025-08-04 | 13F | Assetmark, Inc | 6 | 1 | ||||||
| 2025-08-11 | 13F | Private Advisor Group, LLC | 9.412 | -1,07 | 834 | -7,34 | ||||
| 2025-08-13 | 13F | Quadrature Capital Ltd | 0 | -100,00 | 0 | |||||
| 2025-08-08 | 13F | Creative Planning | 7.209 | -20,93 | 639 | -25,99 | ||||
| 2025-08-07 | 13F | Amica Mutual Insurance Co | 42.750 | -39,97 | 4 | -50,00 | ||||
| 2025-08-12 | 13F | Steward Partners Investment Advisory, Llc | 1.136 | -26,33 | 101 | -31,03 | ||||
| 2025-08-12 | 13F | Viawealth, Llc | 8.136 | -37,79 | 721 | -41,79 | ||||
| 2025-08-14 | 13F | Stifel Financial Corp | 19.971 | -18,97 | 1.769 | -24,11 | ||||
| 2025-09-04 | 13F/A | Advisor Group Holdings, Inc. | 22.054 | 65,69 | 1.955 | 55,20 | ||||
| 2025-08-07 | 13F | Amica Retiree Medical Trust | 2.195 | -29,53 | 0 | |||||
| 2025-07-07 | 13F | Nova Wealth Management, Inc. | 210 | -88,66 | 19 | -89,71 | ||||
| 2025-08-14 | 13F | Wells Fargo & Company/mn | 98.025 | -15,05 | 8.685 | -20,42 | ||||
| 2025-08-14 | 13F | GWM Advisors LLC | 1.321 | 1,77 | 117 | -4,10 | ||||
| 2025-08-13 | 13F | Northern Trust Corp | 7.488 | 0,00 | 663 | -6,36 | ||||
| 2025-07-28 | 13F | Private Wealth Asset Management, LLC | 175 | 0,00 | 16 | -6,25 | ||||
| 2025-08-05 | 13F | Bank Of Montreal /can/ | 917 | 81 | ||||||
| 2025-05-15 | 13F | Wolverine Trading, Llc | Put | 0 | -100,00 | 0 | -100,00 | |||
| 2025-07-11 | 13F | Wealth Management Partners, LLC | 15.881 | -3,79 | 1.431 | -8,39 | ||||
| 2025-08-06 | 13F | AE Wealth Management LLC | 133 | -67,48 | 12 | -71,05 | ||||
| 2025-08-19 | 13F | Anchor Investment Management, LLC | 404 | 0,00 | 36 | -7,89 | ||||
| 2025-08-14 | 13F | Jane Street Group, Llc | 6.369 | -78,93 | 564 | -80,27 | ||||
| 2025-07-08 | 13F | Parallel Advisors, LLC | 380 | -54,65 | 34 | -58,23 | ||||
| 2025-08-05 | 13F | GPS Wealth Strategies Group, LLC | 50 | 0,00 | 4 | 0,00 | ||||
| 2025-07-17 | 13F | Albion Financial Group /ut | 0 | -100,00 | 0 | |||||
| 2025-08-04 | 13F | Carret Asset Management, Llc | 20.731 | -5,26 | 1.837 | -11,26 | ||||
| 2025-05-14 | 13F | Renaissance Technologies Llc | 0 | -100,00 | 0 | |||||
| 2025-07-31 | 13F | City State Bank | 0 | -100,00 | 0 | |||||
| 2025-08-13 | 13F | Alerus Financial Na | 7 | 1 | ||||||
| 2025-07-16 | 13F | Essex Financial Services, Inc. | 0 | -100,00 | 0 | |||||
| 2025-08-04 | 13F | Savvy Advisors, Inc. | 12.186 | -0,93 | 1.080 | -7,22 | ||||
| 2025-05-09 | 13F | Fairfield Financial Advisors, LTD | 0 | -100,00 | 0 | |||||
| 2025-07-14 | 13F | GAMMA Investing LLC | 69 | 0,00 | 6 | 0,00 | ||||
| 2025-08-14 | 13F | EP Wealth Advisors, Inc. | 82.255 | 0,88 | 7.288 | -5,50 | ||||
| 2025-08-14 | 13F | Manufacturers Life Insurance Company, The | 24.252 | 97,85 | 2.149 | 85,33 | ||||
| 2025-07-31 | 13F | Briaud Financial Planning, Inc | 145 | 0 | ||||||
| 2025-07-31 | 13F | Cambridge Investment Research Advisors, Inc. | 18.065 | -47,20 | 2 | -66,67 | ||||
| 2025-08-14 | 13F | Goldman Sachs Group Inc | 7.478 | -10,71 | 663 | -16,41 | ||||
| 2025-08-11 | 13F | Poehling Capital Management, LLC | 3.500 | 0,00 | 310 | -6,34 | ||||
| 2025-08-12 | 13F | Running Point Capital Advisors, LLC | 16 | 0,00 | 1 | 0,00 | ||||
| 2025-08-18 | 13F/A | National Bank Of Canada /fi/ | 176 | 0,00 | 16 | -6,25 | ||||
| 2025-08-11 | 13F | Tidemark, LLC | 70 | 0,00 | 6 | 0,00 | ||||
| 2025-07-17 | 13F | Janney Montgomery Scott LLC | 5.465 | -9,22 | 0 | |||||
| 2025-07-21 | 13F | Ameritas Advisory Services, LLC | 278 | 25 | ||||||
| 2025-07-14 | 13F | UMA Financial Services, Inc. | 71 | 0,00 | 6 | 0,00 | ||||
| 2025-08-14 | 13F | UBS Group AG | 60.392 | -10,51 | 5.351 | -16,17 | ||||
| 2025-08-14 | 13F | Royal Bank Of Canada | 45.892 | -20,20 | 4.066 | -25,24 | ||||
| 2025-08-18 | 13F | Wolverine Trading, Llc | Call | 2.500 | 223 | |||||
| 2025-08-06 | 13F | Commonwealth Equity Services, Llc | 53.097 | -3,02 | 5 | -20,00 | ||||
| 2025-08-12 | 13F | O'shaughnessy Asset Management, Llc | 227 | -61,66 | 20 | -63,64 | ||||
| 2025-07-23 | 13F | Prime Capital Investment Advisors, LLC | 0 | -100,00 | 0 | |||||
| 2025-08-11 | 13F | Principal Securities, Inc. | 0 | -100,00 | 0 | |||||
| 2025-05-12 | 13F | Sandy Spring Bank | 353 | -76,51 | 33 | -75,37 | ||||
| 2025-08-12 | 13F | Proequities, Inc. | 0 | 0 | ||||||
| 2025-08-14 | 13F | CoreCap Advisors, LLC | 56 | -3,45 | 5 | 0,00 | ||||
| 2025-08-12 | 13F | Global Retirement Partners, LLC | 1.597 | -38,46 | 142 | -39,22 | ||||
| 2025-07-29 | 13F | Mezzasalma Advisors, LLC | 9.094 | -3,10 | 806 | -9,24 | ||||
| 2025-08-13 | 13F | Marshall Wace, Llp | 4.663 | 413 | ||||||
| 2025-07-14 | 13F | Painted Porch Advisors LLC | 50 | 0,00 | 4 | 0,00 | ||||
| 2025-08-12 | 13F | Founders Financial Alliance, LLC | 49 | 2,08 | 4 | 0,00 | ||||
| 2025-08-12 | 13F | Franklin Resources Inc | 1.250 | 111 | ||||||
| 2025-08-12 | 13F | Gladstone Institutional Advisory LLC | 0 | -100,00 | 0 | |||||
| 2025-08-14 | 13F | Fmr Llc | 1.439 | 38,63 | 127 | 29,59 | ||||
| 2025-07-14 | 13F | Abound Wealth Management | 158 | 0,00 | 14 | 0,00 | ||||
| 2025-08-25 | 13F/A | Kovitz Investment Group Partners, LLC | 0 | -100,00 | 0 | |||||
| 2025-07-01 | 13F | Harbor Investment Advisory, Llc | 1.550 | -24,39 | 137 | -29,02 | ||||
| 2025-08-06 | 13F | Golden State Wealth Management, LLC | 200 | -26,74 | 18 | -32,00 | ||||
| 2025-08-13 | 13F | Beacon Pointe Advisors, LLC | 18.530 | -6,26 | 1.642 | -12,20 | ||||
| 2025-08-15 | 13F | Kestra Advisory Services, LLC | 4.299 | -1,01 | 381 | -7,32 | ||||
| 2025-07-24 | 13F | Blair William & Co/il | 914 | -43,37 | 81 | -47,37 | ||||
| 2025-07-16 | 13F | Brown, Lisle/cummings, Inc. | 187 | 68,47 | 17 | 60,00 | ||||
| 2025-05-02 | 13F | Sigma Planning Corp | 0 | -100,00 | 0 | |||||
| 2025-08-14 | 13F | Cypress Asset Management Inc/tx | 5.188 | -10,37 | 460 | -16,09 | ||||
| 2025-08-14 | 13F | Arete Wealth Advisors, LLC | 14.135 | 1 | ||||||
| 2025-08-11 | 13F | TD Waterhouse Canada Inc. | 3.964 | 0,00 | 351 | -6,90 | ||||
| 2025-08-13 | 13F | Capital Analysts, Inc. | 422 | 0 | ||||||
| 2025-08-06 | 13F | Prospera Financial Services Inc | 2.675 | -36,88 | 237 | -40,90 | ||||
| 2025-07-29 | 13F | Stephens Inc /ar/ | 4.382 | -4,88 | 388 | -10,80 | ||||
| 2025-08-07 | 13F | PFG Advisors | 0 | -100,00 | 0 | |||||
| 2025-07-11 | 13F | Vanguard Capital Wealth Advisors This fund is a listed as child fund of Vanguard Group Inc and if that institution has disclosed ownership in this security, then these positions will not be double counted when calculating total shares and total value | 2.914 | 258 | ||||||
| 2025-08-14 | 13F | Citadel Advisors Llc | Call | 8.000 | 31,15 | 709 | 22,92 | |||
| 2025-08-14 | 13F | Citadel Advisors Llc | 52.322 | 191,05 | 4.636 | 172,65 | ||||
| 2025-07-28 | 13F | Harbour Investments, Inc. | 725 | -12,12 | 64 | -17,95 | ||||
| 2025-07-17 | 13F | Enclave Advisors LLC | 10.191 | 0,00 | 903 | -6,33 | ||||
| 2025-08-14 | 13F | Ameriprise Financial Inc | 54.222 | -6,12 | 4.804 | -11,97 | ||||
| 2025-08-14 | 13F | Mml Investors Services, Llc | 47.903 | -2,43 | 4 | 0,00 | ||||
| 2025-08-11 | 13F | Aptus Capital Advisors, LLC | 127 | 0,00 | 11 | -8,33 | ||||
| 2025-08-15 | 13F | Audent Global Asset Management, LLC | 18.356 | 0,03 | 1.626 | -6,28 | ||||
| 2025-08-08 | 13F | Altfest L J & Co Inc | 4.327 | 0,25 | 383 | -6,13 | ||||
| 2025-08-12 | 13F | Bokf, Na | 263 | 0,00 | 23 | -4,17 | ||||
| 2025-08-14 | 13F | Citadel Advisors Llc | Put | 24.100 | 0,84 | 2.135 | -5,53 | |||
| 2025-07-25 | 13F | Johnson Investment Counsel Inc | 21.801 | 0,00 | 1.932 | -6,31 | ||||
| 2025-08-13 | 13F | Northwestern Mutual Wealth Management Co | 32.836 | -14,91 | 2.909 | -20,28 | ||||
| 2025-08-15 | 13F | Equitable Holdings, Inc. | 8.769 | 5,40 | 777 | -1,27 | ||||
| 2025-07-29 | 13F | Cottonwood Capital Advisors, Llc | 20.854 | -2,35 | 1.848 | -8,52 | ||||
| 2025-07-09 | 13F | Westmount Partners, LLC | 8.285 | 0,56 | 734 | -5,78 | ||||
| 2025-07-09 | 13F | Breakwater Investment Management | 0 | -100,00 | 0 | |||||
| 2025-05-09 | 13F | Scotia Capital Inc. | 0 | -100,00 | 0 | |||||
| 2025-08-14 | 13F | Bank Of America Corp /de/ | 141.454 | -3,18 | 12.533 | -9,31 | ||||
| 2025-08-14 | 13F | Clarity Asset Management, Inc. | 25 | 2 | ||||||
| 2025-07-08 | 13F | Nbc Securities, Inc. | 783 | 24,68 | 0 | |||||
| 2025-08-01 | 13F | Envestnet Asset Management Inc | 70.032 | 1,11 | 6.205 | -5,28 | ||||
| 2025-08-14 | 13F | Federation des caisses Desjardins du Quebec | 0 | -100,00 | 0 | |||||
| 2025-08-14 | 13F | Raymond James Financial Inc | 34.942 | -15,22 | 3.096 | -20,60 | ||||
| 2025-08-06 | 13F | Tradewinds, LLC. | 0 | -100,00 | 0 | |||||
| 2025-08-12 | 13F | J.w. Cole Advisors, Inc. | 6.653 | 0,18 | 589 | -6,21 | ||||
| 2025-08-07 | 13F | Runnymede Capital Advisors, Inc. | 0 | -100,00 | 0 | |||||
| 2025-07-07 | 13F | Investors Research Corp | 25.723 | 23,61 | 2.279 | 15,80 | ||||
| 2025-07-17 | 13F | Altus Wealth Management, LLC | 0 | -100,00 | 0 | |||||
| 2025-07-17 | 13F | Sound Income Strategies, LLC | 1 | 0 | ||||||
| 2025-07-16 | 13F/A | CX Institutional | 707 | 910,00 | 0 | |||||
| 2025-07-22 | 13F | Red Tortoise LLC | 1.139 | 0,53 | 101 | -6,54 | ||||
| 2025-08-13 | 13F | Jones Financial Companies Lllp | 9.131 | 2,40 | 815 | -1,93 | ||||
| 2025-07-16 | 13F | PFS Partners, LLC | 2 | 0,00 | 0 | |||||
| 2025-07-28 | 13F | BRYN MAWR TRUST Co | 4.600 | 21,05 | 408 | 13,37 | ||||
| 2025-08-14 | 13F | Mariner, LLC | 6.479 | 0,48 | 574 | -5,75 | ||||
| 2025-08-06 | 13F | First Horizon Advisors, Inc. | 2.487 | 0,00 | 220 | -6,38 | ||||
| 2025-08-12 | 13F | MAI Capital Management | 81 | -10,99 | 7 | -12,50 | ||||
| 2025-08-11 | 13F | Strategic Wealth Partners, Ltd. | 500 | 44 | ||||||
| 2025-08-05 | 13F | Atlas Private Wealth Advisors | 0 | -100,00 | 0 | |||||
| 2025-08-12 | 13F | Jpmorgan Chase & Co | 10.551 | -32,82 | 935 | -37,10 | ||||
| 2025-07-25 | 13F | Concord Wealth Partners | 46 | 4 | ||||||
| 2025-07-24 | 13F | Stonebridge Financial Group, LLC | 0 | -100,00 | 0 | |||||
| 2025-07-25 | 13F | Endowment Wealth Management, Inc. | 7.332 | -1,40 | 650 | -7,68 | ||||
| 2025-07-31 | 13F | Gill Capital Partners, Llc | 0 | -100,00 | 0 | |||||
| 2025-08-07 | 13F | PCG Wealth Advisors, LLC | 10.549 | -52,22 | 935 | -55,25 | ||||
| 2025-07-07 | 13F | Bangor Savings Bank | 0 | -100,00 | 0 | |||||
| 2025-08-08 | 13F | New England Capital Financial Advisors LLC | 225 | 0,00 | 20 | -9,52 | ||||
| 2025-08-11 | 13F | HighTower Advisors, LLC | 4.021 | 16,45 | 356 | 9,20 | ||||
| 2025-07-25 | 13F | Cwm, Llc | 306 | 24,39 | 0 | |||||
| 2025-08-14 | 13F | Ancora Advisors, LLC | 1.145 | 0,00 | 101 | -6,48 | ||||
| 2025-08-14 | 13F | Mercer Global Advisors Inc /adv | 2.950 | 0,44 | 261 | -5,78 | ||||
| 2025-07-22 | 13F | Cedar Mountain Advisors, LLC | 41 | 0,00 | 4 | 0,00 | ||||
| 2025-08-12 | 13F | CIBC Private Wealth Group, LLC | 360 | 0,00 | 32 | 19,23 | ||||
| 2025-07-29 | 13F | Private Trust Co Na | 50 | 4 | ||||||
| 2025-08-11 | 13F | Citigroup Inc | 2.110 | 0,00 | 187 | -6,53 | ||||
| 2025-07-22 | 13F | Grimes & Company, Inc. | 27.390 | -17,70 | 2.427 | -22,91 | ||||
| 2025-04-21 | 13F | Ronald Blue Trust, Inc. | 0 | -100,00 | 0 | -100,00 | ||||
| 2025-07-31 | 13F/A | Avion Wealth | 150 | 0,00 | 0 | |||||
| 2025-04-17 | 13F | Medici Capital Llc | 0 | -100,00 | 0 | |||||
| 2025-07-11 | 13F | Farther Finance Advisors, LLC | 1 | 0 | ||||||
| 2025-08-08 | 13F | Pnc Financial Services Group, Inc. | 0 | -100,00 | 0 | |||||
| 2025-08-13 | 13F | Martin & Co Inc /tn/ | 21.463 | -0,92 | 1.902 | -7,18 | ||||
| 2025-08-07 | 13F | Winch Advisory Services, LLC | 457 | 0,66 | 40 | -4,76 | ||||
| 2025-08-06 | 13F | Atlantic Union Bankshares Corp | 153 | 14 | ||||||
| 2025-07-21 | 13F | Hilltop National Bank | 315 | 0,00 | 28 | -3,57 | ||||
| 2025-07-31 | 13F | Stegent Equity Advisors, Inc. | 36.875 | 21,50 | 3.267 | 13,83 | ||||
| 2025-08-18 | 13F | Geneos Wealth Management Inc. | 16 | 0,00 | 1 | 0,00 | ||||
| 2025-07-11 | 13F | Caldwell Securities, Inc | 200 | 0,00 | 18 | -5,56 | ||||
| 2025-07-22 | 13F | Alta Wealth Advisors LLC | 0 | -100,00 | 0 | |||||
| 2025-08-15 | 13F | Morgan Stanley | 356.005 | -11,24 | 31.542 | -16,85 | ||||
| 2025-08-13 | 13F | Cresset Asset Management, LLC | 4.229 | -29,84 | 375 | -34,39 | ||||
| 2025-08-14 | 13F | Susquehanna International Group, Llp | Put | 6.200 | 44,19 | 549 | 35,22 | |||
| 2025-08-14 | 13F | Susquehanna International Group, Llp | 15.328 | -66,50 | 1.358 | -68,62 | ||||
| 2025-08-14 | 13F | Two Sigma Investments, Lp | 0 | -100,00 | 0 | |||||
| 2025-08-14 | 13F | Susquehanna International Group, Llp | Call | 26.600 | -14,74 | 2.357 | -20,14 | |||
| 2025-05-07 | 13F | Zurcher Kantonalbank (Zurich Cantonalbank) | 0 | -100,00 | 0 | |||||
| 2025-07-18 | 13F | Truist Financial Corp | 16.483 | 3,61 | 1.460 | -2,93 | ||||
| 2025-08-05 | 13F | Simplex Trading, Llc | 125 | 0 | ||||||
| 2025-08-12 | 13F | LPL Financial LLC | 101.456 | -10,63 | 8.989 | -16,28 | ||||
| 2025-08-12 | 13F | SRS Capital Advisors, Inc. | 219 | 0,00 | 19 | -5,00 | ||||
| 2025-05-15 | 13F | Advisory Services Network, LLC | 0 | -100,00 | 0 | |||||
| 2025-08-07 | 13F | Allworth Financial LP | 0 | -100,00 | 0 | |||||
| 2025-08-12 | 13F | Coldstream Capital Management Inc | 0 | -100,00 | 0 | |||||
| 2025-08-13 | 13F | GeoWealth Management, LLC | 695 | -7,70 | 62 | -14,08 | ||||
| 2025-07-25 | 13F | SPC Financial, Inc. | 27.112 | -5,86 | 2.402 | -11,79 | ||||
| 2025-08-08 | 13F | Cetera Investment Advisers | 10.359 | 4,07 | 918 | -2,55 | ||||
| 2025-07-16 | 13F | Signaturefd, Llc | 11 | 0,00 | 1 | -100,00 | ||||
| 2025-08-13 | 13F | Sumitomo Mitsui Financial Group, Inc. | 2.005 | 2,56 | 178 | -3,80 | ||||
| 2025-08-14 | 13F | Bnp Paribas Arbitrage, Sa | 50.000 | 4.430 | ||||||
| 2025-08-12 | 13F | Howe & Rusling Inc | 202 | 0,00 | 18 | -10,53 | ||||
| 2025-07-17 | 13F | Guyasuta Investment Advisors Inc | 4.109 | 0,00 | 364 | -6,19 | ||||
| 2025-08-13 | 13F | Independent Family Office, LLC | 13.297 | 23,84 | 1.178 | 16,06 | ||||
| 2025-08-14 | 13F | Sunbelt Securities, Inc. | 8.299 | 59,44 | 744 | 51,02 | ||||
| 2025-07-23 | 13F | RMG Wealth Management LLC | 300 | 27 | ||||||
| 2025-07-28 | 13F | Mutual Advisors, LLC | 38.631 | -11,15 | 3.466 | -3,99 | ||||
| 2025-05-12 | 13F | Allianz Se | 67 | 0,00 | 6 | 0,00 | ||||
| 2025-04-28 | 13F | D.a. Davidson & Co. | 0 | -100,00 | 0 | |||||
| 2025-07-30 | 13F | Whittier Trust Co | 2.682 | 0,00 | 238 | -6,32 | ||||
| 2025-08-15 | 13F | Tower Research Capital LLC (TRC) | 16.261 | 7.191,93 | 1.441 | 6.757,14 | ||||
| 2025-07-29 | 13F | Activest Wealth Management | 0 | -100,00 | 0 | |||||
| 2025-07-07 | 13F | Thurston, Springer, Miller, Herd & Titak, Inc. | 235 | -86,59 | 21 | -87,88 | ||||
| 2025-08-12 | 13F | Jefferies Financial Group Inc. | 0 | -100,00 | 0 | |||||
| 2025-05-16 | 13F | Coppell Advisory Solutions LLC | 0 | -100,00 | 0 | |||||
| 2025-07-30 | 13F | Brookstone Capital Management | 0 | -100,00 | 0 | |||||
| 2025-08-14 | 13F | Comerica Bank | 105 | 0,00 | 9 | 0,00 | ||||
| 2025-07-30 | 13F | Whittier Trust Co Of Nevada Inc | 700 | 0,00 | 62 | -6,06 | ||||
| 2025-08-08 | 13F | Avantax Advisory Services, Inc. | 2.741 | -0,33 | 243 | -6,92 | ||||
| 2025-08-14 | 13F | Riggs Asset Managment Co. Inc. | 0 | -100,00 | 0 |