Grundlæggende statistik
| Institutionelle ejere | 163 total, 163 long only, 0 short only, 0 long/short - change of 14,79% MRQ |
| Gennemsnitlig porteføljeallokering | 0.4365 % - change of -7,25% MRQ |
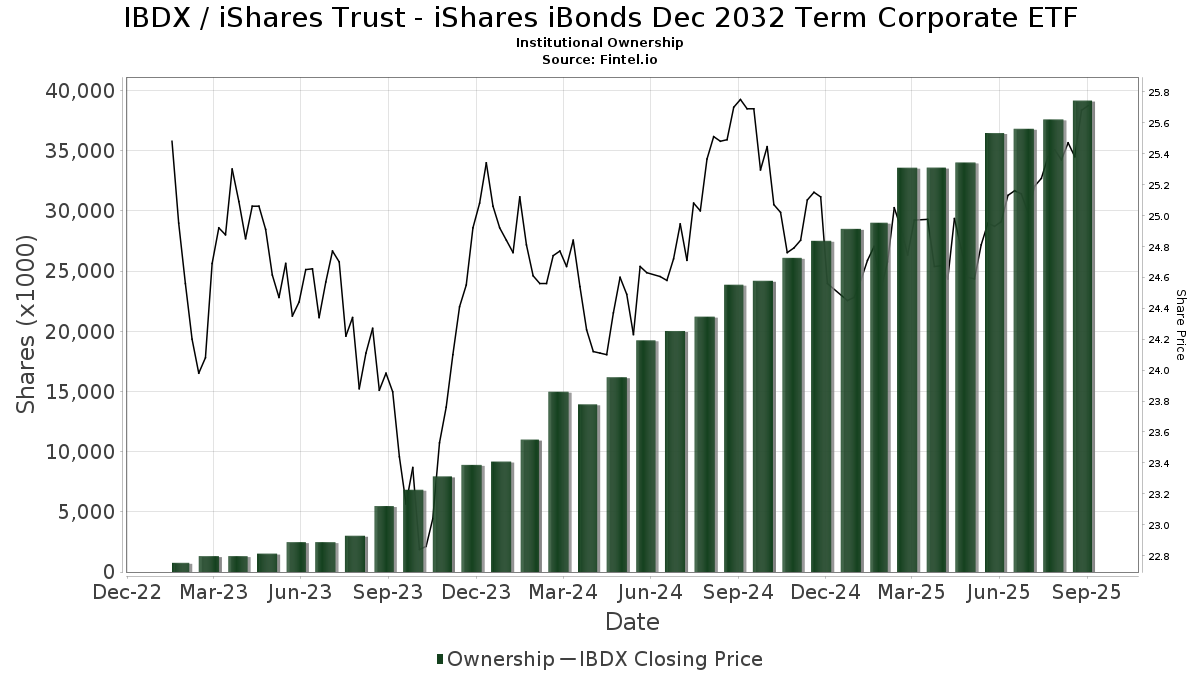
| Institutionelle aktier (lange) | 39.158.216 (ex 13D/G) - change of 2,71MM shares 7,42% MRQ |
| Institutionel værdi (lang) | $ 961.480 USD ($1000) |
Institutionelt ejerskab og aktionærer
iShares Trust - iShares iBonds Dec 2032 Term Corporate ETF (US:IBDX) har 163 institutionelle ejere og aktionærer, der har indsendt 13D/G- eller 13F-formularer til Securities Exchange Commission (SEC). Disse institutioner har i alt 39,158,216 aktier. Største aktionærer omfatter Aptus Capital Advisors, LLC, DRSK - Aptus Defined Risk ETF, Capital Investment Advisors, LLC, Wells Fargo & Company/mn, Bank Of America Corp /de/, First Interstate Bank, Morgan Stanley, Sigma Investment Counselors Inc, Summitry Llc, and Mv Capital Management, Inc. .
iShares Trust - iShares iBonds Dec 2032 Term Corporate ETF (ARCA:IBDX) institutionel ejerskabsstruktur viser aktuelle positioner i virksomheden efter institutioner og fonde, samt seneste ændringer i positionsstørrelse. Større aktionærer kan omfatte individuelle investorer, investeringsforeninger, hedgefonde eller institutioner. Skema 13D angiver, at investoren besidder (eller besidder) mere end 5 % af virksomheden og har til hensigt (eller har til hensigt at) aktivt at forfølge en ændring i forretningsstrategi. Skema 13G indikerer en passiv investering på over 5%.
The share price as of September 15, 2025 is 25,78 / share. Previously, on September 16, 2024, the share price was 25,83 / share. This represents a decline of 0,21% over that period.
Fondens stemningsscore
Fund Sentiment Score (fka Ownership Accumulation Score) finder de aktier, der bliver mest købt af fonde. Det er resultatet af en sofistikeret, multi-faktor kvantitativ model, der identificerer virksomheder med de højeste niveauer af institutionel akkumulering. Scoringsmodellen bruger en kombination af den samlede stigning i oplyste ejere, ændringerne i porteføljeallokeringer i disse ejere og andre målinger. Tallet går fra 0 til 100, hvor højere tal indikerer et højere niveau af akkumulering for sine jævnaldrende, og 50 er gennemsnittet.
Opdateringsfrekvens: Dagligt
Se Ownership Explorer, som giver en liste over højest rangerende virksomheder.
Institutionel Put/Call-forhold
Ud over at indberette standardaktie- og gældsudstedelser skal institutter med mere end 100 mill. aktiver under forvaltning også oplyse deres put- og call-optionsbeholdninger. Da salgsoptioner generelt indikerer negativ stemning, og købsoptioner indikerer positiv stemning, kan vi få en fornemmelse af den overordnede institutionelle stemning ved at plotte forholdet mellem put og kald. Diagrammet til højre viser det historiske put/call-forhold for dette instrument.
Brug af Put/Call Ratio som en indikator for investorernes stemning overvinder en af de vigtigste mangler ved at bruge totalt institutionelt ejerskab, som er, at en betydelig mængde af aktiver under forvaltning investeres passivt for at spore indekser. Passivt forvaltede fonde køber typisk ikke optioner, så indikatoren for put/call-forholdet følger mere nøje følelsen af aktivt forvaltede fonde.
13F og NPORT arkivering
Detaljer om 13F-arkivering er gratis. Detaljer om NP-ansøgninger kræver et premium-medlemskab. Grønne rækker angiver nye positioner. Røde rækker angiver lukkede positioner. Klik på linket ikon for at se den fulde transaktionshistorik.
Opgrader
for at låse premium-data op og eksportere til Excel ![]() .
.
| Fil dato | Kilde | Investor | Type | Gennemsnitlig pris (Øst) |
Aktier | Δ Aktier (%) |
Rapporteret Værdi ($1000) |
Δ Værdi (%) |
Port Alloc (%) |
|
|---|---|---|---|---|---|---|---|---|---|---|
| 2025-08-14 | 13F | Wells Fargo & Company/mn | 2.675.128 | 3,42 | 67.641 | 4,64 | ||||
| 2025-07-16 | 13F | Gradient Capital Advisors, LLC | 32.548 | 0,02 | 823 | 1,11 | ||||
| 2025-08-12 | 13F | BlackRock, Inc. | 50 | 0,00 | 1 | 0,00 | ||||
| 2025-09-04 | 13F/A | Advisor Group Holdings, Inc. | 7.666 | -56,80 | 194 | -56,43 | ||||
| 2025-07-21 | 13F | Precedent Wealth Partners, Llc | 126.582 | 11,17 | 3.201 | 12,48 | ||||
| 2025-08-08 | 13F | Summitry Llc | 1.053.450 | 23,39 | 26.636 | 24,84 | ||||
| 2025-08-08 | 13F | Creative Planning | 0 | -100,00 | 0 | |||||
| 2025-08-13 | 13F | Lido Advisors, LLC | 160.433 | 2,59 | 4.057 | 3,79 | ||||
| 2025-08-06 | 13F | Commonwealth Equity Services, Llc | 345.959 | -1,50 | 9 | 0,00 | ||||
| 2025-08-11 | 13F | United Capital Financial Advisers, Llc | 56.010 | 4,97 | 1.416 | 6,15 | ||||
| 2025-08-07 | 13F | Sound View Wealth Advisors Group, LLC | 657.139 | 20,96 | 16.616 | 22,39 | ||||
| 2025-08-04 | 13F | REDW Wealth LLC | 41.744 | 1,75 | 1.055 | 2,93 | ||||
| 2025-08-14 | 13F | Mercer Global Advisors Inc /adv | 55.983 | 9,91 | 1.416 | 11,24 | ||||
| 2025-08-11 | 13F | Banque Cantonale Vaudoise | 5.298 | 0,00 | 0 | |||||
| 2025-04-29 | 13F | Element Wealth, LLC | 0 | -100,00 | 0 | |||||
| 2025-08-11 | 13F | Arrow Financial Corp | 591.999 | -0,87 | 14.969 | 0,30 | ||||
| 2025-05-07 | 13F | Spectrum Wealth Counsel, LLC | 15.544 | 1.072,25 | 388 | 1.112,50 | ||||
| 2025-07-30 | 13F | Granite Harbor Advisors, Inc. | 26.567 | 672 | ||||||
| 2025-08-14 | 13F | Mml Investors Services, Llc | 21.891 | -37,08 | 1 | |||||
| 2025-04-17 | 13F | Montecito Bank & Trust | 28.265 | 1,00 | 706 | 2,77 | ||||
| 2025-05-14 | 13F | Van Hulzen Asset Management, LLC | 0 | -100,00 | 0 | -100,00 | ||||
| 2025-07-14 | 13F | McGlone Suttner Wealth Management, Inc. | 45.000 | 0,69 | 1.138 | 1,88 | ||||
| 2025-07-08 | 13F | Parallel Advisors, LLC | 218.176 | 8,66 | 5.517 | 9,95 | ||||
| 2025-08-11 | 13F | Guidance Point Advisors, LLC | 278.413 | 0,82 | 7.040 | 2,00 | ||||
| 2025-04-29 | 13F | Hm Payson & Co | 1.177 | 29 | ||||||
| 2025-08-01 | 13F | Envestnet Asset Management Inc | 224.932 | 16,49 | 5.687 | 17,87 | ||||
| 2025-08-11 | 13F | Aptus Capital Advisors, LLC | 4.261.556 | 6,42 | 107.753 | 7,68 | ||||
| 2025-08-14 | 13F | GWM Advisors LLC | 125.946 | -24,95 | 3.185 | -24,06 | ||||
| 2025-08-13 | 13F | Peloton Wealth Strategists | 52.500 | 0,00 | 1 | 0,00 | ||||
| 2025-06-27 | NP | DRSK - Aptus Defined Risk ETF | 4.090.943 | 9,52 | 102.192 | 10,81 | ||||
| 2025-07-22 | 13F | Belpointe Asset Management LLC | 16.612 | 420 | ||||||
| 2025-08-15 | 13F | Captrust Financial Advisors | 29.042 | -17,13 | 734 | -16,11 | ||||
| 2025-08-11 | 13F | Stonebrook Private Inc. | 88.004 | 2,77 | 2.225 | 3,97 | ||||
| 2025-08-14 | 13F | Jupiter Wealth Management LLC | 5.100 | 130 | ||||||
| 2025-08-14 | 13F | Wilkins Miller Wealth Management, LLC | 55.345 | -10,48 | 1.399 | -9,39 | ||||
| 2025-08-12 | 13F | Associated Banc-corp | 40.939 | 10,50 | 1.035 | 11,89 | ||||
| 2025-08-15 | 13F | Howland Capital Management Llc | 32.890 | 52,96 | 832 | 54,75 | ||||
| 2025-08-08 | 13F | Cetera Investment Advisers | 68.529 | 20,73 | 1.733 | 22,14 | ||||
| 2025-07-16 | 13F | Evergreen Private Wealth LLC | 130.682 | 7,13 | 3.304 | 8,40 | ||||
| 2025-08-14 | 13F | Royal Bank Of Canada | 349.038 | -4,15 | 8.826 | -3,01 | ||||
| 2025-08-01 | 13F | Bank of Jackson Hole Trust | 226 | 0,00 | 6 | 0,00 | ||||
| 2025-08-19 | 13F | Advisory Services Network, LLC | 14.320 | 6,61 | 361 | 7,76 | ||||
| 2025-07-09 | 13F | Chesley Taft & Associates LLC | 28.800 | 203,16 | 728 | 207,17 | ||||
| 2025-08-12 | 13F | LPL Financial LLC | 262.135 | 10,20 | 6.628 | 11,51 | ||||
| 2025-08-14 | 13F | Headinvest, Llc | 36.890 | 0,00 | 933 | 1,19 | ||||
| 2025-07-09 | 13F | Byrne Asset Management LLC | 0 | -100,00 | 0 | |||||
| 2025-08-14 | 13F | Frisch Financial Group, Inc. | 132.456 | 3 | ||||||
| 2025-07-25 | 13F | Cwm, Llc | 103.231 | 2,87 | 3 | 0,00 | ||||
| 2025-08-13 | 13F | Hendershot Investments Inc. | 8.156 | 0,00 | 206 | 1,48 | ||||
| 2025-07-09 | 13F | Stony Point Wealth Management Inc. | 421.817 | -2,95 | 10.666 | -1,80 | ||||
| 2025-07-23 | 13F | Valmark Advisers, Inc. | 9.767 | 11,28 | 247 | 12,33 | ||||
| 2025-07-16 | 13F | NovaPoint Capital, LLC | 41.836 | 0,89 | 1.058 | 2,03 | ||||
| 2025-08-04 | 13F | Roble, Belko & Company, Inc | 10.247 | 44,06 | 0 | |||||
| 2025-07-07 | 13F | Trust Co | 1.979 | 0,00 | 50 | 2,04 | ||||
| 2025-07-23 | 13F | Meitav Dash Investments Ltd | 36.322 | 11,26 | 917 | 12,52 | ||||
| 2025-08-05 | 13F | Cherry Tree Wealth Management, LLC | 12.273 | 40,55 | 310 | 42,20 | ||||
| 2025-08-14 | 13F | Mariner, LLC | 70.106 | 6,93 | 1.773 | 8,18 | ||||
| 2025-04-15 | 13F | First United Bank Trust/ | 0 | -100,00 | 0 | |||||
| 2025-08-14 | 13F | Comerica Bank | 17.484 | -9,66 | 442 | -8,49 | ||||
| 2025-08-14 | 13F | Benjamin Edwards Inc | 180.505 | -5,24 | 4.564 | -4,12 | ||||
| 2025-04-30 | 13F | Stratos Wealth Partners, LTD. | 0 | -100,00 | 0 | |||||
| 2025-08-14 | 13F | UBS Group AG | 736.785 | -15,00 | 18.630 | -13,99 | ||||
| 2025-08-12 | 13F | Cowa, Llc | 312.775 | 86,34 | 7.899 | 88,32 | ||||
| 2025-08-12 | 13F | Farmers National Bank | 28.010 | 1,53 | 708 | 2,76 | ||||
| 2025-08-15 | 13F | Koesten, Hirschmann & Crabtree, INC. | 7.315 | 8,53 | 185 | 9,52 | ||||
| 2025-05-13 | 13F | Steward Partners Investment Advisory, Llc | 0 | -100,00 | 0 | |||||
| 2025-08-14 | 13F | Ameriprise Financial Inc | 808.343 | 26,93 | 20.243 | 27,20 | ||||
| 2025-07-11 | 13F | Quantum Financial Advisors, LLC | 66.646 | 4,87 | 1.685 | 6,11 | ||||
| 2025-08-08 | 13F | Avantax Advisory Services, Inc. | 18.434 | 7,07 | 466 | 8,37 | ||||
| 2025-07-17 | 13F | Archford Capital Strategies, LLC | 79.915 | -4,79 | 2.021 | -3,67 | ||||
| 2025-07-01 | 13F | Harbor Investment Advisory, Llc | 2.000 | 0,00 | 51 | 2,04 | ||||
| 2025-08-14 | 13F | Citadel Advisors Llc | 247.692 | 8,35 | 6.263 | 9,63 | ||||
| 2025-08-06 | 13F | Atlantic Union Bankshares Corp | 219.947 | 5.561 | ||||||
| 2025-08-07 | 13F | Kestra Private Wealth Services, Llc | 12.630 | 319 | ||||||
| 2025-08-07 | 13F | CENTRAL TRUST Co | 2.922 | -8,43 | 74 | -7,59 | ||||
| 2025-07-18 | 13F | Centricity Wealth Management, LLC | 1.625 | 0,00 | 41 | 2,50 | ||||
| 2025-08-01 | 13F | First National Trust Co | 13.560 | 3,09 | 343 | 4,27 | ||||
| 2025-08-11 | 13F | Annis Gardner Whiting Capital Advisors, LLC | 1.083 | 27 | ||||||
| 2025-05-06 | 13F | Venturi Wealth Management, LLC | 0 | -100,00 | 0 | |||||
| 2025-07-14 | 13F | Sowell Financial Services LLC | 10.515 | 266 | ||||||
| 2025-05-12 | 13F | Sandy Spring Bank | 216.387 | 6,60 | 5.408 | 8,38 | ||||
| 2025-08-04 | 13F | Arkadios Wealth Advisors | 9.315 | -3,95 | 236 | -2,89 | ||||
| 2025-08-04 | 13F | Assetmark, Inc | 0 | -100,00 | 0 | |||||
| 2025-08-15 | 13F | Morgan Stanley | 1.596.453 | 8,94 | 40.366 | 10,22 | ||||
| 2025-08-12 | 13F | Reliant Wealth Planning | 44.557 | 1.127 | ||||||
| 2025-05-16 | 13F | Coppell Advisory Solutions LLC | 0 | -100,00 | 0 | |||||
| 2025-08-12 | 13F | Global Retirement Partners, LLC | 274 | 7 | ||||||
| 2025-08-14 | 13F | Evergreen Wealth Solutions, LLC | 75.833 | -7,81 | 1.917 | -6,72 | ||||
| 2025-08-14 | 13F | STAR Financial Bank | 73.185 | 89,33 | 1.850 | 91,71 | ||||
| 2025-08-08 | 13F | Wrapmanager Inc | 137.444 | 3.475 | ||||||
| 2025-08-07 | 13F | Allworth Financial LP | 849 | 0,00 | 21 | 0,00 | ||||
| 2025-08-13 | 13F | Beacon Pointe Advisors, LLC | 31.865 | 3,45 | 806 | 4,68 | ||||
| 2025-07-30 | 13F | First Interstate Bank | 1.985.980 | -2,21 | 50.216 | -1,05 | ||||
| 2025-08-04 | 13F | Creative Financial Designs Inc /adv | 206 | 0,00 | 5 | 0,00 | ||||
| 2025-04-23 | 13F | Sabal Trust CO | 196.089 | 11,36 | 4.900 | 13,22 | ||||
| 2025-07-23 | 13F | Ironwood Financial, llc | 24.410 | 0,00 | 610 | 0,00 | ||||
| 2025-08-12 | 13F | Cooper/haims Advisors, Llc | 10.407 | 0,00 | 263 | 1,15 | ||||
| 2025-07-09 | 13F | Bank of New Hampshire | 7.030 | 603,00 | 178 | 637,50 | ||||
| 2025-08-11 | 13F | PFG Private Wealth Management, LLC | 446.942 | 2,96 | 11.301 | 4,18 | ||||
| 2025-07-31 | 13F | Keeler THomas Management LLC | 35.950 | 49,97 | 909 | 51,59 | ||||
| 2025-08-06 | 13F | Adviser Investments LLC | 154.504 | 2,15 | 3.907 | 3,36 | ||||
| 2025-08-11 | 13F | Private Advisor Group, LLC | 24.329 | 40,92 | 615 | 42,69 | ||||
| 2025-08-14 | 13F | Glenview Trust Co | 20.534 | 69,23 | 519 | 71,29 | ||||
| 2025-07-22 | 13F | 4Thought Financial Group Inc. | 192.006 | 13,33 | 4.855 | 14,67 | ||||
| 2025-08-13 | 13F | Jones Financial Companies Lllp | 5.710 | 307,86 | 144 | 323,53 | ||||
| 2025-08-13 | 13F | Northwestern Mutual Wealth Management Co | 26.958 | 28,54 | 682 | 29,96 | ||||
| 2025-08-13 | 13F | StoneX Group Inc. | 12.889 | 1,08 | 326 | 2,20 | ||||
| 2025-08-14 | 13F | Jane Street Group, Llc | 0 | -100,00 | 0 | |||||
| 2025-08-07 | 13F | Nwam Llc | 9.528 | 240 | ||||||
| 2025-07-24 | 13F | IFP Advisors, Inc | 32.288 | 17,00 | 816 | 18,43 | ||||
| 2025-08-07 | 13F | Gryphon Financial Partners LLC | 19.564 | 495 | ||||||
| 2025-05-12 | 13F | C2P Capital Advisory Group, LLC d.b.a. Prosperity Capital Advisors | 0 | -100,00 | 0 | -100,00 | ||||
| 2025-08-01 | 13F | Paradigm, Strategies in Wealth Management, LLC | 143.265 | -3,32 | 3.622 | -2,19 | ||||
| 2025-08-12 | 13F | Jpmorgan Chase & Co | 0 | -100,00 | 0 | |||||
| 2025-08-14 | 13F | Bank Of America Corp /de/ | 2.252.296 | 0,89 | 56.949 | 2,08 | ||||
| 2025-08-12 | 13F | Proequities, Inc. | 0 | 0 | ||||||
| 2025-07-29 | 13F | Mb, Levis & Associates, Llc | 503.035 | 2,42 | 12.719 | 3,63 | ||||
| 2025-08-13 | 13F | Cary Street Partners Financial Llc | 13.829 | 0,00 | 350 | 1,16 | ||||
| 2025-08-14 | 13F | 10Elms LLP | 6.850 | 705,88 | 173 | 723,81 | ||||
| 2025-07-15 | 13F | MCF Advisors LLC | 103.927 | 3,13 | 2.628 | 4,33 | ||||
| 2025-08-14 | 13F | Colony Group, LLC | 18.297 | 463 | ||||||
| 2025-07-22 | 13F | Penobscot Investment Management Company, Inc. | 12.000 | 3,45 | 303 | 4,84 | ||||
| 2025-08-14 | 13F | Raymond James Financial Inc | 283.880 | -58,33 | 7.178 | -57,84 | ||||
| 2025-08-14 | 13F | Stifel Financial Corp | 53.484 | -75,37 | 1.352 | -75,08 | ||||
| 2025-08-13 | 13F | Flow Traders U.s. Llc | 62.965 | 89,60 | 2 | |||||
| 2025-08-27 | NP | Mason Capital Fund Trust - Fundamentals First ETF | 1.992 | 0,00 | 50 | 2,04 | ||||
| 2025-07-10 | 13F | Wealth Enhancement Advisory Services, Llc | 39.199 | 3,83 | 986 | 4,45 | ||||
| 2025-07-02 | 13F | Michael S. Ryan, Inc. | 205.163 | 2,08 | 5.188 | 3,29 | ||||
| 2025-07-29 | 13F | Accretive Wealth Partners, LLC | 7.984 | 202 | ||||||
| 2025-08-07 | 13F | Rossmore Private Capital | 41.618 | 1.052 | ||||||
| 2025-07-30 | 13F | Princeton Global Asset Management LLC | 28.179 | -0,28 | 712 | 0,85 | ||||
| 2025-08-14 | 13F | Hancock Whitney Corp | 203.710 | 5.151 | ||||||
| 2025-07-11 | 13F | Adirondack Trust Co | 55.257 | 15,10 | 1.397 | 16,43 | ||||
| 2025-07-25 | 13F | We Are One Seven, LLC | 11.745 | 13,14 | 297 | 14,29 | ||||
| 2025-08-11 | 13F | Brown Brothers Harriman & Co | 7.599 | 192 | ||||||
| 2025-07-09 | 13F | Krilogy Financial LLC | 192.598 | 2,04 | 4.870 | 3,24 | ||||
| 2025-07-01 | 13F | Confluence Investment Management Llc | 401.503 | -1,46 | 10.152 | -0,28 | ||||
| 2025-08-25 | 13F/A | Neuberger Berman Group LLC | 126.635 | 0,48 | 3.202 | 1,65 | ||||
| 2025-08-01 | 13F | Rossby Financial, LCC | 496 | 13 | ||||||
| 2025-07-30 | 13F | Klingman & Associates, LLC | 514.089 | 30,66 | 12.999 | 32,20 | ||||
| 2025-08-01 | 13F | James Investment Research Inc | 14.068 | 0,00 | 356 | 1,14 | ||||
| 2025-07-21 | 13F | Cliftonlarsonallen Wealth Advisors, Llc | 37.009 | -2,64 | 936 | -1,48 | ||||
| 2025-07-09 | 13F | Sarver Vrooman Wealth Advisors | 7.288 | 594,10 | 184 | 607,69 | ||||
| 2025-07-23 | 13F | Fulton Breakefield Broenniman Llc | 61.099 | 264,29 | 1.545 | 268,50 | ||||
| 2025-07-23 | 13F | Arcataur Capital Management LLC | 73.685 | 16,10 | 1.863 | 17,54 | ||||
| 2025-07-29 | 13F | Lyell Wealth Management, Lp | 218.025 | 1,47 | 5.513 | 2,66 | ||||
| 2025-07-21 | 13F | Segment Wealth Management, LLC | 57.210 | 4,09 | 1.447 | 5,32 | ||||
| 2025-07-30 | 13F | Sonata Capital Group Inc | 12.000 | 0 | ||||||
| 2025-08-08 | 13F | Mv Capital Management, Inc. | 812.405 | -0,63 | 20.542 | 0,55 | ||||
| 2025-07-15 | 13F | Garrett Investment Advisors LLC | 26.620 | -76,49 | 673 | -76,21 | ||||
| 2025-07-30 | 13F | Probity Advisors, Inc. | 142.263 | 8,60 | 3.597 | 9,90 | ||||
| 2025-08-12 | 13F | O'shaughnessy Asset Management, Llc | 1 | 0 | ||||||
| 2025-08-06 | 13F | Stokes Family Office, LLC | 27.330 | 0,00 | 691 | 1,32 | ||||
| 2025-08-11 | 13F | HighTower Advisors, LLC | 445.324 | 4,72 | 11.260 | 5,96 | ||||
| 2025-07-17 | 13F/A | Capital Investment Advisors, LLC | 2.752.018 | 10,64 | 69.585 | 11,94 | ||||
| 2025-07-25 | 13F | Hemington Wealth Management | 2.590 | 0,00 | 0 | |||||
| 2025-07-29 | 13F | Koshinski Asset Management, Inc. | 8.040 | 203 | ||||||
| 2025-08-12 | 13F | Coldstream Capital Management Inc | 58.851 | 1,44 | 1.488 | 2,69 | ||||
| 2025-07-28 | 13F | Mutual Advisors, LLC | 19.541 | 0,36 | 493 | 1,65 | ||||
| 2025-08-05 | 13F | Bank Of Montreal /can/ | 0 | -100,00 | 0 | |||||
| 2025-08-14 | 13F/A | Rockefeller Capital Management L.P. | 504.136 | -2,26 | 12.747 | -1,10 | ||||
| 2025-08-15 | 13F | Kestra Advisory Services, LLC | 79.248 | 6,58 | 2.004 | 7,80 | ||||
| 2025-07-29 | 13F | Sigma Investment Counselors Inc | 1.316.078 | 3,23 | 33.277 | 4,45 | ||||
| 2025-08-07 | 13F | Addison Advisors LLC | 16.668 | 72,49 | 421 | 74,69 | ||||
| 2025-07-18 | 13F | Truist Financial Corp | 9.203 | 233 | ||||||
| 2025-07-09 | 13F | Beacon Financial Group | 30.280 | 19,43 | 766 | 20,85 | ||||
| 2025-04-22 | 13F | Mendota Financial Group, LLC | 0 | -100,00 | 0 | |||||
| 2025-08-11 | 13F | Dorsey & Whitney Trust CO LLC | 16.000 | 0,00 | 405 | 1,25 | ||||
| 2025-05-14 | 13F | Susquehanna International Group, Llp | 0 | -100,00 | 0 | |||||
| 2025-07-17 | 13F | Venture Visionary Partners LLC | 56.824 | -30,99 | 1.437 | -30,19 | ||||
| 2025-08-12 | 13F | J.w. Cole Advisors, Inc. | 36.041 | 911 | ||||||
| 2025-07-24 | 13F | Us Bancorp \de\ | 758.407 | 16,65 | 19.176 | 18,03 | ||||
| 2025-08-08 | 13F | Advisors Capital Management, LLC | 297.883 | 7.532 | ||||||
| 2025-08-14 | 13F | Integrated Wealth Concepts LLC | 20.903 | 24,93 | 529 | 26,32 | ||||
| 2025-07-17 | 13F | Janney Montgomery Scott LLC | 317.816 | 6,33 | 8 | 14,29 | ||||
| 2025-08-01 | 13F | Signature Wealth Management Group | 155.922 | 2,75 | 3.942 | 3,96 | ||||
| 2025-07-31 | 13F | United Community Bank | 1.570 | 96,25 | 40 | 105,26 | ||||
| 2025-08-12 | 13F | Jacobi Capital Management LLC | 18.233 | 6,79 | 461 | 8,22 | ||||
| 2025-07-09 | 13F | Lbmc Investment Advisors, Llc | 43.495 | 1.100 | ||||||
| 2025-07-08 | 13F | Little House Capital Llc | 45.234 | -0,14 | 1.144 | 0,97 |