Grundlæggende statistik
| Institutionelle ejere | 121 total, 121 long only, 0 short only, 0 long/short - change of 3,42% MRQ |
| Gennemsnitlig porteføljeallokering | 1.3904 % - change of -12,49% MRQ |
| Institutionelle aktier (lange) | 59.789.217 (ex 13D/G) - change of 0,17MM shares 0,29% MRQ |
| Institutionel værdi (lang) | $ 1.966.454 USD ($1000) |
Institutionelt ejerskab og aktionærer
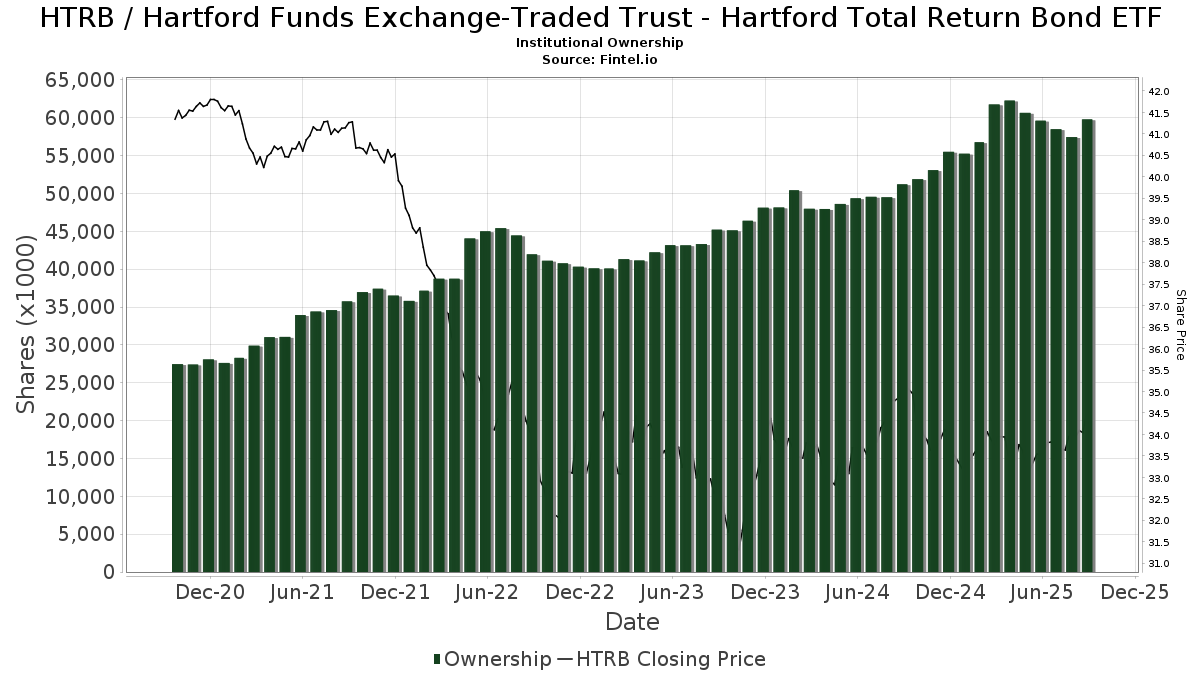
Hartford Funds Exchange-Traded Trust - Hartford Total Return Bond ETF (US:HTRB) har 121 institutionelle ejere og aktionærer, der har indsendt 13D/G- eller 13F-formularer til Securities Exchange Commission (SEC). Disse institutioner har i alt 59,789,217 aktier. Største aktionærer omfatter Hartford Funds Management Co LLC, HCKAX - THE HARTFORD CHECKS AND BALANCES FUND Class A, Northwestern Mutual Wealth Management Co, Wealth Enhancement Advisory Services, Llc, HB Wealth Management, LLC, Bank Of America Corp /de/, HighTower Advisors, LLC, UBS Group AG, Raymond James Financial Inc, and LPL Financial LLC .
Hartford Funds Exchange-Traded Trust - Hartford Total Return Bond ETF (ARCA:HTRB) institutionel ejerskabsstruktur viser aktuelle positioner i virksomheden efter institutioner og fonde, samt seneste ændringer i positionsstørrelse. Større aktionærer kan omfatte individuelle investorer, investeringsforeninger, hedgefonde eller institutioner. Skema 13D angiver, at investoren besidder (eller besidder) mere end 5 % af virksomheden og har til hensigt (eller har til hensigt at) aktivt at forfølge en ændring i forretningsstrategi. Skema 13G indikerer en passiv investering på over 5%.
The share price as of September 17, 2025 is 34,52 / share. Previously, on September 18, 2024, the share price was 35,16 / share. This represents a decline of 1,82% over that period.
Fondens stemningsscore
Fund Sentiment Score (fka Ownership Accumulation Score) finder de aktier, der bliver mest købt af fonde. Det er resultatet af en sofistikeret, multi-faktor kvantitativ model, der identificerer virksomheder med de højeste niveauer af institutionel akkumulering. Scoringsmodellen bruger en kombination af den samlede stigning i oplyste ejere, ændringerne i porteføljeallokeringer i disse ejere og andre målinger. Tallet går fra 0 til 100, hvor højere tal indikerer et højere niveau af akkumulering for sine jævnaldrende, og 50 er gennemsnittet.
Opdateringsfrekvens: Dagligt
Se Ownership Explorer, som giver en liste over højest rangerende virksomheder.
Institutionel Put/Call-forhold
Ud over at indberette standardaktie- og gældsudstedelser skal institutter med mere end 100 mill. aktiver under forvaltning også oplyse deres put- og call-optionsbeholdninger. Da salgsoptioner generelt indikerer negativ stemning, og købsoptioner indikerer positiv stemning, kan vi få en fornemmelse af den overordnede institutionelle stemning ved at plotte forholdet mellem put og kald. Diagrammet til højre viser det historiske put/call-forhold for dette instrument.
Brug af Put/Call Ratio som en indikator for investorernes stemning overvinder en af de vigtigste mangler ved at bruge totalt institutionelt ejerskab, som er, at en betydelig mængde af aktiver under forvaltning investeres passivt for at spore indekser. Passivt forvaltede fonde køber typisk ikke optioner, så indikatoren for put/call-forholdet følger mere nøje følelsen af aktivt forvaltede fonde.

13F og NPORT arkivering
Detaljer om 13F-arkivering er gratis. Detaljer om NP-ansøgninger kræver et premium-medlemskab. Grønne rækker angiver nye positioner. Røde rækker angiver lukkede positioner. Klik på linket ikon for at se den fulde transaktionshistorik.
Opgrader
for at låse premium-data op og eksportere til Excel ![]() .
.
| Fil dato | Kilde | Investor | Type | Gennemsnitlig pris (Øst) |
Aktier | Δ Aktier (%) |
Rapporteret Værdi ($1000) |
Δ Værdi (%) |
Port Alloc (%) |
|
|---|---|---|---|---|---|---|---|---|---|---|
| 2025-08-14 | 13F | CoreCap Advisors, LLC | 811 | -12,13 | 27 | -12,90 | ||||
| 2025-07-09 | 13F | Inspirion Wealth Advisors, Llc | 20.988 | 0,02 | 711 | 0,00 | ||||
| 2025-08-15 | 13F | Keel Point, LLC | 16.048 | 37,07 | 544 | 37,12 | ||||
| 2025-08-14 | 13F | Visionary Wealth Advisors | 0 | -100,00 | 0 | |||||
| 2025-04-21 | 13F | Hartford Financial Management Inc. | 0 | -100,00 | 0 | |||||
| 2025-08-06 | 13F | Golden State Wealth Management, LLC | 45.407 | -2,25 | 1.538 | -2,23 | ||||
| 2025-04-28 | 13F | First Horizon Advisors, Inc. | 0 | -100,00 | 0 | -100,00 | ||||
| 2025-07-22 | 13F | Simplicity Wealth,LLC | 39.024 | 90,44 | 1.322 | 90,62 | ||||
| 2025-07-02 | 13F | Howard Financial Services, Ltd. | 885.861 | 2,01 | 30.004 | 2,04 | ||||
| 2025-07-22 | 13F | Berger Financial Group, Inc | 834.880 | 5,91 | 28.277 | 5,94 | ||||
| 2025-07-29 | 13F | Private Trust Co Na | 1.721 | -62,13 | 58 | -62,09 | ||||
| 2025-08-14 | 13F | UBS Group AG | 1.474.973 | 1,94 | 49.957 | 1,98 | ||||
| 2025-08-14 | 13F | Comerica Bank | 11.128 | 0,00 | 377 | 0,00 | ||||
| 2025-08-14 | 13F | Hrt Financial Lp | 11.166 | 0 | ||||||
| 2025-04-28 | 13F | Great Point Wealth Advisors, LLC | 532.731 | 27,79 | 18.038 | 29,83 | ||||
| 2025-07-24 | 13F | MSH Capital Advisors LLC | 32.085 | -0,42 | 1.087 | -0,37 | ||||
| 2025-08-08 | 13F | CFO4Life Group, LLC | 120.132 | -1,73 | 4.069 | -1,72 | ||||
| 2025-07-01 | 13F | Stonehearth Capital Management, LLC | 9.021 | 0,19 | 306 | 0,33 | ||||
| 2025-07-23 | 13F | Laraway Financial Inc | 36.000 | -2,37 | 1.219 | -2,32 | ||||
| 2025-08-12 | 13F | Financial Advocates Investment Management | 127.242 | 28,96 | 4.310 | 29,01 | ||||
| 2025-08-13 | 13F | Victory Financial Group, Llc | 17.010 | -8,16 | 576 | -8,13 | ||||
| 2025-08-07 | 13F | Prairieview Wealth Partners, Llc | 24.034 | 814 | ||||||
| 2025-08-14 | 13F | Stifel Financial Corp | 134.243 | 449,64 | 4.547 | 450,36 | ||||
| 2025-07-28 | 13F | BRYN MAWR TRUST Co | 5.960 | 0,00 | 202 | 0,00 | ||||
| 2025-08-08 | 13F | Glassman Wealth Services | 3.687 | 0,00 | 125 | 0,00 | ||||
| 2025-08-07 | 13F | Brio Consultants, LLC | 462.523 | 2,25 | 15.666 | 2,29 | ||||
| 2025-07-17 | 13F | HB Wealth Management, LLC | 1.786.415 | -8,48 | 60.506 | -8,45 | ||||
| 2025-08-13 | 13F | Baird Financial Group, Inc. | 85.517 | -3,04 | 2.896 | -3,01 | ||||
| 2025-07-10 | 13F | Sovran Advisors, LLC | 22.659 | 69,50 | 762 | 70,25 | ||||
| 2025-07-25 | 13F | Prostatis Group LLC | 201.469 | 9,71 | 6.824 | 9,75 | ||||
| 2025-05-12 | 13F | Founders Financial Securities Llc | 0 | -100,00 | 0 | |||||
| 2025-08-12 | 13F | Steward Partners Investment Advisory, Llc | 2.250 | 0,00 | 76 | 0,00 | ||||
| 2025-08-08 | 13F | Condor Capital Management | 372.583 | 2,48 | 12.619 | 2,52 | ||||
| 2025-08-12 | 13F | Global Retirement Partners, LLC | 3.048 | -77,76 | 103 | -77,41 | ||||
| 2025-07-16 | 13F | MBE Wealth Management, LLC | 78.856 | 3,68 | 2.671 | 3,69 | ||||
| 2025-08-13 | 13F | Jones Financial Companies Lllp | 584.116 | 19,55 | 19.708 | 19,37 | ||||
| 2025-07-29 | 13F | Mountain Capital Investment Advisors, Inc | 1.103.642 | 12,15 | 37.369 | 12,99 | ||||
| 2025-07-17 | 13F | Janney Montgomery Scott LLC | 11.500 | -8,00 | 0 | |||||
| 2025-08-13 | 13F | Flow Traders U.s. Llc | 6.217 | -62,18 | 0 | |||||
| 2025-09-04 | 13F/A | Advisor Group Holdings, Inc. | 89.942 | 152,80 | 3.046 | 152,99 | ||||
| 2025-07-18 | 13F | Truist Financial Corp | 447.939 | -2,57 | 15.172 | -2,54 | ||||
| 2025-08-08 | 13F | Kingsview Wealth Management, LLC | 57.260 | 41,85 | 1.939 | 41,95 | ||||
| 2025-07-14 | 13F | AdvisorNet Financial, Inc | 533 | 0,00 | 18 | 0,00 | ||||
| 2025-08-12 | 13F | LPL Financial LLC | 1.205.043 | -2,67 | 40.815 | -2,64 | ||||
| 2025-08-11 | 13F | Private Advisor Group, LLC | 294.891 | -21,64 | 9.988 | -21,62 | ||||
| 2025-08-26 | 13F/A | Thrivent Financial For Lutherans | 1.030.846 | 35 | ||||||
| 2025-07-25 | 13F | Concurrent Investment Advisors, LLC | 6.352 | -9,50 | 215 | -9,28 | ||||
| 2025-07-10 | 13F | Atticus Wealth Management, Llc | 352.805 | 3,72 | 11.949 | 3,75 | ||||
| 2025-08-14 | 13F | Bank Of America Corp /de/ | 1.774.144 | 5,06 | 60.090 | 5,09 | ||||
| 2025-07-22 | 13F | Strid Group, LLC | 165.332 | 6,21 | 5.600 | 6,24 | ||||
| 2025-08-11 | 13F | United Advisor Group, LLC | 101.486 | 379,11 | 3.437 | 379,36 | ||||
| 2025-08-14 | 13F | Susquehanna International Group, Llp | 46.877 | 591,50 | 1.588 | 593,01 | ||||
| 2025-07-17 | 13F | Montis Financial, LLC | 12.675 | -20,56 | 429 | -20,56 | ||||
| 2025-08-14 | 13F | GWM Advisors LLC | 224.569 | 7,40 | 7.606 | 7,44 | ||||
| 2025-08-07 | 13F | Kestra Private Wealth Services, Llc | 28.935 | 177,82 | 980 | 178,41 | ||||
| 2025-07-31 | 13F | Cambridge Investment Research Advisors, Inc. | 12.928 | 0,29 | 0 | |||||
| 2025-07-10 | 13F | Marshall Financial Group LLC | 120.639 | -80,89 | 4.057 | -81,02 | ||||
| 2025-07-22 | 13F | DAVENPORT & Co LLC | 84.325 | 0,16 | 2.856 | 0,21 | ||||
| 2025-05-06 | 13F | Fpc Investment Advisory, Inc. | 0 | -100,00 | 0 | |||||
| 2025-08-04 | 13F | Barnes Dennig Private Wealth Management LLC | 4.172 | 141 | ||||||
| 2025-08-13 | 13F | Northwestern Mutual Wealth Management Co | 2.144.802 | 116,71 | 72.644 | 116,78 | ||||
| 2025-05-12 | 13F | Fmr Llc | 0 | -100,00 | 0 | |||||
| 2025-07-28 | 13F | Kiker Wealth Management, LLC | 0 | -100,00 | 0 | |||||
| 2025-07-31 | 13F | Richards, Merrill & Peterson, Inc. | 0 | -100,00 | 0 | |||||
| 2025-08-15 | 13F | Captrust Financial Advisors | 476.690 | 109,71 | 16.146 | 109,78 | ||||
| 2025-08-01 | 13F | Envestnet Asset Management Inc | 523.182 | -0,53 | 17.720 | -0,50 | ||||
| 2025-08-04 | 13F | Spire Wealth Management | 672.078 | -12,74 | 22.623 | -13,25 | ||||
| 2025-08-12 | 13F | Proequities, Inc. | 0 | 0 | ||||||
| 2025-08-14 | 13F | Smartleaf Asset Management LLC | 3.582 | 121 | ||||||
| 2025-08-15 | 13F | Kestra Advisory Services, LLC | 8.373 | 284 | ||||||
| 2025-08-04 | 13F | Atria Investments Llc | 57.326 | 1.942 | ||||||
| 2025-08-14 | 13F | Mariner, LLC | 123.517 | -14,09 | 4.184 | -14,07 | ||||
| 2025-05-07 | 13F | WMS Partners, LLC | 0 | -100,00 | 0 | |||||
| 2025-08-07 | 13F | Allworth Financial LP | 10.510 | -7,72 | 356 | -7,07 | ||||
| 2025-07-25 | 13F | Cwm, Llc | 7.247 | -31,21 | 0 | |||||
| 2025-08-08 | 13F | Pnc Financial Services Group, Inc. | 296 | 10 | ||||||
| 2025-08-14 | 13F | Jane Street Group, Llc | 271.638 | 98,66 | 9.200 | 98,75 | ||||
| 2025-07-07 | 13F | Investors Research Corp | 876 | 0,00 | 30 | 0,00 | ||||
| 2025-08-04 | 13F | Creative Financial Designs Inc /adv | 2.710 | 1,84 | 92 | 1,11 | ||||
| 2025-07-09 | 13F | Fragasso Group Inc. | 738.126 | -16,15 | 25.000 | -16,13 | ||||
| 2025-08-15 | 13F | First Heartland Consultants, Inc. | 130.195 | 2.003,65 | 4.410 | 2.009,57 | ||||
| 2025-05-12 | 13F | Tranquilli Financial Advisor LLC | 0 | -100,00 | 0 | |||||
| 2025-06-26 | NP | HCKAX - THE HARTFORD CHECKS AND BALANCES FUND Class A | 12.906.627 | -8,28 | 435.728 | -7,32 | ||||
| 2025-08-14 | 13F | Freedom Financial Partners LLC | 109.887 | 4,33 | 3.722 | 4,35 | ||||
| 2025-07-08 | 13F | Advance Capital Management, Inc. | 487.095 | 9,12 | 16.498 | 9,15 | ||||
| 2025-08-08 | 13F | Larson Financial Group LLC | 2.903 | 1,11 | 98 | 1,03 | ||||
| 2025-07-30 | 13F | Rehmann Capital Advisory Group | 429.178 | 2,68 | 14.536 | 2,71 | ||||
| 2025-07-10 | 13F | Wealth Enhancement Advisory Services, Llc | 1.815.048 | -2,17 | 61.222 | -2,55 | ||||
| 2025-07-14 | 13F | Strategic Planning Group, Llc | 175.818 | 0,99 | 5.955 | 1,02 | ||||
| 2025-04-18 | 13F | Wolf Group Capital Advisors | 40.597 | 1.375 | ||||||
| 2025-07-25 | 13F | Iron Financial, LLC | 309.344 | -5,13 | 10.477 | -5,11 | ||||
| 2025-08-13 | 13F | Luminist Capital LLC | 16 | 1 | ||||||
| 2025-08-05 | 13F | Integrity Financial Corp /WA | 75.022 | 2.550 | ||||||
| 2025-08-13 | 13F | Congress Wealth Management LLC / DE / | 77.537 | 2.626 | ||||||
| 2025-04-21 | 13F | Envestnet Portfolio Solutions, Inc. | 0 | -100,00 | 0 | |||||
| 2025-04-29 | 13F | Bank of New York Mellon Corp | 0 | -100,00 | 0 | |||||
| 2025-08-08 | 13F | Cornerstone Advisors Asset Management, Inc | 976.942 | 10,29 | 33.089 | 10,33 | ||||
| 2025-07-01 | 13F | Private Client Services, Llc | 107.422 | 59,48 | 3.638 | 59,56 | ||||
| 2025-07-11 | 13F | Pinnacle Bancorp, Inc. | 20 | 0,00 | 1 | |||||
| 2025-04-09 | 13F | Merit Financial Group, LLC | 0 | -100,00 | 0 | -100,00 | ||||
| 2025-08-07 | 13F | CENTRAL TRUST Co | 66.931 | 8,00 | 2.267 | 8,01 | ||||
| 2025-08-07 | 13F | Resources Investment Advisors, LLC. | 7.410 | -6,21 | 251 | -6,37 | ||||
| 2025-08-07 | 13F | Sanchez Wealth Management Group | 285.228 | 3,58 | 9.661 | 3,61 | ||||
| 2025-05-13 | 13F | Equitable Holdings, Inc. | 0 | -100,00 | 0 | |||||
| 2025-05-28 | 13F | Intrua Financial, LLC | 0 | -100,00 | 0 | -100,00 | ||||
| 2025-08-14 | 13F | Wiley Bros.-aintree Capital, Llc | 37.149 | 27,62 | 1.258 | 27,98 | ||||
| 2025-08-04 | 13F | Assetmark, Inc | 67 | 0,00 | 2 | 0,00 | ||||
| 2025-07-25 | 13F | Clarendon Private LLC | 11.693 | 4,12 | 396 | 4,21 | ||||
| 2025-07-31 | 13F | Kathleen S. Wright Associates Inc. | 102.419 | 3,09 | 3.469 | 3,12 | ||||
| 2025-08-06 | 13F | Commonwealth Equity Services, Llc | 594.956 | -9,49 | 20 | -9,09 | ||||
| 2025-07-08 | 13F | Apella Capital, LLC | 11.754 | 395 | ||||||
| 2025-05-08 | 13F | Us Bancorp \de\ | 0 | -100,00 | 0 | |||||
| 2025-08-14 | 13F | Catalyst Financial Partners Llc | 563.908 | 8,71 | 19.100 | 8,74 | ||||
| 2025-08-14 | 13F | Royal Bank Of Canada | 177.468 | 4,46 | 6.011 | 4,48 | ||||
| 2025-08-14 | 13F | Horizon Investments, LLC | 0 | -100,00 | 0 | |||||
| 2025-07-25 | 13F | Atria Wealth Solutions, Inc. | 17.210 | -41,22 | 585 | -41,25 | ||||
| 2025-08-14 | 13F | Wells Fargo & Company/mn | 5.454 | -23,87 | 185 | -23,97 | ||||
| 2025-04-23 | 13F | Golden State Equity Partners | 0 | -100,00 | 0 | |||||
| 2025-08-11 | 13F | HighTower Advisors, LLC | 1.681.781 | -0,20 | 56.962 | -0,17 | ||||
| 2025-08-14 | 13F | Citadel Advisors Llc | 115.617 | -43,07 | 3.916 | -43,06 | ||||
| 2025-07-15 | 13F | Legacy Solutions, Llc | 73.107 | 1,75 | 2.476 | 1,81 | ||||
| 2025-08-12 | 13F | MAI Capital Management | 10.517 | 0,01 | 356 | 0,00 | ||||
| 2025-08-14 | 13F | Old Mission Capital Llc | 19.388 | -60,03 | 657 | -60,05 | ||||
| 2025-07-10 | 13F | Park Capital Management, LLC / WI | 879.096 | 2,20 | 29.775 | 2,23 | ||||
| 2025-08-12 | 13F | Jpmorgan Chase & Co | 235.159 | 205,93 | 7.965 | 206,07 | ||||
| 2025-05-01 | 13F | High Note Wealth, LLC | 0 | -100,00 | 0 | |||||
| 2025-04-29 | NP | AIHAX - Horizon Active Income Fund Advisor Class | 347.926 | 1,18 | 11.847 | 1,17 | ||||
| 2025-08-05 | 13F | Westside Investment Management, Inc. | 23.200 | 0,00 | 786 | 0,00 | ||||
| 2025-08-11 | 13F | NewEdge Wealth, LLC | 0 | -100,00 | 0 | |||||
| 2025-08-14 | 13F | Integrated Wealth Concepts LLC | 87.906 | 22,89 | 2.977 | 22,91 | ||||
| 2025-08-06 | 13F | Bensler, LLC | 463.109 | -11,50 | 15.686 | -11,47 | ||||
| 2025-08-14 | 13F | Gotham Asset Management, LLC | 35.093 | -2,72 | 1.189 | -2,70 | ||||
| 2025-08-13 | 13F/A | Hartford Funds Management Co LLC | 13.845.655 | 1,49 | 468.952 | 1,52 | ||||
| 2025-07-24 | 13F | IFP Advisors, Inc | 45 | 0,00 | 2 | 0,00 | ||||
| 2025-07-10 | 13F | Tompkins Financial Corp | 0 | -100,00 | 0 | |||||
| 2025-08-08 | 13F | Cetera Investment Advisers | 158.637 | 2,45 | 5.373 | 2,48 | ||||
| 2025-08-13 | 13F | Capital Analysts, Inc. | 83 | 1,22 | 0 | |||||
| 2025-08-14 | 13F | Raymond James Financial Inc | 1.434.644 | -1,17 | 48.591 | -1,14 | ||||
| 2025-07-28 | 13F | Harbour Investments, Inc. | 1.261 | 0,00 | 43 | 0,00 | ||||
| 2025-08-13 | 13F | WCG Wealth Advisors LLC | 614.209 | -24,64 | 20.803 | -24,62 | ||||
| 2025-08-15 | 13F | Morgan Stanley | 3.054 | 76.250,00 | 103 | |||||
| 2025-07-09 | 13F | Fermata Advisors, LLC | 11.301 | -1,02 | 383 | -1,04 | ||||
| 2025-08-14 | 13F/A | Rockefeller Capital Management L.P. | 15.538 | 0,19 | 526 | 0,19 |