Grundlæggende statistik
| Institutionelle ejere | 93 total, 93 long only, 0 short only, 0 long/short - change of 12,05% MRQ |
| Gennemsnitlig porteføljeallokering | 1.0844 % - change of 7,55% MRQ |
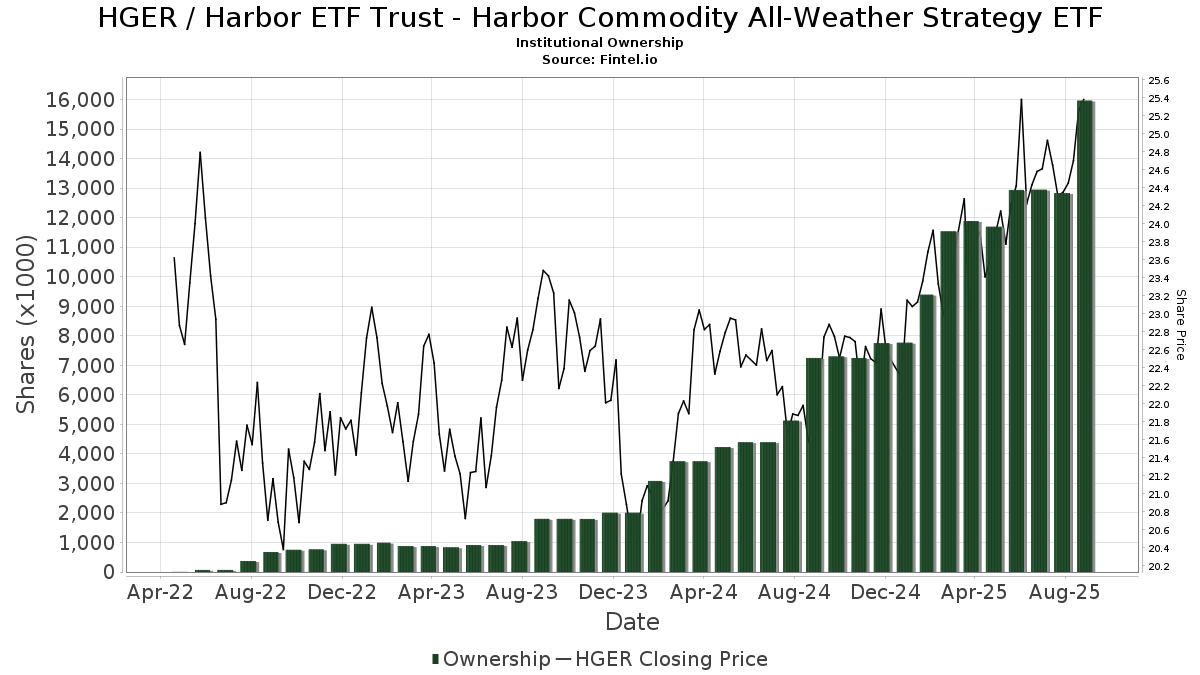
| Institutionelle aktier (lange) | 15.965.223 (ex 13D/G) - change of 3,03MM shares 23,38% MRQ |
| Institutionel værdi (lang) | $ 337.398 USD ($1000) |
Institutionelt ejerskab og aktionærer
Harbor ETF Trust - Harbor Commodity All-Weather Strategy ETF (US:HGER) har 93 institutionelle ejere og aktionærer, der har indsendt 13D/G- eller 13F-formularer til Securities Exchange Commission (SEC). Disse institutioner har i alt 15,965,223 aktier. Største aktionærer omfatter Raymond James Financial Inc, Great Lakes Advisors, Llc, Horizon Advisory Services, Inc., Synovus Financial Corp, New Harbor Financial Group, LLC, Bank Of America Corp /de/, Commonwealth Equity Services, Llc, 3EDGE Asset Management, LP, EDGH - 3EDGE Dynamic Hard Assets ETF, and Inspirion Wealth Advisors, Llc .
Harbor ETF Trust - Harbor Commodity All-Weather Strategy ETF (NYSE:HGER) institutionel ejerskabsstruktur viser aktuelle positioner i virksomheden efter institutioner og fonde, samt seneste ændringer i positionsstørrelse. Større aktionærer kan omfatte individuelle investorer, investeringsforeninger, hedgefonde eller institutioner. Skema 13D angiver, at investoren besidder (eller besidder) mere end 5 % af virksomheden og har til hensigt (eller har til hensigt at) aktivt at forfølge en ændring i forretningsstrategi. Skema 13G indikerer en passiv investering på over 5%.
The share price as of September 12, 2025 is 25,41 / share. Previously, on September 13, 2024, the share price was 21,85 / share. This represents an increase of 16,29% over that period.
Fondens stemningsscore
Fund Sentiment Score (fka Ownership Accumulation Score) finder de aktier, der bliver mest købt af fonde. Det er resultatet af en sofistikeret, multi-faktor kvantitativ model, der identificerer virksomheder med de højeste niveauer af institutionel akkumulering. Scoringsmodellen bruger en kombination af den samlede stigning i oplyste ejere, ændringerne i porteføljeallokeringer i disse ejere og andre målinger. Tallet går fra 0 til 100, hvor højere tal indikerer et højere niveau af akkumulering for sine jævnaldrende, og 50 er gennemsnittet.
Opdateringsfrekvens: Dagligt
Se Ownership Explorer, som giver en liste over højest rangerende virksomheder.
Institutionel Put/Call-forhold
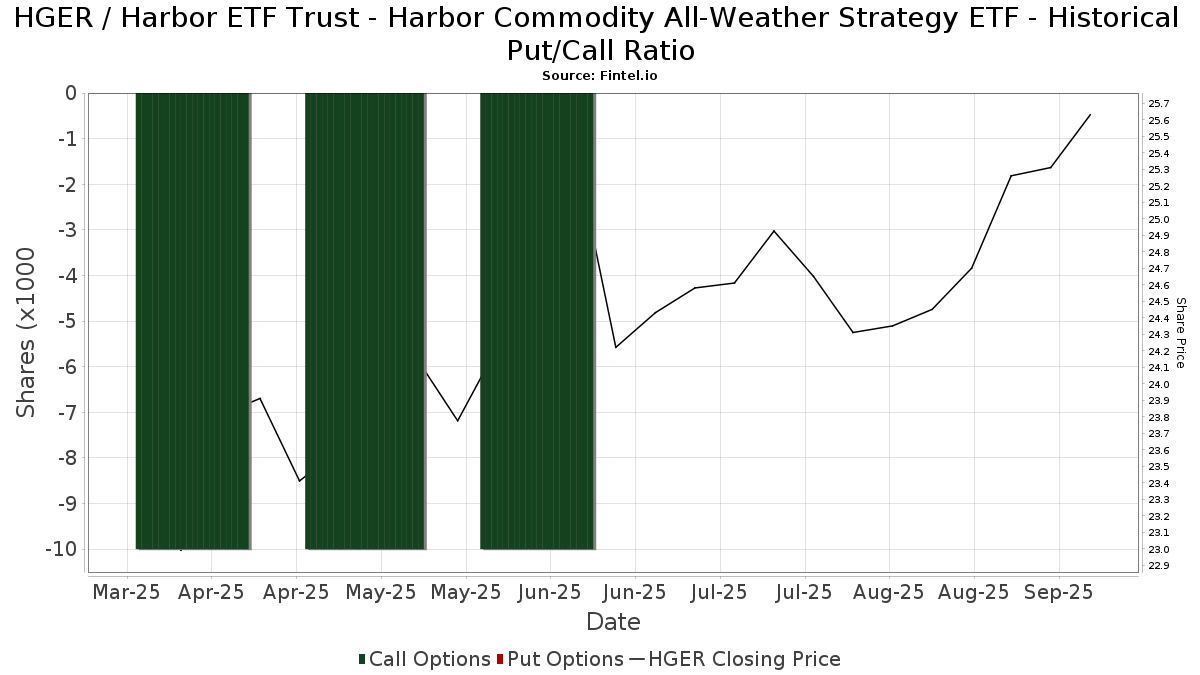
Ud over at indberette standardaktie- og gældsudstedelser skal institutter med mere end 100 mill. aktiver under forvaltning også oplyse deres put- og call-optionsbeholdninger. Da salgsoptioner generelt indikerer negativ stemning, og købsoptioner indikerer positiv stemning, kan vi få en fornemmelse af den overordnede institutionelle stemning ved at plotte forholdet mellem put og kald. Diagrammet til højre viser det historiske put/call-forhold for dette instrument.
Brug af Put/Call Ratio som en indikator for investorernes stemning overvinder en af de vigtigste mangler ved at bruge totalt institutionelt ejerskab, som er, at en betydelig mængde af aktiver under forvaltning investeres passivt for at spore indekser. Passivt forvaltede fonde køber typisk ikke optioner, så indikatoren for put/call-forholdet følger mere nøje følelsen af aktivt forvaltede fonde.
13F og NPORT arkivering
Detaljer om 13F-arkivering er gratis. Detaljer om NP-ansøgninger kræver et premium-medlemskab. Grønne rækker angiver nye positioner. Røde rækker angiver lukkede positioner. Klik på linket ikon for at se den fulde transaktionshistorik.
Opgrader
for at låse premium-data op og eksportere til Excel ![]() .
.
| Fil dato | Kilde | Investor | Type | Gennemsnitlig pris (Øst) |
Aktier | Δ Aktier (%) |
Rapporteret Værdi ($1000) |
Δ Værdi (%) |
Port Alloc (%) |
|
|---|---|---|---|---|---|---|---|---|---|---|
| 2025-07-09 | 13F | Inspirion Wealth Advisors, Llc | 566.484 | 3,41 | 13.760 | 4,44 | ||||
| 2025-07-15 | 13F | Mather Group, Llc. | 0 | -100,00 | 0 | |||||
| 2025-08-14 | 13F | Advisor OS, LLC | 10.436 | 0,00 | 253 | 1,20 | ||||
| 2025-08-01 | 13F | Advisory Alpha, LLC | 16.268 | -2,73 | 395 | -1,74 | ||||
| 2025-08-01 | 13F | Envestnet Asset Management Inc | 136.353 | 62,38 | 3.312 | 64,04 | ||||
| 2025-07-11 | 13F | Farther Finance Advisors, LLC | 166 | 4 | ||||||
| 2025-05-13 | 13F | UBS Group AG | 0 | -100,00 | 0 | |||||
| 2025-08-12 | 13F | Twin Focus Capital Partners, Llc | 55.500 | 1.348 | ||||||
| 2025-08-12 | 13F | OneAscent Financial Services LLC | 50.986 | -14,92 | 1 | 0,00 | ||||
| 2025-08-04 | 13F | Arkadios Wealth Advisors | 192.994 | -6,69 | 4.688 | -5,77 | ||||
| 2025-07-18 | 13F | Vicus Capital | 25.284 | 47,23 | 614 | 48,67 | ||||
| 2025-08-12 | 13F | Global Retirement Partners, LLC | 2.069 | 50 | ||||||
| 2025-08-06 | 13F | OneAscent Family Office, LLC | 12.539 | 24,44 | 0 | |||||
| 2025-08-14 | 13F | Comerica Bank | 60 | 0,00 | 1 | 0,00 | ||||
| 2025-07-28 | 13F | Kiker Wealth Management, LLC | 1.713 | -40,15 | 42 | -39,71 | ||||
| 2025-07-28 | 13F | SFG Wealth Management, LLC. | 0 | -100,00 | 0 | |||||
| 2025-08-11 | 13F | Trajan Wealth LLC | 14.927 | -16,26 | 363 | -15,42 | ||||
| 2025-08-12 | 13F | Proequities, Inc. | 0 | 0 | ||||||
| 2025-07-15 | 13F | Sheets Smith Wealth Management | 10.330 | 251 | ||||||
| 2025-07-15 | 13F | Palumbo Wealth Management LLC | 0 | -100,00 | 0 | |||||
| 2025-08-06 | 13F | OneAscent Wealth Management LLC | 19.656 | -5,90 | 0 | |||||
| 2025-08-11 | 13F | Great Lakes Advisors, Llc | 1.159.518 | -5,77 | 28.165 | -4,83 | ||||
| 2025-08-13 | 13F | Flow Traders U.s. Llc | 34.005 | 91,23 | 1 | |||||
| 2025-07-18 | 13F | Centricity Wealth Management, LLC | 847 | 21 | ||||||
| 2025-08-06 | 13F | Nvwm, Llc | 91.715 | 36,63 | 2.228 | 37,98 | ||||
| 2025-07-14 | 13F | Matrix Trust Co | 5.943 | -77,22 | 0 | |||||
| 2025-07-15 | 13F | Garrett Investment Advisors LLC | 15.766 | 2,21 | 383 | 3,24 | ||||
| 2025-08-05 | 13F | Prosperity Consulting Group, LLC | 0 | -100,00 | 0 | |||||
| 2025-07-31 | 13F | Cambridge Investment Research Advisors, Inc. | 270.895 | 12,03 | 7 | 20,00 | ||||
| 2025-08-14 | 13F | Planwiser Financial, Llc | 115.079 | 12,60 | 2.854 | 18,28 | ||||
| 2025-07-17 | 13F | Janney Montgomery Scott LLC | 329.652 | 0,63 | 8 | 14,29 | ||||
| 2025-08-14 | 13F | Susquehanna International Group, Llp | 15.377 | 374 | ||||||
| 2025-08-14 | 13F | GWM Advisors LLC | 420 | 10 | ||||||
| 2025-08-13 | 13F | Continuum Advisory, LLC | 0 | -100,00 | 0 | |||||
| 2025-09-04 | 13F/A | Advisor Group Holdings, Inc. | 62.673 | -43,25 | 1.522 | -42,67 | ||||
| 2025-08-13 | 13F | Virtue Capital Management, LLC | 0 | -100,00 | 0 | |||||
| 2025-08-11 | 13F | Private Advisor Group, LLC | 377.649 | 32,40 | 9.173 | 33,74 | ||||
| 2025-08-14 | 13F | Great Valley Advisor Group, Inc. | 183.841 | 4.465 | ||||||
| 2025-07-18 | 13F | Truist Financial Corp | 78.862 | 191,13 | 1.916 | 194,16 | ||||
| 2025-08-14 | 13F | Bank Of America Corp /de/ | 901.163 | 21.889 | ||||||
| 2025-07-01 | 13F | Harbor Investment Advisory, Llc | 61.782 | 23,05 | 1.501 | 24,28 | ||||
| 2025-08-11 | 13F | Perennial Investment Advisors, LLC | 144.876 | 10,87 | 3.519 | 12,00 | ||||
| 2025-08-12 | 13F | LPL Financial LLC | 134.972 | 418,29 | 3.278 | 423,64 | ||||
| 2025-08-14 | 13F | Sagard Holdings Management Inc. | 147.462 | 3.582 | ||||||
| 2025-08-05 | 13F | Northcape Wealth Management, Llc | 45.172 | 4,41 | 1.097 | 5,48 | ||||
| 2025-08-07 | 13F | Weil Company, Inc. | 106.394 | 2.584 | ||||||
| 2025-08-13 | 13F | MONECO Advisors, LLC | 72.646 | -1,36 | 1.765 | -0,40 | ||||
| 2025-07-29 | 13F | Sowa Financial Group, Inc. | 468.161 | 114,92 | 11 | 120,00 | ||||
| 2025-07-31 | 13F | 3EDGE Asset Management, LP | 718.699 | -48,20 | 17.317 | -47,91 | ||||
| 2025-08-06 | 13F | Atlantic Union Bankshares Corp | 2.975 | 72 | ||||||
| 2025-08-15 | 13F | Morgan Stanley | 1 | -99,93 | 0 | -100,00 | ||||
| 2025-08-07 | 13F | Allworth Financial LP | 1.300 | 32 | ||||||
| 2025-05-12 | 13F | Jpmorgan Chase & Co | 0 | -100,00 | 0 | |||||
| 2025-08-13 | 13F | Townsquare Capital Llc | 0 | -100,00 | 0 | |||||
| 2025-08-13 | 13F | Certior Financial Group, Llc | 0 | -100,00 | 0 | |||||
| 2025-08-28 | NP | EDGH - 3EDGE Dynamic Hard Assets ETF | 718.299 | 75,25 | 17.447 | 77,00 | ||||
| 2025-08-04 | 13F | Pensionmark Financial Group, Llc | 40.615 | 7,94 | 987 | 9,07 | ||||
| 2025-08-01 | 13F | Belvedere Trading LLC | Call | 10.300 | 250 | |||||
| 2025-05-12 | 13F | Fiduciary Family Office, Llc | 0 | -100,00 | 0 | |||||
| 2025-08-01 | 13F | Brinker Capital Investments, LLC | 0 | -100,00 | 0 | |||||
| 2025-08-04 | 13F | Atria Investments Llc | 18.877 | -14,14 | 459 | -13,26 | ||||
| 2025-08-13 | 13F | Proactive Wealth Strategies LLC | 52.893 | 1 | ||||||
| 2025-07-22 | 13F | MBL Wealth, LLC | 143.524 | 31,75 | 3.486 | 33,10 | ||||
| 2025-08-11 | 13F | Platform Technology Partners | 73.521 | 11,99 | 1.786 | 13,12 | ||||
| 2025-08-14 | 13F | Synovus Financial Corp | 1.131.219 | 15,98 | 27.481 | 17,15 | ||||
| 2025-08-11 | 13F | NewEdge Wealth, LLC | 13.232 | 323 | ||||||
| 2025-07-16 | 13F | Twelve Points Wealth Management LLC | 76.682 | 5,32 | 1.863 | 6,34 | ||||
| 2025-07-10 | 13F | Wealth Enhancement Advisory Services, Llc | 0 | -100,00 | 0 | |||||
| 2025-08-13 | 13F | Cerity Partners LLC | 0 | -100,00 | 0 | |||||
| 2025-08-13 | 13F | Empire Financial Management Company, LLC | 151.156 | 0,44 | 3.672 | 1,44 | ||||
| 2025-08-14 | 13F | Financial Network Wealth Advisors LLC | 94 | -98,39 | 2 | -98,57 | ||||
| 2025-07-24 | 13F | Eastern Bank | 3.432 | 95,11 | 83 | 97,62 | ||||
| 2025-08-04 | 13F | Assetmark, Inc | 235 | 6 | ||||||
| 2025-08-06 | 13F | Csenge Advisory Group | 246.171 | 64,66 | 5.810 | 62,04 | ||||
| 2025-08-11 | 13F | Lake Street Financial Llc | 20.529 | 29,91 | 499 | 31,05 | ||||
| 2025-08-11 | 13F | Portside Wealth Group, LLC | 0 | -100,00 | 0 | |||||
| 2025-08-13 | 13F | New Harbor Financial Group, LLC | 1.080.982 | 1,64 | 26.257 | 2,66 | ||||
| 2025-05-15 | 13F | Grayhawk Investment Strategies Inc. | 162.782 | -14,88 | 3.915 | -7,51 | ||||
| 2025-08-12 | 13F | Steward Partners Investment Advisory, Llc | 127.161 | 533,93 | 3.089 | 540,66 | ||||
| 2025-07-24 | 13F | Us Bancorp \de\ | 421 | 0,00 | 10 | 0,00 | ||||
| 2025-08-14 | 13F | Alliance Wealth Advisors, LLC /UT | 0 | -100,00 | 0 | |||||
| 2025-08-29 | NP | OneAscent Capital Opportunities Fund | 21.425 | 96,11 | 520 | 98,47 | ||||
| 2025-08-04 | 13F | 4J Wealth Management LLC | 35.946 | 873 | ||||||
| 2025-07-15 | 13F | tru Independence LLC | 201.657 | 21,00 | 4.898 | 22,21 | ||||
| 2025-08-12 | 13F | CIBC Private Wealth Group, LLC | 9.152 | 62,21 | 222 | 79,03 | ||||
| 2025-08-05 | 13F | Carolinas Wealth Consulting Llc | 0 | -100,00 | 0 | -100,00 | ||||
| 2025-08-14 | 13F | Aprio Wealth Management, LLC | 310.802 | 7.549 | ||||||
| 2025-08-06 | 13F | Commonwealth Equity Services, Llc | 816.641 | 95,11 | 20 | 90,00 | ||||
| 2025-08-12 | 13F | MAI Capital Management | 200 | 5 | ||||||
| 2025-08-14 | 13F | Arete Wealth Advisors, LLC | 0 | -100,00 | 0 | |||||
| 2025-07-10 | 13F | Exchange Traded Concepts, Llc | 63.752 | 25,56 | 1.549 | 26,78 | ||||
| 2025-05-12 | 13F | Sandy Spring Bank | 2.975 | 9,17 | 72 | 18,33 | ||||
| 2025-07-25 | 13F | Ackerman Capital Advisors, LLC | 36.651 | 890 | ||||||
| 2025-08-11 | 13F | HighTower Advisors, LLC | 206.599 | -19,27 | 5.018 | -18,46 | ||||
| 2025-07-09 | 13F | Channel Wealth Llc | 61.197 | -32,64 | 1.486 | -31,96 | ||||
| 2025-07-17 | 13F | Worth Financial Advisory Group, LLC | 33.790 | 79,34 | 821 | 81,02 | ||||
| 2025-08-14 | 13F | IHT Wealth Management, LLC | 12.920 | -0,29 | 314 | 1,95 | ||||
| 2025-08-14 | 13F | Raymond James Financial Inc | 1.167.543 | 21,67 | 28.360 | 22,89 | ||||
| 2025-08-14 | 13F | Vident Advisory, LLC | 232.856 | 5.656 | ||||||
| 2025-07-23 | 13F | Ellsworth Advisors, LLC | 396.738 | 51,39 | 9.637 | 52,90 | ||||
| 2025-07-14 | 13F | IronOak Wealth LLC. | 61.616 | 1.497 | ||||||
| 2025-07-23 | 13F | Horizon Advisory Services, Inc. | 1.132.567 | -1,54 | 27.510 | -0,56 | ||||
| 2025-08-12 | 13F | Change Path, LLC | 18.768 | 456 | ||||||
| 2025-06-26 | NP | FARX - Frontier Asset Absolute Return ETF | 50.776 | -6,38 | 1.189 | -5,41 | ||||
| 2025-08-13 | 13F | Level Four Advisory Services, Llc | 14.577 | 354 | ||||||
| 2025-08-14 | 13F | Royal Bank Of Canada | 28.644 | 696 | ||||||
| 2025-07-28 | 13F | Harbour Investments, Inc. | 3.077 | 0,00 | 75 | 0,00 | ||||
| 2025-08-14 | 13F | Harvest Investment Services, LLC | 21.584 | 18,86 | 524 | 20,18 | ||||
| 2025-07-30 | 13F | Wallace Advisory Group, LLC | 14.688 | -5,26 | 353 | 2,92 | ||||
| 2025-08-08 | 13F | Cetera Investment Advisers | 188.236 | 11,62 | 4.572 | 12,75 | ||||
| 2025-08-14 | 13F | Jane Street Group, Llc | 26.654 | -19,78 | 647 | -19,02 | ||||
| 2025-07-24 | 13F | IFP Advisors, Inc | 67.757 | -17,03 | 1.646 | -16,20 |