Grundlæggende statistik
| Institutionelle ejere | 80 total, 80 long only, 0 short only, 0 long/short - change of 8,11% MRQ |
| Gennemsnitlig porteføljeallokering | 0.2884 % - change of 31,39% MRQ |
| Institutionelle aktier (lange) | 7.559.893 (ex 13D/G) - change of 1,30MM shares 20,73% MRQ |
| Institutionel værdi (lang) | $ 221.693 USD ($1000) |
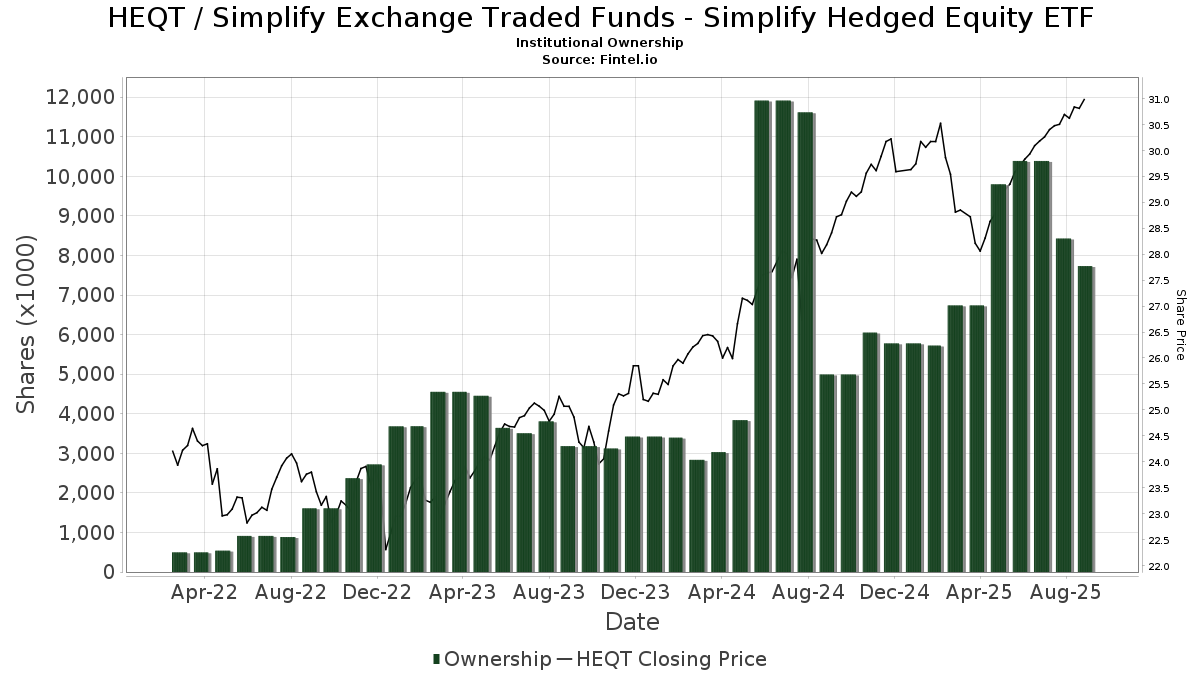
Institutionelt ejerskab og aktionærer
Simplify Exchange Traded Funds - Simplify Hedged Equity ETF (US:HEQT) har 80 institutionelle ejere og aktionærer, der har indsendt 13D/G- eller 13F-formularer til Securities Exchange Commission (SEC). Disse institutioner har i alt 7,559,893 aktier. Største aktionærer omfatter Private Advisor Group, LLC, Cwm, Llc, WealthPlan Investment Management, LLC, Keudell/Morrison Wealth Management, LPL Financial LLC, Leo Wealth, LLC, WealthPLAN Partners, LLC, Arq Wealth Advisors, Llc, Stephens Inc /ar/, and Kovack Advisors, Inc. .
Simplify Exchange Traded Funds - Simplify Hedged Equity ETF (ARCA:HEQT) institutionel ejerskabsstruktur viser aktuelle positioner i virksomheden efter institutioner og fonde, samt seneste ændringer i positionsstørrelse. Større aktionærer kan omfatte individuelle investorer, investeringsforeninger, hedgefonde eller institutioner. Skema 13D angiver, at investoren besidder (eller besidder) mere end 5 % af virksomheden og har til hensigt (eller har til hensigt at) aktivt at forfølge en ændring i forretningsstrategi. Skema 13G indikerer en passiv investering på over 5%.
The share price as of March 27, 2026 is 30,95 / share. Previously, on March 31, 2025, the share price was 28,58 / share. This represents an increase of 8,31% over that period.
Fondens stemningsscore
Fund Sentiment Score (fka Ownership Accumulation Score) finder de aktier, der bliver mest købt af fonde. Det er resultatet af en sofistikeret, multi-faktor kvantitativ model, der identificerer virksomheder med de højeste niveauer af institutionel akkumulering. Scoringsmodellen bruger en kombination af den samlede stigning i oplyste ejere, ændringerne i porteføljeallokeringer i disse ejere og andre målinger. Tallet går fra 0 til 100, hvor højere tal indikerer et højere niveau af akkumulering for sine jævnaldrende, og 50 er gennemsnittet.
Opdateringsfrekvens: Dagligt
Se Ownership Explorer, som giver en liste over højest rangerende virksomheder.
AI+ Ask Fintel’s AI assistant about Simplify Exchange Traded Funds - Simplify Hedged Equity ETF.
Select a question to share a public post with an AI-crafted answer.
Thinking of good questions…
Institutionel Put/Call-forhold
Ud over at indberette standardaktie- og gældsudstedelser skal institutter med mere end 100 mill. aktiver under forvaltning også oplyse deres put- og call-optionsbeholdninger. Da salgsoptioner generelt indikerer negativ stemning, og købsoptioner indikerer positiv stemning, kan vi få en fornemmelse af den overordnede institutionelle stemning ved at plotte forholdet mellem put og kald. Diagrammet til højre viser det historiske put/call-forhold for dette instrument.
Brug af Put/Call Ratio som en indikator for investorernes stemning overvinder en af de vigtigste mangler ved at bruge totalt institutionelt ejerskab, som er, at en betydelig mængde af aktiver under forvaltning investeres passivt for at spore indekser. Passivt forvaltede fonde køber typisk ikke optioner, så indikatoren for put/call-forholdet følger mere nøje følelsen af aktivt forvaltede fonde.
13F og NPORT arkivering
Detaljer om 13F-arkivering er gratis. Detaljer om NP-ansøgninger kræver et premium-medlemskab. Grønne rækker angiver nye positioner. Røde rækker angiver lukkede positioner. Klik på linket ikon for at se den fulde transaktionshistorik.
Opgrader
for at låse premium-data op og eksportere til Excel ![]() .
.
| Fil dato | Kilde | Investor | Type | Gennemsnitlig pris (Øst) |
Aktier | Δ Aktier (%) |
Rapporteret Værdi ($1000) |
Δ Værdi (%) |
Port Alloc (%) |
|
|---|---|---|---|---|---|---|---|---|---|---|
| 2026-01-21 | 13F | Leo Wealth, LLC | 331.506 | 10.625 | ||||||
| 2026-02-17 | 13F | Advisory Services Network, LLC | 0 | -100,00 | 0 | |||||
| 2026-02-17 | 13F | Susquehanna International Group, Llp | 0 | -100,00 | 0 | |||||
| 2026-01-23 | 13F | Financial Enhancement Group LLC | 128.133 | -1,38 | 4.128 | 1,30 | ||||
| 2026-02-12 | 13F | Steward Partners Investment Advisory, Llc | 98.622 | -24,74 | 3.161 | -22,80 | ||||
| 2026-01-21 | 13F | Cambridge Advisors Inc. | 32.539 | 3,09 | 1.043 | 5,79 | ||||
| 2026-02-06 | 13F | Keudell/Morrison Wealth Management | 517.138 | 5,57 | 16.574 | 12,60 | ||||
| 2026-01-09 | 13F | Peterson Wealth Advisors, LLC | 128.161 | -8,54 | 4.108 | -6,34 | ||||
| 2026-02-14 | 13F | Rockefeller Capital Management L.P. | 59.033 | 1.892 | ||||||
| 2025-10-30 | 13F | 3EDGE Asset Management, LP | 0 | -100,00 | 0 | |||||
| 2026-02-10 | 13F | Evolution Wealth Management Inc. | 64.220 | 11,34 | 2.058 | 14,27 | ||||
| 2026-02-17 | 13F | Citadel Advisors Llc | 0 | -100,00 | 0 | |||||
| 2026-01-30 | 13F | Us Bancorp \de\ | 1.340 | 0,00 | 43 | 2,44 | ||||
| 2026-01-23 | 13F | Smith, Moore & Co. | 106.626 | -33,15 | 3.417 | -31,41 | ||||
| 2025-11-13 | 13F | Skyline Advisors, Inc. | 0 | -100,00 | 0 | |||||
| 2026-02-13 | 13F | Gts Securities Llc | 0 | -100,00 | 0 | |||||
| 2026-01-22 | 13F | Brookwood Investment Group LLC | 10.989 | 12,65 | 352 | 15,79 | ||||
| 2026-02-11 | 13F | LPL Financial LLC | 459.311 | 13,18 | 14.721 | 16,12 | ||||
| 2026-02-17 | 13F | Private Advisor Group, LLC | 1.120.557 | 466,76 | 35.914 | 481,59 | ||||
| 2026-01-07 | 13F | Bay Rivers Group | 19.762 | 19,31 | 633 | 22,44 | ||||
| 2026-01-27 | 13F | PFG Advisors | 22.278 | -8,07 | 714 | -5,56 | ||||
| 2026-02-11 | 13F | Jpmorgan Chase & Co | 37.425 | 762,53 | 1.199 | 788,15 | ||||
| 2026-02-13 | 13F | Resources Investment Advisors, LLC. | 84.134 | 17,13 | 2.697 | 20,20 | ||||
| 2026-02-02 | 13F | Advisors Preferred, LLC | 3.486 | 112 | ||||||
| 2026-02-09 | 13F | Arq Wealth Advisors, Llc | 273.051 | 7,33 | 8.751 | 10,13 | ||||
| 2026-02-05 | 13F | Western Wealth Management, LLC | 12.792 | -0,27 | 410 | 2,25 | ||||
| 2026-02-17 | 13F | Advisor Group Holdings, Inc. | 121.256 | -4,19 | 3.886 | -0,33 | ||||
| 2025-10-20 | 13F | Lionsbridge Wealth Management LLC | 0 | -100,00 | 0 | |||||
| 2026-01-23 | 13F | Assetmark, Inc | 628 | 0,00 | 20 | 5,26 | ||||
| 2026-02-17 | 13F | Equitable Holdings, Inc. | 72.407 | -9,25 | 2.321 | -6,90 | ||||
| 2026-02-04 | 13F | Meridian Wealth Management, LLC | 133.850 | 5,29 | 4.290 | 8,01 | ||||
| 2026-01-14 | 13F | Longview Financial Advisors LLC | 2.421 | -1,02 | 78 | 1,32 | ||||
| 2026-02-13 | 13F | Change Path, LLC | 35.274 | -0,02 | 1.131 | 2,54 | ||||
| 2026-02-12 | 13F | Betterment LLC | 9.316 | 12,12 | 0 | |||||
| 2026-01-12 | 13F | DAVENPORT & Co LLC | 0 | -100,00 | 0 | |||||
| 2026-01-23 | 13F | Diversify Advisory Services, LLC | 10.784 | 349 | ||||||
| 2026-02-04 | 13F | Ameritas Advisory Services, LLC | 127.050 | -48,53 | 4.072 | -47,20 | ||||
| 2026-01-23 | 13F | Farther Finance Advisors, LLC | 0 | -100,00 | 0 | |||||
| 2026-02-03 | 13F | CGC Financial Services, LLC | 3.115 | 0,00 | 100 | 2,06 | ||||
| 2026-02-13 | 13F | Wells Fargo & Company/mn | 650 | 0,00 | 21 | 0,00 | ||||
| 2026-01-20 | 13F | Stratos Wealth Advisors, LLC | 62.780 | 4,41 | 2.012 | 7,14 | ||||
| 2026-02-11 | 13F | Parallel Advisors, LLC | 88.485 | 17,95 | 2.836 | 21,00 | ||||
| 2025-11-14 | 13F | Jane Street Group, Llc | 0 | -100,00 | 0 | |||||
| 2026-02-12 | 13F | Principal Securities, Inc. | 0 | -100,00 | 0 | -100,00 | ||||
| 2026-02-13 | 13F | Ausdal Financial Partners, Inc. | 0 | -100,00 | 0 | |||||
| 2026-02-06 | 13F | Harmony Asset Management Llc | 106.545 | -21,52 | 3.415 | -19,48 | ||||
| 2026-02-09 | 13F | Harbour Investments, Inc. | 995 | 27,56 | 32 | 29,17 | ||||
| 2026-02-17 | 13F | Old Mission Capital Llc | 12.920 | 414 | ||||||
| 2026-02-12 | 13F | Commonwealth Equity Services, Llc | 13.402 | -23,13 | 430 | |||||
| 2026-01-26 | 13F | AE Wealth Management LLC | 5.932 | -10,96 | 190 | -8,65 | ||||
| 2026-01-23 | 13F | DHJJ Financial Advisors, Ltd. | 20 | 0,00 | 1 | |||||
| 2026-02-03 | 13F | Encompass More Asset Management | 23.831 | 90,40 | 764 | 95,64 | ||||
| 2025-10-20 | 13F | Northwest Capital Management Inc | 0 | -100,00 | 0 | -100,00 | ||||
| 2026-02-03 | 13F | Plan Group Financial, LLC | 7.826 | 251 | ||||||
| 2026-02-06 | 13F | HighTower Advisors, LLC | 172.180 | -0,31 | 5.518 | 2,28 | ||||
| 2026-02-13 | 13F | Kestra Advisory Services, LLC | 1.547 | 50 | ||||||
| 2026-02-13 | 13F | Blue Jean Financial Llc | 15.832 | 507 | ||||||
| 2026-02-17 | 13F | Captrust Financial Advisors | 48.722 | -4,24 | 1.562 | -1,76 | ||||
| 2026-02-03 | 13F | Sound Financial Strategies Group, LLC | 100.735 | 25,08 | 3.229 | 28,35 | ||||
| 2026-02-06 | 13F | Global Retirement Partners, LLC | 464 | 0,22 | 15 | 0,00 | ||||
| 2026-01-29 | 13F | Nbc Securities, Inc. | 6.027 | -84,93 | 193 | -84,55 | ||||
| 2025-11-14 | 13F | Bank Of America Corp /de/ | 0 | -100,00 | 0 | -100,00 | ||||
| 2026-02-13 | 13F | Golden State Wealth Management, LLC | 6.986 | -20,93 | 224 | -18,91 | ||||
| 2026-02-13 | 13F | Mariner, LLC | 36.643 | 153,71 | 1.174 | 160,31 | ||||
| 2026-01-20 | 13F | Fundamentun, Llc | 8.221 | -29,39 | 264 | -27,55 | ||||
| 2026-02-19 | 13F | BFI Wealth Solutions, LLC | 34.884 | 1.118 | ||||||
| 2025-11-14 | 13F | Raymond James Financial Inc | 0 | -100,00 | 0 | -100,00 | ||||
| 2025-11-14 | 13F | Wolverine Trading, Llc | 0 | -100,00 | 0 | |||||
| 2026-01-29 | 13F | Middleton & Co Inc/ma | 13.025 | 0,00 | 417 | 2,71 | ||||
| 2026-01-21 | 13F | Sowell Financial Services LLC | 90.169 | 2,31 | 2.890 | 4,98 | ||||
| 2026-01-09 | 13F | Dynamic Advisor Solutions LLC | 96.711 | -17,06 | 3.100 | -14,91 | ||||
| 2026-01-29 | 13F | UBS Group AG | 112.724 | -45,12 | 3.613 | -43,70 | ||||
| 2025-10-31 | 13F | PFG Investments, LLC | 0 | -100,00 | 0 | -100,00 | ||||
| 2026-01-15 | 13F | Victory Financial Group, Llc | 108.149 | -7,55 | 3.466 | -5,15 | ||||
| 2026-02-13 | 13F | Morgan Stanley | 8.154 | 1.696,04 | 261 | 1.764,29 | ||||
| 2025-10-07 | 13F | Nova Wealth Management, Inc. | 0 | -100,00 | 0 | -100,00 | ||||
| 2026-01-26 | 13F | Cwm, Llc | 605.285 | 3,25 | 19 | 5,56 | ||||
| 2026-02-12 | 13F | Proficio Capital Partners LLC | 10.470 | 0,00 | 336 | 2,45 | ||||
| 2026-02-12 | 13F | WealthPLAN Partners, LLC | 304.854 | -6,07 | 9.771 | -3,63 | ||||
| 2025-11-04 | 13F | L.m. Kohn & Company | 0 | -100,00 | 0 | |||||
| 2026-02-06 | 13F | Larson Financial Group LLC | 450 | -27,18 | 14 | -26,32 | ||||
| 2026-02-13 | 13F | National Bank Of Canada /fi/ | 504 | 0,00 | 16 | 6,67 | ||||
| 2026-02-05 | 13F | WealthPlan Investment Management, LLC | 558.393 | -14,61 | 17.896 | -12,39 | ||||
| 2026-01-29 | 13F | Comerica Bank | 140 | 100,00 | 4 | 100,00 | ||||
| 2026-02-10 | 13F | Envestnet Asset Management Inc | 147.330 | -0,93 | 4.722 | 1,64 | ||||
| 2026-01-09 | 13F | Independence Wealth Advisors, LLC | 9.257 | 297 | ||||||
| 2026-02-13 | 13F | Smartleaf Asset Management LLC | 39.646 | 59,11 | 1.274 | 64,18 | ||||
| 2026-02-05 | 13F | Stephens Inc /ar/ | 208.209 | -22,32 | 6.673 | -20,29 | ||||
| 2026-02-13 | 13F | Advyzon Investment Management, LLC | 9.593 | 307 | ||||||
| 2026-02-17 | 13F | Hilltop Holdings Inc. | 15.781 | 0,38 | 506 | 2,85 | ||||
| 2026-02-17 | 13F | Royal Bank Of Canada | 8.125 | 42,77 | 261 | 46,63 | ||||
| 2026-02-05 | 13F | Cambridge Investment Research Advisors, Inc. | 28.491 | 1,86 | 1 | |||||
| 2026-02-17 | 13F/A | Kovack Advisors, Inc. | 196.507 | 6.298 | ||||||
| 2025-11-03 | 13F | Belpointe Asset Management LLC | 0 | -100,00 | 0 | -100,00 | ||||
| 2026-01-26 | 13F | Reyes Financial Architecture, Inc. | 2.854 | 0,32 | 91 | 3,41 | ||||
| 2026-02-13 | 13F | Mml Investors Services, Llc | 125.096 | -5,26 | 4.009 | -2,79 | ||||
| 2026-02-17 | 13F | Cetera Investment Advisers | 23.465 | 0,93 | 752 | 3,58 | ||||
| 2026-02-19 | 13F | ATX Financial Planning, LLC | 44.823 | 1.437 | ||||||
| 2026-01-20 | 13F | Chatterton & Associates Inc. | 6.915 | 222 | ||||||
| 2026-01-15 | 13F | Alpine Bank Wealth Management | 0 | -100,00 | 0 | |||||
| 2026-02-11 | 13F | Sunrise Financial Services, LLC | 1.942 | 62 |