Grundlæggende statistik
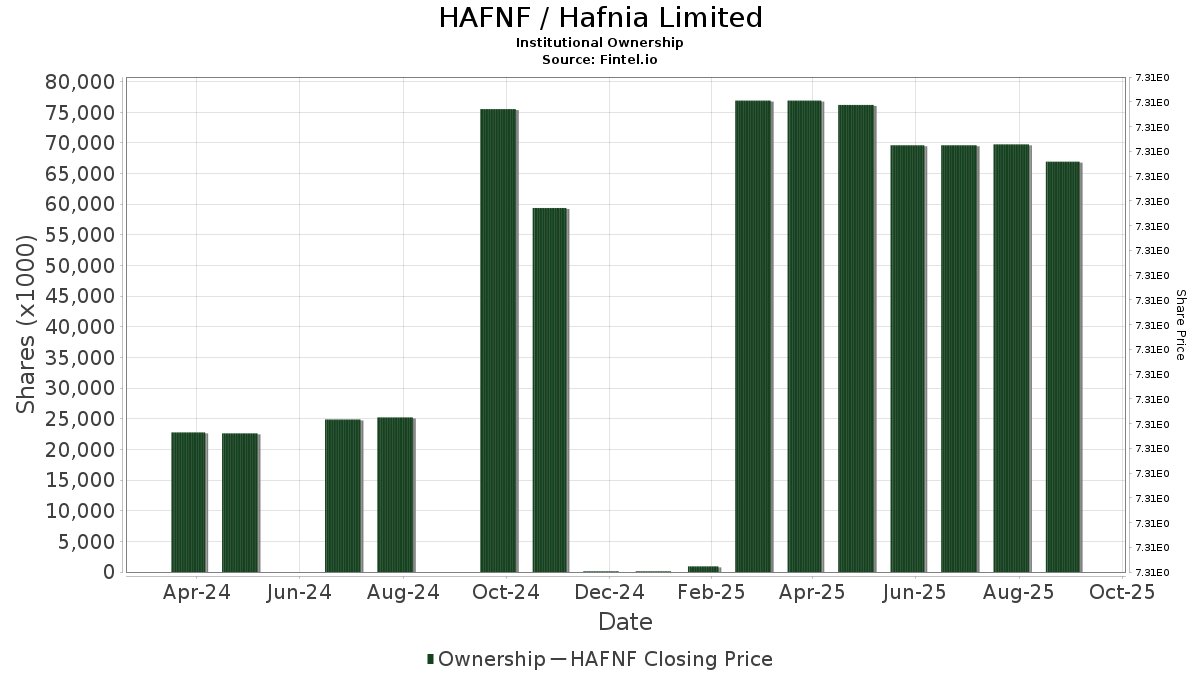
| Institutionelle aktier (lange) | 77.674.355 - 15,54% (ex 13D/G) - change of 8,23MM shares 11,86% MRQ |
| Institutionel værdi (lang) | $ 363.197 USD ($1000) |
Institutionelt ejerskab og aktionærer
Hafnia Limited (US:HAFNF) har 130 institutionelle ejere og aktionærer, der har indsendt 13D/G- eller 13F-formularer til Securities Exchange Commission (SEC). Disse institutioner har i alt 77,674,355 aktier. Største aktionærer omfatter Mhr Fund Management Llc, Acadian Asset Management Llc, Vanguard Group Inc, Arrowstreet Capital, Limited Partnership, Assenagon Asset Management S.A., Goldman Sachs Group Inc, Bank of New York Mellon Corp, Canada Pension Plan Investment Board, Legal & General Group Plc, and Public Employees Retirement System Of Ohio .
Hafnia Limited (OTCPK:HAFNF) institutionel ejerskabsstruktur viser aktuelle positioner i virksomheden efter institutioner og fonde, samt seneste ændringer i positionsstørrelse. Større aktionærer kan omfatte individuelle investorer, investeringsforeninger, hedgefonde eller institutioner. Skema 13D angiver, at investoren besidder (eller besidder) mere end 5 % af virksomheden og har til hensigt (eller har til hensigt at) aktivt at forfølge en ændring i forretningsstrategi. Skema 13G indikerer en passiv investering på over 5%.
Fondens stemningsscore
Fund Sentiment Score (fka Ownership Accumulation Score) finder de aktier, der bliver mest købt af fonde. Det er resultatet af en sofistikeret, multi-faktor kvantitativ model, der identificerer virksomheder med de højeste niveauer af institutionel akkumulering. Scoringsmodellen bruger en kombination af den samlede stigning i oplyste ejere, ændringerne i porteføljeallokeringer i disse ejere og andre målinger. Tallet går fra 0 til 100, hvor højere tal indikerer et højere niveau af akkumulering for sine jævnaldrende, og 50 er gennemsnittet.
Opdateringsfrekvens: Dagligt
Se Ownership Explorer, som giver en liste over højest rangerende virksomheder.
AI+ Ask Fintel’s AI assistant about Hafnia Limited.
Select a question to share a public post with an AI-crafted answer.
Thinking of good questions…
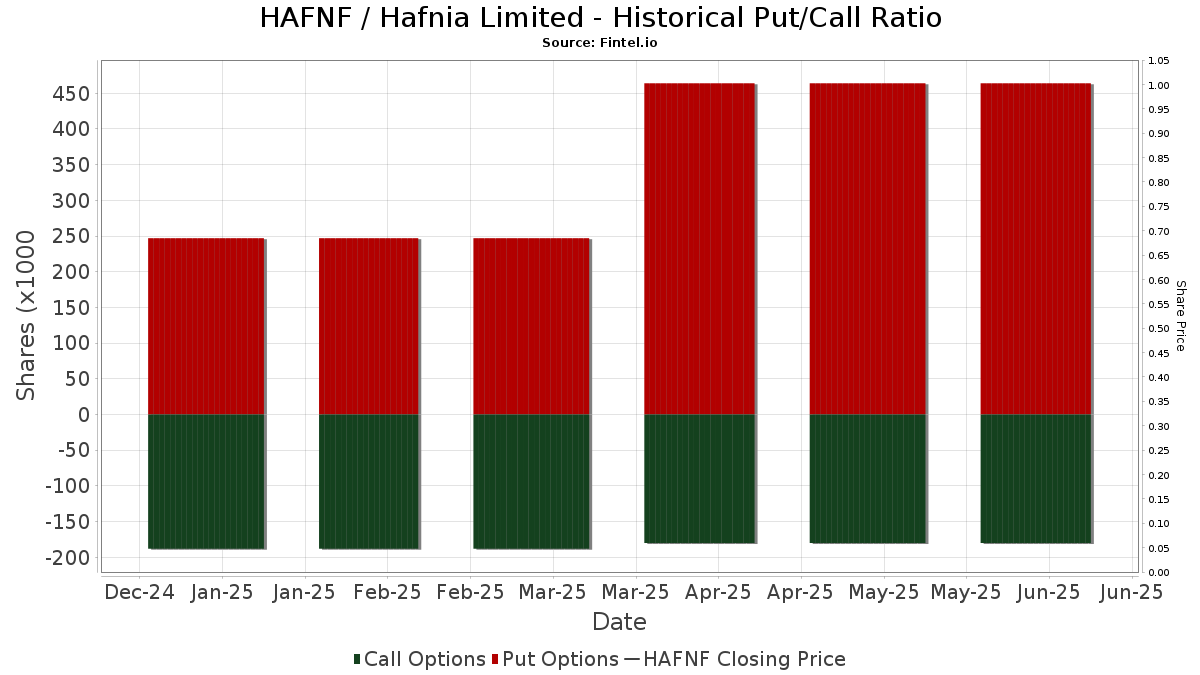
Institutionel Put/Call-forhold
Ud over at indberette standardaktie- og gældsudstedelser skal institutter med mere end 100 mill. aktiver under forvaltning også oplyse deres put- og call-optionsbeholdninger. Da salgsoptioner generelt indikerer negativ stemning, og købsoptioner indikerer positiv stemning, kan vi få en fornemmelse af den overordnede institutionelle stemning ved at plotte forholdet mellem put og kald. Diagrammet til højre viser det historiske put/call-forhold for dette instrument.
Brug af Put/Call Ratio som en indikator for investorernes stemning overvinder en af de vigtigste mangler ved at bruge totalt institutionelt ejerskab, som er, at en betydelig mængde af aktiver under forvaltning investeres passivt for at spore indekser. Passivt forvaltede fonde køber typisk ikke optioner, så indikatoren for put/call-forholdet følger mere nøje følelsen af aktivt forvaltede fonde.
13F og NPORT arkivering
Detaljer om 13F-arkivering er gratis. Detaljer om NP-ansøgninger kræver et premium-medlemskab. Grønne rækker angiver nye positioner. Røde rækker angiver lukkede positioner. Klik på linket ikon for at se den fulde transaktionshistorik.
Opgrader
for at låse premium-data op og eksportere til Excel ![]() .
.
| Fil dato | Kilde | Investor | Type | Gennemsnitlig pris (Øst) |
Aktier | Δ Aktier (%) |
Rapporteret Værdi ($1000) |
Δ Værdi (%) |
Port Alloc (%) |
|
|---|---|---|---|---|---|---|---|---|---|---|
| 2026-02-17 | 13F | Russell Investments Group, Ltd. | 288.630 | 0,00 | 1.557 | -10,52 | ||||
| 2026-02-10 | 13F | Armor Advisors, L.l.c. | 0 | -100,00 | 0 | |||||
| 2026-01-27 | 13F/A | Capital Performance Advisors Llp | 15.123 | -10,60 | 81 | -20,79 | ||||
| 2026-01-20 | 13F | Ascent Group, LLC | 28.017 | 2,70 | 149 | -8,59 | ||||
| 2026-04-16 | 13F | Westhampton Capital, LLC | 11.000 | 0,00 | 84 | 43,10 | ||||
| 2026-04-20 | 13F | Ronald Blue Trust, Inc. | 6.321 | 48 | ||||||
| 2026-04-16 | 13F | Warren Street Wealth Advisors, LLC | 14.844 | 2,78 | 113 | 47,37 | ||||
| 2026-02-12 | 13F | Kovack Advisors, Inc. | 103.147 | 0 | ||||||
| 2026-02-18 | 13F | State of Tennessee, Treasury Department | 634.966 | 0,00 | 3.917 | 2,41 | ||||
| 2026-02-13 | 13F | Barclays Plc | 0 | -100,00 | 0 | |||||
| 2026-02-17 | 13F | XTX Topco Ltd | 282.479 | 170,24 | 1.506 | 140,42 | ||||
| 2026-02-10 | 13F | Savant Capital, LLC | 53.515 | -10,04 | 285 | -19,94 | ||||
| 2026-01-27 | 13F | TD Waterhouse Canada Inc. | 70.428 | 375 | ||||||
| 2026-02-18 | 13F | Vident Advisory, LLC | 310.925 | -4,48 | 1.677 | -14,53 | ||||
| 2026-02-17 | 13F | Quadrature Capital Ltd | 19.628 | 105 | ||||||
| 2026-04-24 | 13F | Root Financial Partners, LLC | 53 | 0,00 | 0 | |||||
| 2026-02-12 | 13F | Swiss National Bank | 555.511 | 1,56 | 2.997 | -9,13 | ||||
| 2026-02-13 | 13F | Caitong International Asset Management Co., Ltd | 2.088 | 52.100,00 | 11 | |||||
| 2026-02-17 | 13F | Aqr Capital Management Llc | 70.921 | 382 | ||||||
| 2026-02-11 | 13F | Parallel Advisors, LLC | 21 | 0 | ||||||
| 2026-01-30 | 13F | Kiker Wealth Management, LLC | 0 | -100,00 | 0 | |||||
| 2026-02-12 | 13F | Jane Street Group, Llc | 288.769 | -34,36 | 1.539 | -41,59 | ||||
| 2025-11-13 | 13F | FIL Ltd | 0 | -100,00 | 0 | -100,00 | ||||
| 2026-01-30 | 13F | Glenorchy Capital Ltd | 98.964 | 3,60 | 527 | -8,19 | ||||
| 2026-02-06 | 13F | EverSource Wealth Advisors, LLC | 137 | 1 | ||||||
| 2026-02-13 | 13F | Quarry LP | 0 | -100,00 | 0 | |||||
| 2026-02-13 | 13F | Oceanic Investment Management LTD | 478.486 | 2.550 | ||||||
| 2026-02-17 | 13F | Quantinno Capital Management LP | 52.220 | 16,47 | 278 | 3,73 | ||||
| 2026-02-17 | 13F | Tower Research Capital LLC (TRC) | 115.107 | 248,25 | 614 | 211,17 | ||||
| 2025-11-07 | 13F | Gsa Capital Partners Llp | 0 | -100,00 | 0 | |||||
| 2026-02-17 | 13F | PharVision Advisers, LLC | 0 | -100,00 | 0 | |||||
| 2026-03-16 | 13F/A | Rockefeller Capital Management L.P. | 2.150 | 2,67 | 11 | -8,33 | ||||
| 2026-02-17 | 13F | Alliancebernstein L.p. | 138.303 | -0,60 | 737 | -11,52 | ||||
| 2026-02-24 | 13F | DGS Capital Management, LLC | 159.777 | -2,85 | 852 | -13,60 | ||||
| 2026-02-13 | 13F | Arrowstreet Capital, Limited Partnership | 10.742.756 | 0,00 | 57.557 | -10,80 | ||||
| 2026-01-30 | 13F | Catalytic Wealth RIA, LLC | 10.000 | 53 | ||||||
| 2026-02-17 | 13F | Numerai GP LLC | 38.487 | 205 | ||||||
| 2026-02-17 | 13F | Caption Management, LLC | 14.812 | 146,25 | 79 | 116,67 | ||||
| 2026-02-17 | 13F | Caption Management, LLC | Put | 125.000 | 140,38 | 666 | 114,15 | |||
| 2026-02-10 | 13F | Quantbot Technologies LP | 21.938 | 117 | ||||||
| 2026-04-07 | 13F | Farther Finance Advisors, LLC | 57 | 0 | ||||||
| 2026-01-15 | 13F | Bernard Wealth Management Corp. | 10.430 | 0,00 | 56 | -11,29 | ||||
| 2026-01-27 | 13F | WealthCollab, LLC | 922 | -78,89 | 5 | -84,62 | ||||
| 2026-02-17 | 13F | Citadel Advisors Llc | Call | 379.600 | 89,23 | 2.023 | 68,44 | |||
| 2026-02-03 | 13F | SBI Securities Co., Ltd. | 16.101 | -1,81 | 86 | -13,27 | ||||
| 2026-02-17 | 13F | Citadel Advisors Llc | 182.666 | -67,94 | 974 | -71,48 | ||||
| 2026-02-12 | 13F | Marex Group plc | 201.383 | 48,24 | 1.073 | 31,33 | ||||
| 2026-02-13 | 13F | Virtus ETF Advisers LLC | 23.568 | 570 | ||||||
| 2026-02-17 | 13F | Jones Financial Companies Lllp | 2.390 | 8,64 | 13 | -7,69 | ||||
| 2026-02-17 | 13F | Citadel Advisors Llc | Put | 31.500 | -56,73 | 168 | -61,70 | |||
| 2025-11-12 | 13F | Stifel Financial Corp | 0 | -100,00 | 0 | |||||
| 2026-02-13 | 13F | Y-Intercept (Hong Kong) Ltd | 182.218 | 971 | ||||||
| 2026-02-17 | 13F | Hartree Partners, LP | 0 | -100,00 | 0 | |||||
| 2025-11-14 | 13F | Susquehanna Advisors Group, Inc. | 0 | -100,00 | 0 | -100,00 | ||||
| 2026-02-13 | 13F | Kestra Advisory Services, LLC | 6.758 | 36 | ||||||
| 2026-02-12 | 13F | CIBC Private Wealth Group, LLC | 0 | -100,00 | 0 | |||||
| 2026-02-17 | 13F | Susquehanna International Group, Llp | 320.237 | 21,87 | 1.707 | 8,39 | ||||
| 2026-02-17 | 13F | Engineers Gate Manager LP | 16.018 | 30,25 | 85 | 16,44 | ||||
| 2026-02-17 | 13F | Bank Of America Corp /de/ | 207.884 | 0,81 | 1.108 | -10,28 | ||||
| 2026-02-17 | 13F | Susquehanna International Group, Llp | Put | 519.500 | -22,10 | 2.769 | -30,70 | |||
| 2026-04-20 | 13F | CWA Asset Management Group, LLC | 0 | -100,00 | 0 | |||||
| 2026-02-11 | 13F | Simplex Trading, Llc | 14.919 | 80 | ||||||
| 2026-04-14 | 13F | Seven Mile Advisory | 10.268 | 78 | ||||||
| 2026-02-17 | 13F | Prelude Capital Management, Llc | 59.594 | 1,82 | 318 | -9,43 | ||||
| 2026-02-17 | 13F | Lazard Asset Management Llc | 35.639 | -13,39 | 191 | -23,08 | ||||
| 2026-02-17 | 13F | Graham Capital Management, L.P. | 0 | -100,00 | 0 | |||||
| 2026-02-13 | 13F | JustInvest LLC | 114.756 | -10,94 | 612 | -20,85 | ||||
| 2025-11-14 | 13F | Aventail Capital Group, LP | 0 | -100,00 | 0 | |||||
| 2026-02-17 | 13F | Trexquant Investment LP | 182.428 | 15,68 | 972 | 2,97 | ||||
| 2026-02-10 | 13F | Cercano Management LLC | 264.379 | 1.426 | ||||||
| 2025-11-14 | 13F | Balyasny Asset Management Llc | 0 | -100,00 | 0 | |||||
| 2026-01-12 | 13F | CVA Family Office, LLC | 434 | 4,33 | 2 | 0,00 | ||||
| 2026-01-29 | 13F | Vanguard Group Inc | 10.928.233 | 0,64 | 58.870 | -10,16 | ||||
| 2026-02-17 | 13F | Fearnley Asset Management As | 136.022 | 3.185 | ||||||
| 2026-02-17 | 13F | Boothbay Fund Management, Llc | 152.519 | 8,23 | 813 | -3,79 | ||||
| 2025-11-07 | 13F | Skandinaviska Enskilda Banken AB (publ) | 0 | -100,00 | 0 | |||||
| 2026-04-24 | 13F | UMA Financial Services, Inc. | 94 | 1 | ||||||
| 2026-02-11 | 13F | LPL Financial LLC | 112.280 | -4,26 | 598 | -14,81 | ||||
| 2026-02-11 | 13F | Vise Technologies, Inc. | 0 | -100,00 | 0 | |||||
| 2026-02-12 | 13F | Nuveen, LLC | 232.951 | 0,00 | 1.256 | -10,48 | ||||
| 2026-02-10 | 13F | Goldman Sachs Group Inc | 3.870.521 | 17,34 | 20.630 | 4,41 | ||||
| 2026-02-13 | 13F | Morgan Stanley | 560.924 | 151,97 | 2.990 | 124,23 | ||||
| 2025-11-12 | 13F | 111 Capital | 0 | -100,00 | 0 | |||||
| 2026-02-10 | 13F | Td Asset Management Inc | 37.039 | 7,09 | 200 | -4,33 | ||||
| 2026-02-13 | 13F | Toroso Investments, LLC | 205.923 | 1.098 | ||||||
| 2026-02-17 | 13F | Public Employees Retirement System Of Ohio | 679.179 | -0,64 | 3.660 | -11,17 | ||||
| 2026-01-27 | 13F | Zurcher Kantonalbank (Zurich Cantonalbank) | 138.534 | 46,91 | 747 | 31,51 | ||||
| 2026-02-17 | 13F | Two Sigma Investments, Lp | 430.629 | 12,83 | 2.295 | 0,39 | ||||
| 2026-01-28 | 13F | U S Global Investors Inc | 0 | -100,00 | 0 | |||||
| 2026-02-10 | 13F | State of Wyoming | 33.348 | -39,90 | 178 | -46,69 | ||||
| 2026-02-17 | 13F | Cape Investment Advisory, Inc. | 6.780 | 36 | ||||||
| 2026-02-17 | 13F | Fmr Llc | 173.584 | 13,00 | 937 | 1,19 | ||||
| 2026-02-13 | 13F | First Trust Advisors Lp | 64.311 | -0,40 | 347 | -10,82 | ||||
| 2026-02-09 | 13F | Legal & General Group Plc | 762.350 | -5,87 | 4.108 | -15,79 | ||||
| 2026-01-29 | 13F | UBS Group AG | 530.248 | 81,41 | 2.826 | 61,49 | ||||
| 2026-02-11 | 13F | Jpmorgan Chase & Co | 528.975 | 17,91 | 2.819 | 4,91 | ||||
| 2026-04-14 | 13F | Nbc Securities, Inc. | 1.053 | 2,63 | 8 | 60,00 | ||||
| 2026-04-15 | 13F | Merit Financial Group, LLC | 15.901 | 2,67 | 121 | 46,34 | ||||
| 2026-02-17 | 13F | Schonfeld Strategic Advisors LLC | 136.027 | 725 | ||||||
| 2026-02-06 | 13F | HighTower Advisors, LLC | 28.743 | -32,27 | 153 | -39,76 | ||||
| 2026-01-28 | 13F | WIT Partners Advisory Pte. Ltd. | 0 | -100,00 | 0 | |||||
| 2026-02-13 | 13F | Ieq Capital, Llc | 0 | -100,00 | 0 | |||||
| 2026-02-12 | 13F | Rossby Financial, LCC | 13.500 | 72 | ||||||
| 2026-02-17 | 13F | Cetera Investment Advisers | 12.189 | 2,64 | 65 | -9,86 | ||||
| 2026-01-30 | 13F | Mitsubishi UFJ Trust & Banking Corp | 116.416 | 1,01 | 628 | -11,81 | ||||
| 2026-02-17 | 13F | Aquatic Capital Management LLC | 5.680 | 30 | ||||||
| 2026-02-13 | 13F | Marshall Wace, Llp | 22.328 | 119 | ||||||
| 2026-02-17 | 13F | Millennium Management Llc | 0 | -100,00 | 0 | |||||
| 2026-02-12 | 13F | BlackRock, Inc. | 956 | 3.724,00 | 5 | |||||
| 2026-02-17 | 13F | Moore Capital Management, Lp | 0 | -100,00 | 0 | |||||
| 2025-11-14 | 13F | Susquehanna International Group, Llp | Call | 0 | -100,00 | 0 | -100,00 | |||
| 2026-02-13 | 13F | Citigroup Inc | 1.081 | -94,40 | 6 | -95,69 | ||||
| 2026-02-10 | 13F | Bank of New York Mellon Corp | 1.658.866 | 314,58 | 8.842 | 266,85 | ||||
| 2025-11-14 | 13F | Ubs Asset Management Americas Inc | 0 | -100,00 | 0 | |||||
| 2026-04-14 | 13F | Drive Wealth Management, Llc | 31.193 | -3,74 | 237 | 37,79 | ||||
| 2026-02-13 | 13F | Mariner, LLC | 126.551 | -36,17 | 675 | -43,22 | ||||
| 2026-02-13 | 13F | Marnell Management LLC | 404.306 | 2.155 | ||||||
| 2026-04-24 | 13F | USS Investment Management Ltd | 74.826 | 0,00 | 576 | 39,47 | ||||
| 2026-02-12 | 13F | Hrt Financial Lp | 36.068 | -15,39 | 0 | |||||
| 2026-02-17 | 13F | SIH Partners, LLLP | 61.820 | 60,65 | 330 | 43,04 | ||||
| 2026-04-22 | 13F | Samalin Investment Counsel, LLC | 0 | -100,00 | 0 | |||||
| 2026-02-10 | 13F | Acadian Asset Management Llc | 12.361.826 | -5,60 | 67 | -15,38 | ||||
| 2026-02-13 | 13F | Smartleaf Asset Management LLC | 8.894 | 47 | ||||||
| 2026-02-17 | 13F | D. E. Shaw & Co., Inc. | 110.915 | -28,75 | 591 | -36,59 | ||||
| 2026-02-17 | 13F | Optiver Holding B.V. | 6.459 | -53,27 | 34 | -58,54 | ||||
| 2026-02-13 | 13F | Wells Fargo & Company/mn | 147 | 0,68 | 1 | |||||
| 2025-11-14 | 13F | Mml Investors Services, Llc | 0 | -100,00 | 0 | |||||
| 2026-02-17 | 13F | Advisor Group Holdings, Inc. | 3.320 | -24,08 | 18 | -34,62 | ||||
| 2026-04-22 | 13F | Pictet Asset Management Holding SA | 91.384 | 1,84 | 700 | 44,72 | ||||
| 2026-02-17 | 13F | Qube Research & Technologies Ltd | 94.491 | 504 | ||||||
| 2026-02-10 | 13F/A | Northwestern Mutual Wealth Management Co | 45 | 0 | ||||||
| 2026-02-20 | 13F | Sunbelt Securities, Inc. | 0 | -100,00 | 0 | |||||
| 2026-02-13 | 13F | Bridgewater Associates, LP | 193.026 | 1.029 | ||||||
| 2026-02-13 | 13F | Gts Securities Llc | 0 | -100,00 | 0 | |||||
| 2026-02-13 | 13F | Cornerstone Financial Management LLC | 514 | 3 | ||||||
| 2026-02-13 | 13F | Manufacturers Life Insurance Company, The | 0 | -100,00 | 0 | |||||
| 2026-02-17 | 13F | Corigliano Investment Advisers, LLC | 663.093 | 98,53 | 3.534 | 76,70 | ||||
| 2026-01-30 | 13F | Sigma Planning Corp | 28.800 | 4,35 | 154 | -7,27 | ||||
| 2026-04-20 | 13F | Moody Aldrich Partners Llc | 102.062 | 0,00 | 781 | 42,00 | ||||
| 2026-02-13 | 13F | Squarepoint Ops LLC | 28.861 | 154 | ||||||
| 2026-02-12 | 13F | Aristides Capital LLC | 33.548 | 179 | ||||||
| 2026-02-17 | 13F | Canada Pension Plan Investment Board | 885.178 | 30,70 | 4.774 | 16,96 | ||||
| 2026-02-17 | 13F | IHT Wealth Management, LLC | 57.220 | 0,00 | 305 | -11,11 | ||||
| 2026-02-19 | 13F | Mcguire Capital Advisors Inc | 14.964 | 80 | ||||||
| 2026-02-13 | 13F | MAI Capital Management | 0 | -100,00 | 0 | |||||
| 2026-02-17 | 13F | Mhr Fund Management Llc | 18.496.652 | 7,62 | 98.587 | -4,24 | ||||
| 2026-04-20 | 13F | Assenagon Asset Management S.A. | 4.206.268 | 32.205 | ||||||
| 2026-02-12 | 13F | Sprott Inc. | 95.000 | 506 | ||||||
| 2025-10-31 | 13F | NWF Advisory Services Inc. | 0 | -100,00 | 0 | |||||
| 2026-02-17 | 13F | PDT Partners, LLC | 167.658 | 0,00 | 894 | -11,06 | ||||
| 2026-02-11 | 13F | Allianz Asset Management GmbH | 18.142 | -87,69 | 98 | -89,08 | ||||
| 2026-02-05 | 13F | Cambridge Investment Research Advisors, Inc. | 21.780 | -0,96 | 0 | |||||
| 2026-02-18 | 13F | Sierra Capital LLC | 10.000 | 0,00 | 0 | |||||
| 2026-04-15 | 13F | Exchange Traded Concepts, Llc | 376.903 | 91,92 | 2.864 | 173,80 | ||||
| 2026-04-22 | 13F | Stone House Investment Management, LLC | 23 | 0 | ||||||
| 2026-02-17 | 13F | Wellington Management Group Llp | 166.348 | 38,64 | 890 | 23,82 | ||||
| 2026-02-23 | 13F | Virtu Financial LLC | 32.638 | 0 | ||||||
| 2025-10-29 | 13F | Stegent Equity Advisors, Inc. | 0 | -100,00 | 0 | -100,00 | ||||
| 2026-02-12 | 13F | Brinker Capital Investments, LLC | 28.073 | 1,94 | 150 | -9,15 | ||||
| 2026-04-23 | 13F | J.w. Cole Advisors, Inc. | 11.812 | 3,08 | 90 | 45,90 | ||||
| 2026-02-17 | 13F | Royal Bank Of Canada | 7.185 | 504,80 | 38 | 442,86 | ||||
| 2026-02-03 | 13F | Tweedy, Browne Co LLC | 196.381 | 21,53 | 1.047 | 8,17 | ||||
| 2026-02-06 | 13F | Larson Financial Group LLC | 1.082 | 840,87 | 6 | |||||
| 2026-02-17 | 13F | Amundi | 63.748 | 44,97 | 340 | 24,63 | ||||
| 2026-02-10 | 13F | Bnp Paribas Arbitrage, Sa | 35.058 | -77,36 | 187 | -79,94 | ||||
| 2026-01-14 | 13F | Redhawk Wealth Advisors, Inc. | 0 | -100,00 | 0 | -100,00 | ||||
| 2025-11-10 | 13F | Jupiter Asset Management Ltd | 0 | -100,00 | 0 | |||||
| 2025-11-13 | 13F | Baird Financial Group, Inc. | 0 | -100,00 | 0 | -100,00 | ||||
| 2026-04-17 | 13F | Bell Investment Advisors, Inc | 249 | 97,62 | 2 | |||||
| 2025-11-14 | 13F | Verition Fund Management LLC | 0 | -100,00 | 0 | |||||
| 2026-01-12 | 13F | Seacrest Wealth Management, Llc | 0 | -100,00 | 0 | |||||
| 2026-02-18 | 13F | Mackenzie Financial Corp | 240.088 | 18,30 | 1.297 | 6,14 | ||||
| 2025-11-14 | 13F | Wolverine Trading, Llc | Put | 0 | -100,00 | 0 |