Grundlæggende statistik
| Institutionelle ejere | 249 total, 249 long only, 0 short only, 0 long/short - change of 4,60% MRQ |
| Gennemsnitlig porteføljeallokering | 0.0880 % - change of -19,02% MRQ |
| Institutionelle aktier (lange) | 12.671.130 (ex 13D/G) - change of -0,47MM shares -3,56% MRQ |
| Institutionel værdi (lang) | $ 491.912 USD ($1000) |
Institutionelt ejerskab og aktionærer
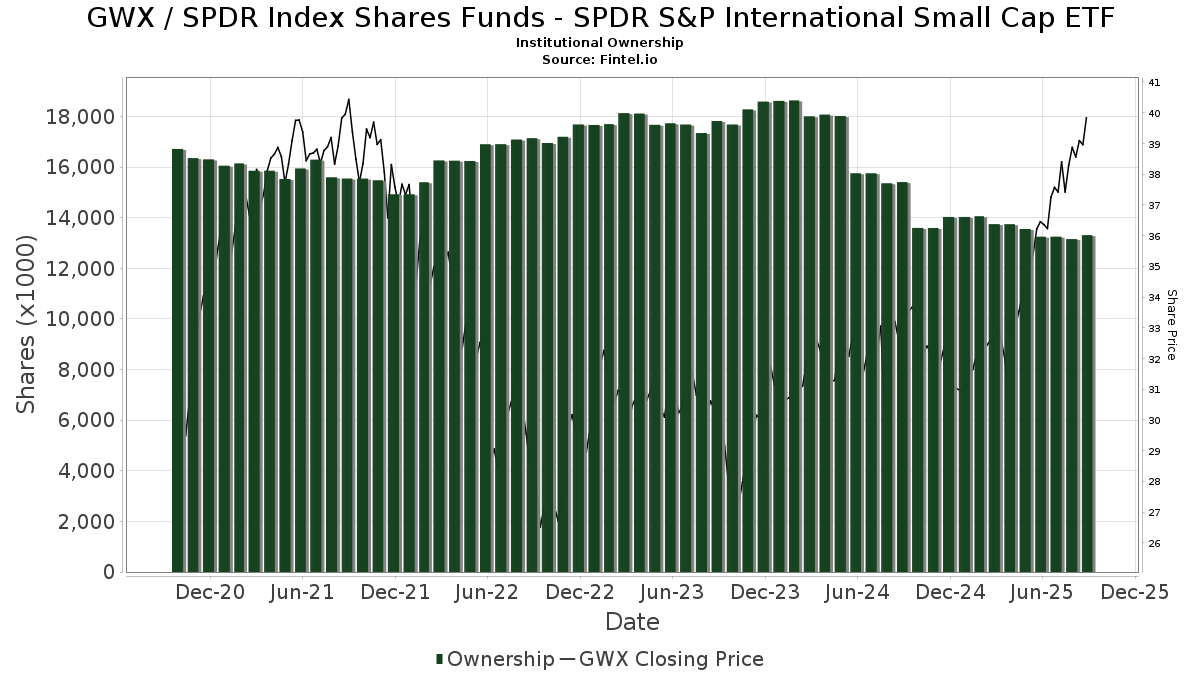
SPDR Index Shares Funds - State Street SPDR S&P International Small Cap ETF (US:GWX) har 249 institutionelle ejere og aktionærer, der har indsendt 13D/G- eller 13F-formularer til Securities Exchange Commission (SEC). Disse institutioner har i alt 12,671,130 aktier. Største aktionærer omfatter LPL Financial LLC, Envestnet Asset Management Inc, Bank Of America Corp /de/, BRYN MAWR TRUST Co, Cetera Investment Advisers, Envestnet Portfolio Solutions, Inc., Advisor Group Holdings, Inc., Assetmark, Inc, Tiaa Trust, National Association, and Wells Fargo & Company/mn .
SPDR Index Shares Funds - State Street SPDR S&P International Small Cap ETF (ARCA:GWX) institutionel ejerskabsstruktur viser aktuelle positioner i virksomheden efter institutioner og fonde, samt seneste ændringer i positionsstørrelse. Større aktionærer kan omfatte individuelle investorer, investeringsforeninger, hedgefonde eller institutioner. Skema 13D angiver, at investoren besidder (eller besidder) mere end 5 % af virksomheden og har til hensigt (eller har til hensigt at) aktivt at forfølge en ændring i forretningsstrategi. Skema 13G indikerer en passiv investering på over 5%.
The share price as of March 10, 2026 is 43,97 / share. Previously, on March 11, 2025, the share price was 32,06 / share. This represents an increase of 37,15% over that period.
Fondens stemningsscore
Fund Sentiment Score (fka Ownership Accumulation Score) finder de aktier, der bliver mest købt af fonde. Det er resultatet af en sofistikeret, multi-faktor kvantitativ model, der identificerer virksomheder med de højeste niveauer af institutionel akkumulering. Scoringsmodellen bruger en kombination af den samlede stigning i oplyste ejere, ændringerne i porteføljeallokeringer i disse ejere og andre målinger. Tallet går fra 0 til 100, hvor højere tal indikerer et højere niveau af akkumulering for sine jævnaldrende, og 50 er gennemsnittet.
Opdateringsfrekvens: Dagligt
Se Ownership Explorer, som giver en liste over højest rangerende virksomheder.
AI+ Ask Fintel’s AI assistant about SPDR Index Shares Funds - State Street SPDR S&P International Small Cap ETF.
Select a question to share a public post with an AI-crafted answer.
Thinking of good questions…
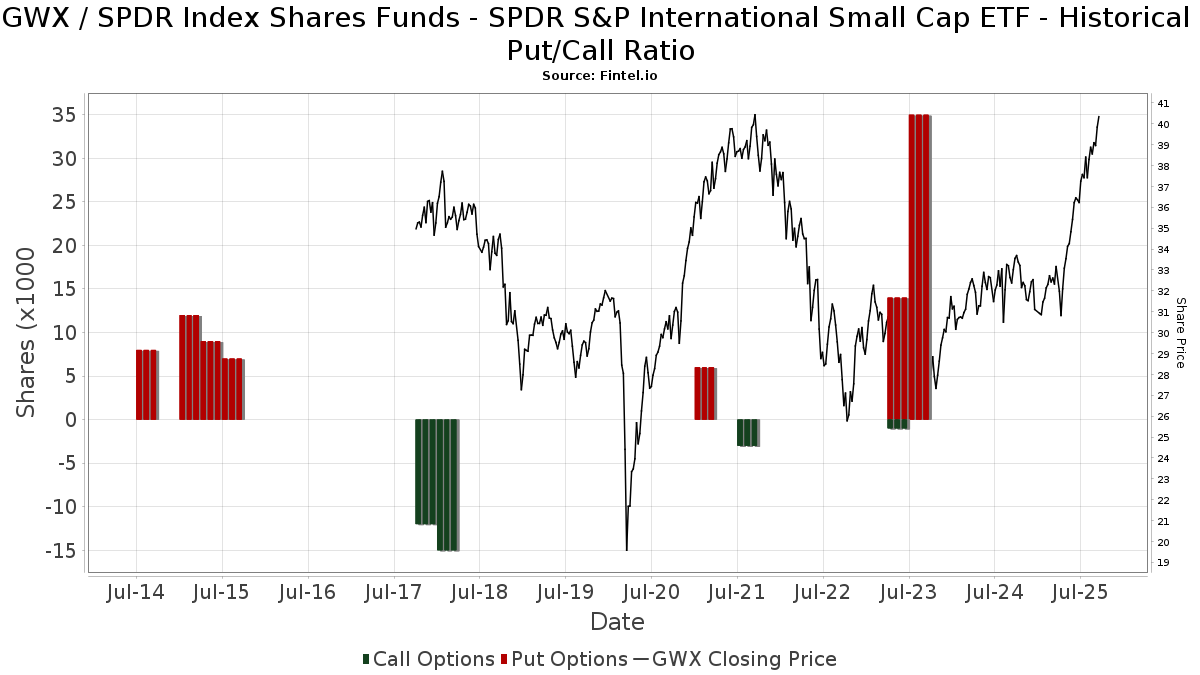
Institutionel Put/Call-forhold
Ud over at indberette standardaktie- og gældsudstedelser skal institutter med mere end 100 mill. aktiver under forvaltning også oplyse deres put- og call-optionsbeholdninger. Da salgsoptioner generelt indikerer negativ stemning, og købsoptioner indikerer positiv stemning, kan vi få en fornemmelse af den overordnede institutionelle stemning ved at plotte forholdet mellem put og kald. Diagrammet til højre viser det historiske put/call-forhold for dette instrument.
Brug af Put/Call Ratio som en indikator for investorernes stemning overvinder en af de vigtigste mangler ved at bruge totalt institutionelt ejerskab, som er, at en betydelig mængde af aktiver under forvaltning investeres passivt for at spore indekser. Passivt forvaltede fonde køber typisk ikke optioner, så indikatoren for put/call-forholdet følger mere nøje følelsen af aktivt forvaltede fonde.
13F og NPORT arkivering
Detaljer om 13F-arkivering er gratis. Detaljer om NP-ansøgninger kræver et premium-medlemskab. Grønne rækker angiver nye positioner. Røde rækker angiver lukkede positioner. Klik på linket ikon for at se den fulde transaktionshistorik.
Opgrader
for at låse premium-data op og eksportere til Excel ![]() .
.
| Fil dato | Kilde | Investor | Type | Gennemsnitlig pris (Øst) |
Aktier | Δ Aktier (%) |
Rapporteret Værdi ($1000) |
Δ Værdi (%) |
Port Alloc (%) |
|
|---|---|---|---|---|---|---|---|---|---|---|
| 2026-01-27 | 13F | RTD Financial Advisors, Inc. | 126.496 | -2,20 | 5.169 | -0,56 | ||||
| 2026-01-29 | 13F | Nbc Securities, Inc. | 117 | 0,00 | 5 | 0,00 | ||||
| 2026-02-12 | 13F | BRYN MAWR TRUST Co | 557.131 | 5,56 | 22.764 | 7,35 | ||||
| 2026-02-13 | 13F | Lifeworks Advisors, LLC | 8.496 | -0,39 | 347 | 1,46 | ||||
| 2026-02-10 | 13F | Evolution Wealth Management Inc. | 2.746 | 135,51 | 112 | 143,48 | ||||
| 2026-02-13 | 13F | Aptus Capital Advisors, LLC | 278 | 0,00 | 11 | 0,00 | ||||
| 2026-01-23 | 13F | Wallace Advisory Group, LLC | 5.706 | -13,68 | 233 | -4,90 | ||||
| 2026-02-12 | 13F | BlackRock, Inc. | 204 | 8 | ||||||
| 2025-11-14 | 13F/A | NorthRock Partners, LLC | 0 | -100,00 | 0 | |||||
| 2026-01-20 | 13F | Aspiriant, Llc | 6.294 | 0,00 | 257 | 1,98 | ||||
| 2026-02-13 | 13F | Seaside Wealth Management, Inc. | 11.716 | 1,62 | 479 | 3,24 | ||||
| 2026-01-29 | 13F | Concurrent Investment Advisors, LLC | 41.642 | 1.702 | ||||||
| 2026-02-12 | 13F | Pitcairn Co | 0 | -100,00 | 0 | |||||
| 2026-01-30 | 13F | Archer Investment Corp | 140 | 0,00 | 6 | 0,00 | ||||
| 2026-01-27 | 13F | Checchi Capital Advisers, LLC | 5.240 | 0,00 | 214 | 1,90 | ||||
| 2026-02-06 | 13F | IFP Advisors, Inc | 153 | 0,00 | 6 | 0,00 | ||||
| 2026-02-17 | 13F | Blair William & Co/il | 21.418 | 1,85 | 875 | 3,67 | ||||
| 2026-01-21 | 13F | Modera Wealth Management, LLC | 137.927 | 0,08 | 5.636 | 1,77 | ||||
| 2026-02-17 | 13F | Cape Investment Advisory, Inc. | 204 | 8 | ||||||
| 2026-02-06 | 13F | EverSource Wealth Advisors, LLC | 0 | -100,00 | 0 | |||||
| 2026-02-13 | 13F | Financial Network Wealth Advisors LLC | 2.328 | 0,00 | 95 | 2,15 | ||||
| 2026-02-10 | 13F/A | Northwestern Mutual Wealth Management Co | 30.457 | 0,67 | 1.244 | 2,39 | ||||
| 2026-01-12 | 13F | Rialto Wealth Management, LLC | 2.038 | 0,00 | 83 | 2,47 | ||||
| 2026-02-13 | 13F | McAdam, LLC | 87.757 | 0,08 | 3.586 | 1,76 | ||||
| 2026-02-10 | 13F | Operose Advisors LLC | 111 | 0,00 | 5 | 0,00 | ||||
| 2026-02-11 | 13F | Brand Asset Management Group, Inc. | 16.643 | -7,02 | 680 | -5,42 | ||||
| 2026-02-09 | 13F | Harbour Investments, Inc. | 53.770 | 0,84 | 2.197 | 2,57 | ||||
| 2026-02-06 | 13F | Covestor Ltd | 173 | 17,69 | 0 | |||||
| 2026-02-11 | 13F | Parallel Advisors, LLC | 4.320 | 0,00 | 177 | 1,73 | ||||
| 2026-01-21 | 13F | Portside Wealth Group, LLC | 33.916 | 52,51 | 1.386 | 55,10 | ||||
| 2026-02-13 | 13F | Morgan Stanley | 256.950 | -0,33 | 10.499 | 1,36 | ||||
| 2026-02-12 | 13F | Rossby Financial, LCC | 44 | -30,16 | 2 | -50,00 | ||||
| 2026-01-08 | 13F | Wealth Enhancement Advisory Services, Llc | 23.365 | 11,75 | 976 | 15,38 | ||||
| 2026-01-20 | 13F | American National Bank | 0 | -100,00 | 0 | |||||
| 2026-02-17 | 13F | Advisor Group Holdings, Inc. | 490.585 | -15,73 | 20.045 | -12,45 | ||||
| 2026-02-10 | 13F | REAP Financial Group, LLC | 136 | 0,00 | 6 | 0,00 | ||||
| 2026-01-22 | 13F | Richardson Financial Services Inc. | 19.298 | -1,06 | 953 | 21,71 | ||||
| 2026-02-06 | 13F | Cullen/frost Bankers, Inc. | 93.171 | -58,02 | 3.807 | -57,31 | ||||
| 2026-02-06 | 13F | Creative Financial Designs Inc /adv | 2.508 | 10,14 | 102 | 12,09 | ||||
| 2026-02-02 | 13F | Total Clarity Wealth Management, Inc. | 62.100 | 2,83 | 2.537 | 4,58 | ||||
| 2026-02-10 | 13F | Godfrey Financial Associates, Inc. | 51 | 2 | ||||||
| 2026-01-12 | 13F | AllSquare Wealth Management LLC | 465 | 0,00 | 19 | 5,88 | ||||
| 2026-02-12 | 13F | Brinker Capital Investments, LLC | 30.848 | -8,70 | 1.260 | -7,15 | ||||
| 2026-02-13 | 13F | National Bank Of Canada /fi/ | 650 | 0,00 | 27 | 0,00 | ||||
| 2026-01-21 | 13F | Sowell Financial Services LLC | 5.103 | 1,31 | 208 | 2,97 | ||||
| 2026-01-13 | 13F | Signal Advisors Wealth, LLC | 56.832 | 6,42 | 2.322 | 8,25 | ||||
| 2026-01-20 | 13F | October Effect Ltd | 4.962 | 203 | ||||||
| 2026-02-06 | 13F | Eqis Capital Management, Inc. | 5.982 | -44,94 | 244 | -44,04 | ||||
| 2026-02-13 | 13F | Arete Wealth Advisors, LLC | 60.897 | 5,55 | 2 | 0,00 | ||||
| 2026-01-26 | 13F | Berkeley, Inc | 5.746 | -2,48 | 235 | -0,85 | ||||
| 2026-02-10 | 13F | Savant Capital, LLC | 219.550 | -36,55 | 8.971 | -35,48 | ||||
| 2026-02-06 | 13F | Axxcess Wealth Management, Llc | 34.466 | 142,36 | 1.408 | 146,58 | ||||
| 2026-02-19 | 13F | CI Private Wealth, LLC | 15.201 | 45,70 | 622 | 48,45 | ||||
| 2026-01-28 | 13F | N.E.W. Advisory Services LLC | 237.691 | 24,06 | 9.712 | 26,16 | ||||
| 2026-02-12 | 13F | Mason Investment Advisory Services, Inc. | 6.221 | 1,17 | 254 | 2,83 | ||||
| 2026-02-13 | 13F | SRS Capital Advisors, Inc. | 103 | 4 | ||||||
| 2026-01-28 | 13F | Alesco Advisors Llc | 27.163 | -2,83 | 1.110 | -1,25 | ||||
| 2026-01-27 | 13F | Fortis Capital Advisors, LLC | 5.082 | 0,00 | 208 | 1,47 | ||||
| 2026-02-13 | 13F | Smartleaf Asset Management LLC | 3.346 | 13,08 | 137 | 16,10 | ||||
| 2026-01-14 | 13F | Accurate Wealth Management, LLC | 7.184 | -0,01 | 302 | 4,88 | ||||
| 2025-11-03 | 13F | Townsquare Capital Llc | 17.192 | -41,32 | 691 | -36,64 | ||||
| 2026-02-11 | 13F | Capital Analysts, Inc. | 7.192 | 0,00 | 0 | |||||
| 2026-02-04 | 13F | Independent Advisor Alliance | 25.793 | 11,84 | 1.054 | 13,71 | ||||
| 2026-03-05 | 13F | Gunpowder Capital Management, LLC dba Oliver Wealth Management | 3.035 | 124 | ||||||
| 2026-01-14 | 13F | Moisand Fitzgerald Tamayo, LLC | 2.629 | -18,18 | 107 | -17,05 | ||||
| 2026-02-02 | 13F | TCI Wealth Advisors, Inc. | 8.318 | 0,00 | 340 | 1,50 | ||||
| 2026-02-09 | 13F | Frazier Financial Advisors, LLC | 118 | 1,72 | 5 | 0,00 | ||||
| 2026-01-23 | 13F | Smith, Moore & Co. | 32.656 | -0,51 | 1.334 | 1,21 | ||||
| 2026-02-17 | 13F | United Capital Financial Advisers, Llc | 13.723 | 0,00 | 561 | 1,63 | ||||
| 2026-01-30 | 13F | Sigma Planning Corp | 8.748 | 37,50 | 357 | 40,00 | ||||
| 2026-02-17 | 13F | Creative Planning | 284.257 | -3,86 | 11.615 | -2,23 | ||||
| 2026-02-05 | 13F | Mission Wealth Management, Lp | 75.293 | -0,37 | 3.076 | 1,32 | ||||
| 2026-01-21 | 13F | Capital Advisors, Ltd. LLC | 3.825 | 0,00 | 0 | |||||
| 2026-01-20 | 13F | Maryland Capital Advisors Inc. | 253 | 0,00 | 10 | 0,00 | ||||
| 2026-01-21 | 13F | Raleigh Capital Management Inc. | 33.855 | 12,67 | 1.383 | 14,58 | ||||
| 2026-02-17 | 13F | Cetera Investment Advisers | 548.620 | 3,90 | 22.417 | 5,66 | ||||
| 2026-02-18 | 13F | GWM Advisors LLC | 68.961 | -2,80 | 2.818 | -1,16 | ||||
| 2026-01-16 | 13F | Crewe Advisors LLC | 1.929 | 0,00 | 79 | 1,30 | ||||
| 2026-01-22 | 13F | Trilogy Capital Inc. | 15.092 | -5,56 | 617 | -4,05 | ||||
| 2026-02-12 | 13F | Wealthspire Advisors, LLC | 16.885 | 0,37 | 690 | 2,07 | ||||
| 2026-01-29 | 13F | UBS Group AG | 134.581 | 1,96 | 5.499 | 3,68 | ||||
| 2026-02-05 | 13F | Allworth Financial LP | 1.652 | -8,02 | 68 | -6,94 | ||||
| 2026-02-06 | 13F | Redmont Wealth Advisors Llc | 15 | 0,00 | 1 | |||||
| 2026-02-02 | 13F | CX Institutional | 180.319 | 1,63 | 7 | 0,00 | ||||
| 2026-02-12 | 13F | Principal Securities, Inc. | 10.201 | 171,66 | 417 | 177,33 | ||||
| 2026-01-27 | 13F | Institute for Wealth Management, LLC. | 5.405 | 0,00 | 221 | 1,38 | ||||
| 2026-02-04 | 13F | Pure Financial Advisors, Inc. | 84.479 | -1,47 | 3.452 | 0,20 | ||||
| 2026-02-12 | 13F | Chilton Capital Management Llc | 243 | 0,00 | 10 | 0,00 | ||||
| 2026-01-07 | 13F | Boston Standard Wealth Management, LLC | 9.160 | -8,55 | 374 | -6,97 | ||||
| 2026-01-20 | 13F | AdvisorNet Financial, Inc | 1.295 | 0,54 | 53 | 1,96 | ||||
| 2026-01-21 | 13F | TOWER TRUST & INVESTMENT Co | 370 | 15 | ||||||
| 2026-02-10 | 13F | One Capital Management, LLC | 8.403 | -26,58 | 343 | -25,27 | ||||
| 2026-02-13 | 13F | Mill Creek Capital Advisors, LLC | 47.111 | 0,00 | 1.925 | 1,69 | ||||
| 2026-02-11 | 13F | Jpmorgan Chase & Co | 2.260 | 8,60 | 92 | 10,84 | ||||
| 2026-01-20 | 13F | Austin Private Wealth, LLC | 159.524 | 2,94 | 6.518 | 4,69 | ||||
| 2026-01-26 | 13F | Private Trust Co Na | 167 | -60,14 | 7 | -62,50 | ||||
| 2026-01-30 | 13F | Simplicity Wealth,LLC | 36.902 | 21,41 | 1.508 | 23,42 | ||||
| 2026-01-27 | 13F | Global Financial Private Client, LLC | 17.487 | 4,00 | 715 | 5,78 | ||||
| 2026-02-13 | 13F | Motiv8 Investments LLC | 18 | 0 | ||||||
| 2026-01-08 | 13F | Maridea Wealth Management LLC | 11.126 | 0,41 | 455 | 0,89 | ||||
| 2026-02-06 | 13F | Envestnet Portfolio Solutions, Inc. | 545.696 | 3,52 | 22.297 | 5,27 | ||||
| 2026-02-17 | 13F | Ancora Advisors, LLC | 886 | 0,00 | 36 | 2,86 | ||||
| 2026-02-03 | 13F | RFG Advisory, LLC | 35.257 | -0,92 | 1.441 | 0,77 | ||||
| 2026-02-03 | 13F | Lmcg Investments, Llc | 45.200 | 0,00 | 1.847 | 1,65 | ||||
| 2026-02-03 | 13F | Farmers & Merchants Investments Inc | 360 | 0,00 | 15 | 0,00 | ||||
| 2026-02-04 | 13F | Wsfs Capital Management, Llc | 30.267 | -3,56 | 1.237 | -1,98 | ||||
| 2026-02-11 | 13F | LPL Financial LLC | 1.220.704 | -3,17 | 49.878 | -1,53 | ||||
| 2026-02-13 | 13F | Commerce Bank | 197.221 | -5,39 | 8.058 | -3,79 | ||||
| 2025-10-28 | 13F | Csenge Advisory Group | 0 | -100,00 | 0 | -100,00 | ||||
| 2026-01-16 | 13F | Aspire Private Capital, LLC | 69.966 | 0,86 | 2.859 | 2,55 | ||||
| 2026-01-21 | 13F | BIP Wealth, LLC | 116.146 | 0,13 | 4.746 | 1,82 | ||||
| 2026-02-10 | 13F | Root Financial Partners, LLC | 659 | -35,58 | 27 | -36,59 | ||||
| 2026-02-03 | 13F | Apeiron RIA LLC | 5.362 | -1,45 | 233 | 6,91 | ||||
| 2026-02-13 | 13F | Landmark Wealth Management, Inc. | 74.421 | 6,68 | 3.041 | 8,49 | ||||
| 2026-02-11 | 13F | Empowered Funds, LLC | 2.241 | 92 | ||||||
| 2026-02-17 | 13F | Jones Financial Companies Lllp | 6.760 | 64,16 | 276 | 67,27 | ||||
| 2026-02-13 | 13F | Novus Advisors, Llc | 17.270 | -1,28 | 706 | 0,43 | ||||
| 2026-01-22 | 13F | Networth Advisors, LLC | 7 | 0 | ||||||
| 2026-02-13 | 13F | Mml Investors Services, Llc | 34.115 | 38,35 | 1.394 | 40,71 | ||||
| 2026-02-03 | 13F | Legacy Wealth Managment, LLC/ID | 0 | -100,00 | 0 | |||||
| 2026-02-17 | 13F | Safe Harbor Fiduciary, LLC | 274 | 4,98 | 11 | 22,22 | ||||
| 2026-01-08 | 13F | Financial Management Network Inc | 0 | -100,00 | 0 | |||||
| 2026-01-28 | 13F | StoryOne LLC | 0 | 278 | ||||||
| 2026-02-12 | 13F | Hibernia Wealth Partners, LLC | 10.885 | 96,69 | 445 | 100,00 | ||||
| 2026-02-17 | 13F | Qube Research & Technologies Ltd | 2 | 0,00 | 0 | |||||
| 2026-01-29 | 13F | Sanctuary Advisors, LLC | 31.995 | -10,77 | 1.307 | -9,24 | ||||
| 2026-02-04 | 13F | Ameritas Advisory Services, LLC | 0 | -100,00 | 0 | |||||
| 2026-02-11 | 13F | O'shaughnessy Asset Management, Llc | 936 | 102,60 | 38 | 111,11 | ||||
| 2026-02-17 | 13F | Ameriflex Group, Inc. | 106 | -49,04 | 4 | -50,00 | ||||
| 2025-11-14 | 13F | Strategic Wealth Partners, Ltd. | 348 | 0,00 | 14 | 8,33 | ||||
| 2026-02-06 | 13F | Global Retirement Partners, LLC | 11.070 | 13,17 | 452 | 15,01 | ||||
| 2026-01-26 | 13F | Discipline Wealth Solutions, LLC | 9.601 | 7,71 | 392 | 9,50 | ||||
| 2026-02-13 | 13F | Wells Fargo & Company/mn | 339.958 | 1,39 | 13.891 | 3,10 | ||||
| 2026-02-17 | 13F | Northern Trust Corp | 103.838 | 128,19 | 4.243 | 132,06 | ||||
| 2026-01-30 | 13F | Us Bancorp \de\ | 0 | -100,00 | 0 | |||||
| 2026-01-09 | 13F | Capital CS Group, LLC | 5.328 | 5,84 | 218 | 7,43 | ||||
| 2026-02-02 | 13F | Breakwater Investment Management | 122 | 5 | ||||||
| 2026-02-09 | 13F | Key FInancial Inc | 10.585 | 0,00 | 433 | 1,41 | ||||
| 2026-02-12 | 13F | Triumph Capital Management | 3.124 | 0,81 | 128 | 2,42 | ||||
| 2026-02-12 | 13F | Hollencrest Capital Management | 2.132 | 0,00 | 87 | 2,35 | ||||
| 2026-02-13 | 13F | Nicolet Advisory Services, Llc | 4.910 | 208 | ||||||
| 2026-01-06 | 13F | Advance Capital Management, Inc. | 7.174 | -13,74 | 293 | -12,28 | ||||
| 2026-01-14 | 13F | Camelot Technology Advisors, Inc. | 19.449 | 20,46 | 795 | 22,53 | ||||
| 2026-02-03 | 13F | Strategic Wealth Advisors LLC | 4.784 | 0 | ||||||
| 2026-01-29 | 13F | Quent Capital, LLC | 9.411 | -2,56 | 385 | -1,03 | ||||
| 2026-01-26 | 13F | Merit Financial Group, LLC | 6.290 | -66,43 | 257 | -65,96 | ||||
| 2026-02-17 | 13F | Susquehanna International Group, Llp | 11.211 | -77,49 | 458 | -77,11 | ||||
| 2026-01-23 | 13F | Assetmark, Inc | 459.887 | -1,12 | 18.791 | 0,55 | ||||
| 2026-02-03 | 13F | Ballentine Partners, LLC | 55.535 | 0,00 | 2.269 | 1,70 | ||||
| 2026-02-06 | 13F | Evoke Wealth, Llc | 6.318 | 258 | ||||||
| 2026-02-10 | 13F | Murphy & Mullick Capital Management Corp | 4 | 0,00 | 0 | |||||
| 2026-02-05 | 13F | Atria Investments Llc | 7.290 | 31,52 | 298 | 33,78 | ||||
| 2026-01-23 | 13F | Farther Finance Advisors, LLC | 2.013 | 55,56 | 82 | 57,69 | ||||
| 2026-01-08 | 13F | Signet Financial Management, Llc | 0 | -100,00 | 0 | |||||
| 2026-01-16 | 13F | Balboa Wealth Partners | 6.400 | 2,38 | 262 | 3,98 | ||||
| 2026-02-17 | 13F | IHT Wealth Management, LLC | 45.143 | -8,32 | 1.860 | -5,97 | ||||
| 2026-02-04 | 13F | Advisor OS, LLC | 18.496 | 2,68 | 756 | 4,43 | ||||
| 2026-02-17 | 13F | Wellington Management Group Llp | 52.984 | 565,96 | 2.165 | 578,37 | ||||
| 2026-01-13 | 13F | Mather Group, Llc. | 30.377 | -0,03 | 1.241 | 1,72 | ||||
| 2026-01-21 | 13F | Lockerman Financial Group, Inc. | 11.930 | 2,04 | 487 | 3,84 | ||||
| 2026-02-09 | 13F | Narus Financial Partners, LLC | 0 | -100,00 | 0 | -100,00 | ||||
| 2026-02-17 | 13F | Private Advisor Group, LLC | 147.002 | 8,91 | 6.007 | 10,75 | ||||
| 2026-01-13 | 13F | CoreCap Advisors, LLC | 1.584 | -0,56 | 65 | 0,00 | ||||
| 2026-02-06 | 13F | Copia Wealth Management | 696 | 0,00 | 28 | 3,70 | ||||
| 2026-02-03 | 13F | Eclectic Associates Inc /adv | 8.364 | 0,00 | 342 | 1,49 | ||||
| 2026-02-13 | 13F | Change Path, LLC | 30.979 | 9,02 | 1.266 | 10,87 | ||||
| 2026-01-26 | 13F | AE Wealth Management LLC | 39.883 | 5,20 | 1.630 | 6,96 | ||||
| 2026-02-05 | 13F | AlphaCore Capital LLC | 100 | 0,00 | 4 | 0,00 | ||||
| 2026-01-05 | 13F | Park Avenue Securities Llc | 231.771 | 5,94 | 9 | 12,50 | ||||
| 2026-02-11 | 13F | Petersen Hastings Wealth Advisors Inc. | 11.166 | 456 | ||||||
| 2026-01-27 | 13F | Werba Rubin Papier Wealth Management | 17.237 | 0,10 | 704 | 1,88 | ||||
| 2026-02-17 | 13F | Cardiff Park Advisors, Llc | 39 | 0,00 | 2 | 0,00 | ||||
| 2026-02-06 | 13F | Larson Financial Group LLC | 11.615 | -0,71 | 475 | 0,85 | ||||
| 2026-01-21 | 13F | Stone House Investment Management, LLC | 272 | 1,49 | 11 | 10,00 | ||||
| 2026-02-12 | 13F | Commonwealth Equity Services, Llc | 80.655 | 3,02 | 3.296 | 109.733,33 | ||||
| 2026-02-10 | 13F | JMG Financial Group, Ltd. | 6.329 | 0,00 | 259 | 1,57 | ||||
| 2026-02-14 | 13F | Rockefeller Capital Management L.P. | 1.454 | 0,21 | 59 | 1,72 | ||||
| 2025-11-14 | 13F | Goldman Sachs Group Inc | 0 | -100,00 | 0 | |||||
| 2026-01-16 | 13F | Worth Financial Advisory Group, LLC | 7.750 | 0,99 | 317 | 2,60 | ||||
| 2026-01-27 | 13F | Vestia Personal Wealth Advisors | 13.911 | -0,50 | 595 | 5,88 | ||||
| 2026-02-12 | 13F | Keel Point, LLC | 5.318 | -2,81 | 217 | -0,91 | ||||
| 2026-01-23 | 13F | Optima Capital Llc | 186 | 8 | ||||||
| 2026-02-03 | 13F | Acorn Financial Advisory Services Inc /adv | 5.667 | 1,63 | 232 | 3,13 | ||||
| 2026-02-10 | 13F | Sentinus, LLC | 17.161 | -2,17 | 701 | -0,43 | ||||
| 2026-02-11 | 13F | Tiaa Trust, National Association | 364.087 | 10,84 | 14.877 | 12,71 | ||||
| 2026-02-06 | 13F | Kingdom Financial Group LLC. | 162 | 7 | ||||||
| 2026-02-13 | 13F | Citigroup Inc | 4.787 | 10,30 | 196 | 12,07 | ||||
| 2026-02-05 | 13F | Cambridge Investment Research Advisors, Inc. | 125.455 | 3,43 | 5 | 25,00 | ||||
| 2026-02-17 | 13F | Mercer Global Advisors Inc /adv | 5.335 | -15,80 | 218 | -14,17 | ||||
| 2026-01-14 | 13F | International Private Wealth Advisors LLC | 12.188 | 1,21 | 498 | 2,90 | ||||
| 2026-02-17 | 13F | Royal Bank Of Canada | 7.372 | -16,62 | 301 | -15,45 | ||||
| 2026-01-21 | 13F | Walkner Condon Financial Advisors LLC | 21.663 | -0,30 | 885 | 1,37 | ||||
| 2026-02-17 | 13F | Raymond James Financial Inc | 33.115 | 2,57 | 1.353 | 4,32 | ||||
| 2026-02-13 | 13F | Mariner, LLC | 13.404 | 1,41 | 548 | 3,01 | ||||
| 2026-02-17 | 13F | Cresset Asset Management, LLC | 27.101 | 1,62 | 1.107 | 3,36 | ||||
| 2026-01-14 | 13F | Jfs Wealth Advisors, Llc | 2.452 | 100 | ||||||
| 2026-02-03 | 13F | Fsb Premier Wealth Management, Inc. | 21.588 | -0,92 | 882 | 0,80 | ||||
| 2026-02-13 | 13F | Tobias Financial Advisors, Inc. | 99.058 | -0,87 | 4.047 | 0,80 | ||||
| 2026-01-14 | 13F | Spire Wealth Management | 29.208 | -5,16 | 1.193 | -3,56 | ||||
| 2026-02-06 | 13F | HighTower Advisors, LLC | 44.963 | 9,51 | 1.837 | 11,40 | ||||
| 2026-02-13 | 13F | Golden State Wealth Management, LLC | 42 | 0,00 | 2 | 0,00 | ||||
| 2025-11-12 | 13F | Bellwether Advisors, LLC | 0 | -100,00 | 0 | |||||
| 2026-02-05 | 13F | Accredited Investors Inc. | 42.640 | 0,00 | 1.742 | 1,69 | ||||
| 2026-02-05 | 13F | Landmark Wealth Management, LLC | 9.941 | 0,35 | 406 | 2,01 | ||||
| 2026-02-17 | 13F | Advisory Services Network, LLC | 7.717 | 27,36 | 315 | 29,63 | ||||
| 2026-02-18 | 13F | Caitlin John, LLC | 1.337 | 1,67 | 55 | 3,85 | ||||
| 2026-02-10 | 13F | Envestnet Asset Management Inc | 795.373 | -7,78 | 32.499 | -6,22 | ||||
| 2026-02-06 | 13F | Addison Advisors LLC | 81 | 0,00 | 3 | 0,00 | ||||
| 2026-02-13 | 13F | Pitcairn Wealth Advisors LLC | 10.237 | 418 | ||||||
| 2026-02-17 | 13F | Fmr Llc | 159.173 | 4,99 | 6.504 | 6,76 | ||||
| 2026-01-12 | 13F | VisionPoint Advisory Group, LLC | 20.667 | 10,37 | 844 | 12,23 | ||||
| 2026-01-14 | 13F | Wealthcare Advisory Partners LLC | 51.402 | -12,40 | 2.100 | -10,90 | ||||
| 2026-01-23 | 13F | Sage Mountain Advisors LLC | 1.198 | 0,00 | 49 | 0,00 | ||||
| 2026-02-09 | 13F | Cary Street Partners Financial Llc | 32.240 | 0,00 | 1.317 | 1,70 | ||||
| 2026-02-13 | 13F | Colony Group, LLC | 16.508 | -0,26 | 675 | 1,35 | ||||
| 2026-01-20 | 13F | Thurston, Springer, Miller, Herd & Titak, Inc. | 200 | 8 | ||||||
| 2026-01-29 | 13F | Comerica Bank | 2.896 | 0,07 | 118 | 1,72 | ||||
| 2025-10-29 | 13F | Family Wealth Group, LLC | 0 | -100,00 | 0 | |||||
| 2026-01-13 | 13F | Norden Group Llc | 8.784 | 0,76 | 359 | 2,29 | ||||
| 2026-02-05 | 13F | USAdvisors Wealth Management, LLC | 6.557 | 0,99 | 0 | |||||
| 2026-02-17 | 13F | GeoWealth Management, LLC | 15.387 | 2,04 | 629 | 3,80 | ||||
| 2026-02-12 | 13F | Richard W. Paul & Associates, LLC | 2.863 | -9,83 | 117 | -8,66 | ||||
| 2026-02-17 | 13F | Tower Research Capital LLC (TRC) | 0 | -100,00 | 0 | |||||
| 2026-01-26 | 13F | Iams Wealth Management, Llc | 6.815 | -7,91 | 278 | -6,40 | ||||
| 2026-02-11 | 13F | Outlook Wealth Advisors, LLC | 10.170 | 1,72 | 416 | 3,49 | ||||
| 2026-02-17 | 13F | Bank Of America Corp /de/ | Put | 0 | -100,00 | 0 | ||||
| 2026-02-17 | 13F | SageView Advisory Group, LLC | 250 | 10 | ||||||
| 2026-01-29 | 13F | Quest 10 Wealth Builders, Inc. | 456 | 50,00 | 19 | 50,00 | ||||
| 2026-01-16 | 13F | First Pacific Financial | 158 | 1,94 | 6 | 0,00 | ||||
| 2026-02-17 | 13F | Hilltop Holdings Inc. | 5.894 | -4,10 | 241 | -2,44 | ||||
| 2026-01-27 | 13F | Belpointe Asset Management LLC | 36.169 | 134,41 | 1.478 | 138,61 | ||||
| 2026-02-17 | 13F | Equitable Holdings, Inc. | 110.036 | -51,42 | 4.496 | -50,59 | ||||
| 2025-11-06 | 13F | LexAurum Advisors, LLC | 6.491 | 1,61 | 261 | 9,70 | ||||
| 2026-01-22 | 13F | CarsonAllaria Wealth Management, Ltd. | 103.478 | 0,44 | 4.228 | 2,15 | ||||
| 2026-02-09 | 13F | Valtinson Bruner Financial Planning LLC | 8.332 | -5,82 | 340 | -4,23 | ||||
| 2026-02-03 | 13F | Cassaday & Co Wealth Management LLC | 23.168 | 0,00 | 947 | 1,72 | ||||
| 2026-02-11 | 13F | Cerity Partners LLC | 177.262 | 0,01 | 7.243 | 1,70 | ||||
| 2026-01-26 | 13F | Asset Dedication, LLC | 9.303 | -1,74 | 380 | 0,00 | ||||
| 2026-02-13 | 13F | Kestra Advisory Services, LLC | 0 | -100,00 | 0 | |||||
| 2026-01-21 | 13F | Apella Capital, LLC | 6.473 | 0,03 | 265 | 1,54 | ||||
| 2026-01-29 | 13F | Golden State Equity Partners | 7.293 | 298 | ||||||
| 2026-02-02 | 13F | Allegheny Financial Group LTD | 9.156 | 374 | ||||||
| 2026-02-12 | 13F | Steward Partners Investment Advisory, Llc | 61 | -85,58 | 2 | -87,50 | ||||
| 2025-09-23 | NP | CSQIX - MANTEIO MULTIALTERNATIVE STRATEGY FUND Class I Shares | 12.810 | 478 | ||||||
| 2025-11-12 | 13F | Transce3nd, LLC | 0 | -100,00 | 0 | |||||
| 2026-02-11 | 13F | GFS Advisors, LLC | 12.055 | 493 | ||||||
| 2026-02-17 | 13F | Bank Of America Corp /de/ | 579.913 | 2,68 | 23.695 | 4,42 | ||||
| 2026-01-20 | 13F | Ascent Group, LLC | 12.617 | -3,04 | 516 | -1,34 | ||||
| 2026-01-22 | 13F | Apollon Wealth Management, LLC | 14.068 | -0,71 | 575 | 0,88 | ||||
| 2026-01-23 | 13F | Stonehaven Wealth & Tax Solutions, Llc | 42.570 | -3,57 | 1.739 | -1,92 | ||||
| 2026-02-04 | 13F | Urban Financial Advisory Corp | 13.686 | 1,63 | 559 | 3,33 | ||||
| 2026-02-03 | 13F | Sequoia Financial Advisors, LLC | 7.678 | -0,81 | 314 | 0,64 | ||||
| 2026-01-27 | 13F | Probity Advisors, Inc. | 29.359 | 2,41 | 1.200 | 4,17 | ||||
| 2026-01-28 | 13F | Quent Long Short Global Small Cap Fund, LP | 9.411 | 385 | ||||||
| 2025-11-14 | 13F | Flow Traders U.s. Llc | 0 | -100,00 | 0 | |||||
| 2026-01-22 | 13F | Upper Left Wealth Management, LLC | 32.490 | 7,36 | 1.328 | 9,22 | ||||
| 2026-02-06 | 13F | Pnc Financial Services Group, Inc. | 55.257 | 5,50 | 2.258 | 7,27 | ||||
| 2026-02-12 | 13F | Betterment LLC | 10.787 | 8,93 | 0 | |||||
| 2026-01-26 | 13F | Valmark Advisers, Inc. | 41.963 | -1,75 | 1.715 | -0,12 | ||||
| 2026-02-13 | 13F | Pinnacle Wealth Planning Services, Inc. | 4.212 | -20,78 | 172 | -19,25 | ||||
| 2026-01-28 | 13F | Omega Financial Group, LLC | 6.316 | 1,10 | 258 | 2,79 | ||||
| 2026-01-26 | 13F | Cwm, Llc | 2.968 | 5,77 | 0 | |||||
| 2026-02-17 | 13F | Citadel Advisors Llc | 61.294 | -41,60 | 2.504 | -40,62 | ||||
| 2026-01-21 | 13F | Flagship Harbor Advisors, Llc | 906 | 37 | ||||||
| 2026-01-26 | 13F | Austin Wealth Management, LLC | 6.816 | -0,31 | 285 | 4,40 | ||||
| 2026-02-13 | 13F | MAI Capital Management | 108.786 | 0,47 | 4.445 | 2,16 | ||||
| 2026-02-17 | 13F | Legacy Wealth Partners, LLC | 18.352 | 750 | ||||||
| 2026-02-13 | 13F | Eagle Bluffs Wealth Management LLC | 0 | -100,00 | 0 | |||||
| 2026-02-19 | 13F | WealthPoint Financial, LLC | 7.099 | 290 | ||||||
| 2026-02-12 | 13F | Bank Of Montreal /can/ | 17.771 | 0,00 | 726 | 1,68 |