Grundlæggende statistik
| Institutionelle ejere | 102 total, 102 long only, 0 short only, 0 long/short - change of -1,90% MRQ |
| Gennemsnitlig porteføljeallokering | 0.0320 % - change of 55,81% MRQ |
| Institutionelle aktier (lange) | 6.989.146 (ex 13D/G) - change of 0,05MM shares 0,75% MRQ |
| Institutionel værdi (lang) | $ 38.225 USD ($1000) |
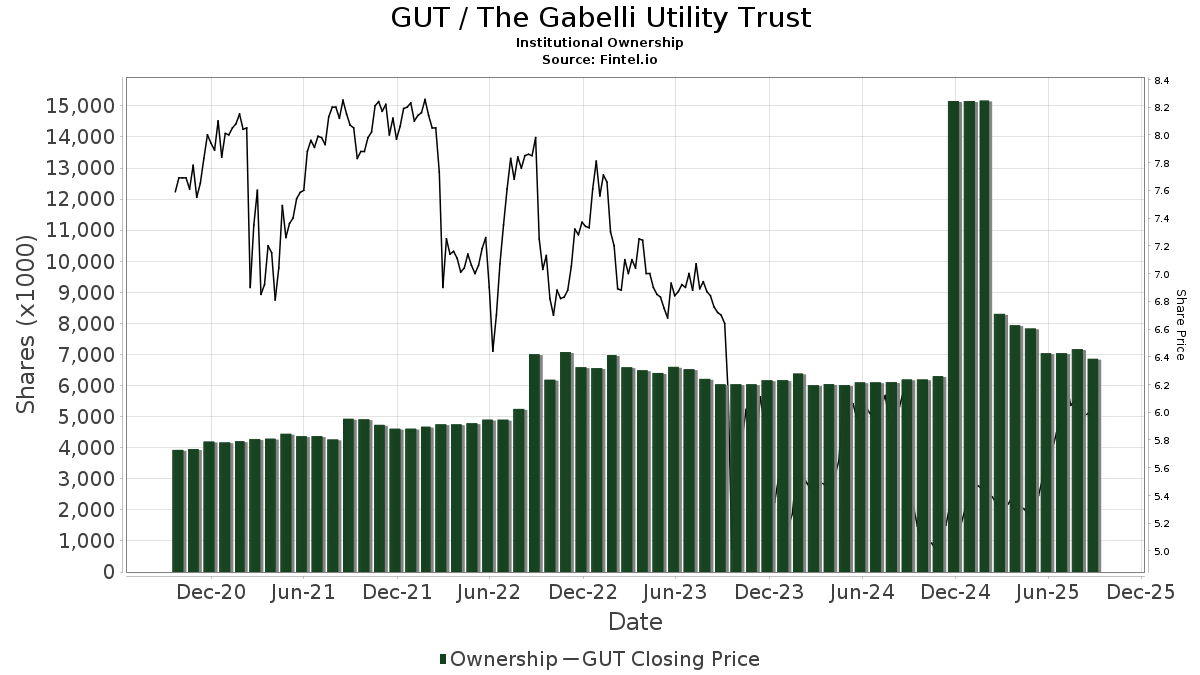
Institutionelt ejerskab og aktionærer
The Gabelli Utility Trust (US:GUT) har 102 institutionelle ejere og aktionærer, der har indsendt 13D/G- eller 13F-formularer til Securities Exchange Commission (SEC). Disse institutioner har i alt 6,989,146 aktier. Største aktionærer omfatter Commonwealth Equity Services, Llc, LPL Financial LLC, Morgan Stanley, Advisor Group Holdings, Inc., Cambridge Investment Research Advisors, Inc., Gamco Investors, Inc. Et Al, Plus Group Wealth Advisors LLC, Cetera Investment Advisers, Janney Montgomery Scott LLC, and Raymond James Financial Inc .
The Gabelli Utility Trust (NYSE:GUT) institutionel ejerskabsstruktur viser aktuelle positioner i virksomheden efter institutioner og fonde, samt seneste ændringer i positionsstørrelse. Større aktionærer kan omfatte individuelle investorer, investeringsforeninger, hedgefonde eller institutioner. Skema 13D angiver, at investoren besidder (eller besidder) mere end 5 % af virksomheden og har til hensigt (eller har til hensigt at) aktivt at forfølge en ændring i forretningsstrategi. Skema 13G indikerer en passiv investering på over 5%.
The share price as of April 24, 2026 is 6,16 / share. Previously, on April 28, 2025, the share price was 5,30 / share. This represents an increase of 16,23% over that period.
Fondens stemningsscore
Fund Sentiment Score (fka Ownership Accumulation Score) finder de aktier, der bliver mest købt af fonde. Det er resultatet af en sofistikeret, multi-faktor kvantitativ model, der identificerer virksomheder med de højeste niveauer af institutionel akkumulering. Scoringsmodellen bruger en kombination af den samlede stigning i oplyste ejere, ændringerne i porteføljeallokeringer i disse ejere og andre målinger. Tallet går fra 0 til 100, hvor højere tal indikerer et højere niveau af akkumulering for sine jævnaldrende, og 50 er gennemsnittet.
Opdateringsfrekvens: Dagligt
Se Ownership Explorer, som giver en liste over højest rangerende virksomheder.
AI+ Ask Fintel’s AI assistant about The Gabelli Utility Trust.
Select a question to share a public post with an AI-crafted answer.
Thinking of good questions…
Institutionel Put/Call-forhold
Ud over at indberette standardaktie- og gældsudstedelser skal institutter med mere end 100 mill. aktiver under forvaltning også oplyse deres put- og call-optionsbeholdninger. Da salgsoptioner generelt indikerer negativ stemning, og købsoptioner indikerer positiv stemning, kan vi få en fornemmelse af den overordnede institutionelle stemning ved at plotte forholdet mellem put og kald. Diagrammet til højre viser det historiske put/call-forhold for dette instrument.
Brug af Put/Call Ratio som en indikator for investorernes stemning overvinder en af de vigtigste mangler ved at bruge totalt institutionelt ejerskab, som er, at en betydelig mængde af aktiver under forvaltning investeres passivt for at spore indekser. Passivt forvaltede fonde køber typisk ikke optioner, så indikatoren for put/call-forholdet følger mere nøje følelsen af aktivt forvaltede fonde.
13F og NPORT arkivering
Detaljer om 13F-arkivering er gratis. Detaljer om NP-ansøgninger kræver et premium-medlemskab. Grønne rækker angiver nye positioner. Røde rækker angiver lukkede positioner. Klik på linket ikon for at se den fulde transaktionshistorik.
Opgrader
for at låse premium-data op og eksportere til Excel ![]() .
.
| Fil dato | Kilde | Investor | Type | Gennemsnitlig pris (Øst) |
Aktier | Δ Aktier (%) |
Rapporteret Værdi ($1000) |
Δ Værdi (%) |
Port Alloc (%) |
|
|---|---|---|---|---|---|---|---|---|---|---|
| 2026-04-07 | 13F | Plus Group Wealth Advisors LLC | 179.271 | 0,70 | 1.085 | 1,03 | ||||
| 2026-02-19 | 13F | Atomi Financial Group, Inc. | 27.980 | 169 | ||||||
| 2026-02-04 | 13F | Boyd Watterson Asset Management Llc/oh | 720 | 0,00 | 4 | 0,00 | ||||
| 2026-02-09 | 13F | Integrity Alliance, Llc. | 22.632 | 0,27 | 136 | -0,73 | ||||
| 2026-04-06 | 13F | Highline Wealth Partners Llc | 380 | 0,00 | 2 | 0,00 | ||||
| 2026-02-13 | 13F | Baird Financial Group, Inc. | 35.859 | 0,08 | 216 | -0,46 | ||||
| 2026-01-26 | 13F | Liberty Capital Management, Inc. | 10.000 | 0,00 | 60 | 0,00 | ||||
| 2026-02-11 | 13F | LPL Financial LLC | 943.220 | -3,87 | 5.688 | -4,50 | ||||
| 2026-04-10 | 13F | Eagle Wealth Strategies Llc | 18.138 | 0,00 | 110 | 0,00 | ||||
| 2026-04-22 | 13F | Motco | 14.277 | 0,00 | 86 | 0,00 | ||||
| 2026-04-08 | 13F | Dynamic Advisor Solutions LLC | 19.382 | 9,19 | 117 | 9,35 | ||||
| 2026-02-06 | 13F | HighTower Advisors, LLC | 13.306 | 5,73 | 80 | 5,26 | ||||
| 2026-02-13 | 13F | Stifel Financial Corp | 26.555 | -4,15 | 160 | -4,76 | ||||
| 2026-04-02 | 13F | Marex Group plc | 0 | -100,00 | 0 | |||||
| 2026-04-13 | 13F | IFP Advisors, Inc | 2.662 | 0,00 | 16 | 0,00 | ||||
| 2026-02-03 | 13F | Vantage Financial Partners, LLC | 16.771 | -4,22 | 101 | -4,72 | ||||
| 2026-02-13 | 13F | Coco Enterprises, LLC | 27.437 | 0,00 | 165 | -0,60 | ||||
| 2026-04-07 | 13F | Farther Finance Advisors, LLC | 450 | 0,00 | 3 | 0,00 | ||||
| 2026-01-21 | 13F | Sound Income Strategies, LLC | 55 | 0,00 | 0 | |||||
| 2026-02-09 | 13F | MTM Investment Management, LLC | 922 | 0,00 | 6 | 0,00 | ||||
| 2026-02-09 | 13F | Huntington National Bank | 0 | |||||||
| 2025-11-06 | 13F | Ameritas Advisory Services, LLC | 0 | -100,00 | 0 | -100,00 | ||||
| 2026-02-05 | 13F | Everstar Asset Management, LLC | 0 | -100,00 | 0 | |||||
| 2026-02-12 | 13F | Jane Street Group, Llc | 15.413 | 39,74 | 93 | 39,39 | ||||
| 2026-04-08 | 13F | Pines Wealth Management, LLC | 50.000 | 0,00 | 302 | 0,33 | ||||
| 2026-02-17 | 13F | Advisory Services Network, LLC | 0 | -100,00 | 0 | |||||
| 2026-02-02 | 13F | Fifth Third Bancorp | 2.500 | 0,00 | 15 | 0,00 | ||||
| 2026-02-06 | 13F | Pathway Financial Advisers, LLC | 0 | -100,00 | 0 | |||||
| 2025-11-14 | 13F | Hrt Financial Lp | 0 | -100,00 | 0 | |||||
| 2026-04-08 | 13F | Miracle Mile Advisors, LLC | 0 | -100,00 | 0 | |||||
| 2026-02-11 | 13F | Commonwealth Retirement Investments LLC | 618 | 4 | ||||||
| 2026-01-26 | 13F | Cwm, Llc | 2.699 | 6,30 | 0 | |||||
| 2026-02-06 | 13F | Global Retirement Partners, LLC | 0 | -100,00 | 0 | |||||
| 2026-02-17 | 13F | Royal Bank Of Canada | 39.576 | -3,87 | 239 | -4,40 | ||||
| 2026-02-18 | 13F/A | Virtue Capital Management, LLC | 91.666 | 92,49 | 555 | -93,06 | ||||
| 2025-11-14 | 13F | Arlington Capital Management, Inc. | 0 | -100,00 | 0 | |||||
| 2026-01-12 | 13F | VisionPoint Advisory Group, LLC | 54.658 | -20,32 | 330 | -20,91 | ||||
| 2026-01-29 | 13F | Comerica Bank | 258 | 2 | ||||||
| 2026-02-04 | 13F | Community Bank, N.A. | 330 | 0,00 | 2 | -50,00 | ||||
| 2026-02-17 | 13F | Cetera Investment Advisers | 152.030 | 28,87 | 917 | 27,93 | ||||
| 2025-11-05 | 13F | Moloney Securities Asset Management, LLC | 10.426 | 0,00 | 63 | 5,00 | ||||
| 2026-02-10 | 13F | Moors & Cabot, Inc. | 10.000 | 0,00 | 60 | 0,00 | ||||
| 2026-02-17 | 13F | Pinnacle Financial Partners, Inc. | 15.076 | 91 | ||||||
| 2025-10-28 | 13F | MAS Advisors LLC | 74.512 | 10,24 | 452 | 15,31 | ||||
| 2026-01-29 | 13F | UBS Group AG | 29.528 | -9,18 | 178 | -9,64 | ||||
| 2026-02-13 | 13F | Kestra Advisory Services, LLC | 0 | -100,00 | 0 | |||||
| 2026-04-07 | 13F | CoreCap Advisors, LLC | 99.791 | 28,99 | 604 | 29,40 | ||||
| 2026-04-09 | 13F | Leverty Financial Group, LLC | 31.267 | 0,00 | 189 | 0,53 | ||||
| 2026-02-06 | 13F | Mach-1 Financial Group, Inc. | 0 | -100,00 | 0 | |||||
| 2026-02-10 | 13F/A | Northwestern Mutual Wealth Management Co | 753 | 0,00 | 5 | 0,00 | ||||
| 2026-02-09 | 13F | Harbour Investments, Inc. | 344 | 0,00 | 2 | 0,00 | ||||
| 2026-04-23 | 13F | Farmers & Merchants Investments Inc | 4.344 | 0,00 | 26 | 0,00 | ||||
| 2026-02-26 | 13F | Anchor Investment Management, LLC | 5.000 | 0,00 | 30 | 0,00 | ||||
| 2026-01-23 | 13F | Assetmark, Inc | 730 | 0,00 | 4 | 0,00 | ||||
| 2026-02-10 | 13F | Rothschild Investment Llc | 41.294 | 0,00 | 249 | -0,40 | ||||
| 2026-01-30 | 13F | Us Bancorp \de\ | 138 | 0,00 | 1 | |||||
| 2026-02-13 | 13F | Mml Investors Services, Llc | 14.642 | 0,05 | 88 | 0,00 | ||||
| 2026-02-18 | 13F | GWM Advisors LLC | 17.189 | 261,87 | 104 | 267,86 | ||||
| 2026-04-21 | 13F | Wedbush Securities Inc | 94.087 | 26,54 | 1 | |||||
| 2026-04-24 | 13F | Root Financial Partners, LLC | 1.332 | 0,00 | 8 | 0,00 | ||||
| 2026-04-15 | 13F | Nations Financial Group Inc, /ia/ /adv | 52.741 | 0,00 | 319 | 0,31 | ||||
| 2026-02-05 | 13F | Cambridge Investment Research Advisors, Inc. | 410.070 | 14,38 | 2 | 0,00 | ||||
| 2026-02-17 | 13F | Advisor Group Holdings, Inc. | 411.891 | 30,13 | 2.484 | 32,00 | ||||
| 2026-02-17 | 13F | Captrust Financial Advisors | 45.760 | 294,69 | 276 | 292,86 | ||||
| 2026-04-17 | 13F | AdvisorNet Financial, Inc | 1.513 | 2,51 | 9 | 12,50 | ||||
| 2026-02-13 | 13F | Zinnia Wealth Advisory, LLC | 19.378 | 117 | ||||||
| 2026-02-12 | 13F | Federation des caisses Desjardins du Quebec | 68 | 0,00 | 0 | |||||
| 2026-02-03 | 13F | International Assets Investment Management, Llc | 94.631 | 0,00 | 571 | 3,45 | ||||
| 2026-01-20 | 13F | Stratos Wealth Partners, LTD. | 27.982 | -23,22 | 169 | -23,98 | ||||
| 2026-02-04 | 13F | BCJ Capital Management, LLC | 11.060 | 0,00 | 67 | -1,49 | ||||
| 2026-02-12 | 13F | Mount Yale Investment Advisors, LLC | 13.500 | 0,00 | 81 | 0,00 | ||||
| 2026-02-17 | 13F | Susquehanna International Group, Llp | 15.430 | 93 | ||||||
| 2026-04-08 | 13F | Wealth Enhancement Advisory Services, Llc | 27.782 | -57,90 | 166 | -58,85 | ||||
| 2026-04-20 | 13F | SILVER OAK SECURITIES, Inc | 20.546 | 28,03 | 124 | 27,84 | ||||
| 2026-02-17 | 13F | Bank Of America Corp /de/ | 29.628 | -9,89 | 179 | -10,55 | ||||
| 2026-01-29 | 13F | D.a. Davidson & Co. | 24.458 | 44,29 | 147 | 44,12 | ||||
| 2026-02-06 | 13F | Pnc Financial Services Group, Inc. | 33.531 | 41,74 | 202 | 41,26 | ||||
| 2026-02-02 | 13F | Elite Wealth Management, Inc. | 0 | -100,00 | 0 | |||||
| 2026-01-20 | 13F | SOA Wealth Advisors, LLC. | 120 | 0,00 | 1 | |||||
| 2026-02-17 | 13F | Scarborough Advisors, LLC | 3.966 | 2,51 | 24 | 0,00 | ||||
| 2026-04-16 | 13F | Balboa Wealth Partners | 113.258 | 8,30 | 685 | 8,73 | ||||
| 2026-02-13 | 13F | SRS Capital Advisors, Inc. | 2.301 | 0,00 | 14 | 0,00 | ||||
| 2026-02-13 | 13F | Resources Management Corp /ct/ /adv | 1.601 | 0,00 | 0 | |||||
| 2025-11-07 | 13F | Synovus Financial Corp | 15.076 | 0,00 | 92 | 4,60 | ||||
| 2026-04-14 | 13F | Plancorp, LLC | 19.652 | 120 | ||||||
| 2026-02-17 | 13F | Ameriflex Group, Inc. | 9.600 | -50,00 | 58 | -50,86 | ||||
| 2026-01-26 | 13F | PFG Investments, LLC | 17.155 | 38,21 | 103 | 37,33 | ||||
| 2026-02-13 | 13F | Colony Group, LLC | 17.654 | 106 | ||||||
| 2026-01-23 | 13F | Optima Capital Llc | 90 | 1 | ||||||
| 2026-04-24 | 13F | RKL Wealth Management LLC | 25.000 | 0,00 | 151 | 0,67 | ||||
| 2026-02-10 | 13F | Envestnet Asset Management Inc | 57.888 | -9,25 | 349 | -9,82 | ||||
| 2026-02-17 | 13F/A | Kovack Advisors, Inc. | 58.582 | 353 | ||||||
| 2026-02-12 | 13F | Steward Partners Investment Advisory, Llc | 72.030 | -10,61 | 434 | -11,25 | ||||
| 2025-11-14 | 13F | Virtu Financial LLC | 0 | -100,00 | 0 | |||||
| 2026-02-09 | 13F | Integrity Advisory Solutions, LLC | 14.911 | 12,77 | 90 | 11,25 | ||||
| 2026-02-06 | 13F | Vestmark Advisory Solutions, Inc. | 13.500 | 0,00 | 81 | 0,00 | ||||
| 2026-02-05 | 13F | Allworth Financial LP | 1.202 | 0,00 | 7 | 0,00 | ||||
| 2026-02-13 | 13F | MAI Capital Management | 133 | 0,00 | 1 | |||||
| 2025-11-04 | 13F | Mission Wealth Management, Lp | 0 | -100,00 | 0 | -100,00 | ||||
| 2026-02-12 | 13F | Principal Securities, Inc. | 0 | -100,00 | 0 | |||||
| 2026-04-23 | 13F | J.w. Cole Advisors, Inc. | 0 | -100,00 | 0 | |||||
| 2026-04-23 | 13F | Accurate Wealth Management, LLC | 35.098 | 4,83 | 214 | 4,90 | ||||
| 2026-02-13 | 13F | Mariner, LLC | 11.455 | 12,59 | 69 | 13,11 | ||||
| 2026-02-13 | 13F | Wells Fargo & Company/mn | 541 | -72,24 | 3 | -72,73 | ||||
| 2026-04-09 | 13F | Wealth Quarterback LLC | 47.101 | 15,84 | 285 | 15,92 | ||||
| 2026-04-14 | 13F | Nbc Securities, Inc. | 1.929 | 0,21 | 12 | 0,00 | ||||
| 2026-04-15 | 13F | Register Financial Advisors LLC | 16.885 | 2,52 | 102 | 3,03 | ||||
| 2026-02-12 | 13F | Commonwealth Equity Services, Llc | 1.300.372 | -14,53 | 7.841 | 87.022,22 | ||||
| 2026-02-17 | 13F | Ameriprise Financial Inc | 12.982 | 12,72 | 78 | 13,04 | ||||
| 2026-01-21 | 13F | Flagship Harbor Advisors, Llc | 2.689 | 16 | ||||||
| 2026-02-05 | 13F | Gamco Investors, Inc. Et Al | 331.023 | 0,00 | 1.996 | -0,65 | ||||
| 2026-02-13 | 13F | Morgan Stanley | 942.529 | 18,87 | 5.683 | 18,10 | ||||
| 2026-02-14 | 13F | Rockefeller Capital Management L.P. | 395 | 0,00 | 2 | 0,00 | ||||
| 2026-01-22 | 13F | Cascade Investment Group, Inc. | 17.888 | 0,00 | 108 | -0,93 | ||||
| 2026-02-17 | 13F | Private Advisor Group, LLC | 25.233 | 0,33 | 152 | 0,00 | ||||
| 2026-04-22 | 13F | Janney Montgomery Scott LLC | 138.486 | 1,84 | 1 | |||||
| 2026-02-17 | 13F | Raymond James Financial Inc | 128.308 | 4,53 | 774 | 3,76 | ||||
| 2026-02-17 | 13F | Creative Planning | 57.326 | -2,85 | 346 | -3,63 | ||||
| 2026-02-09 | 13F | Fisher Asset Management, LLC | 0 | -100,00 | 0 | |||||
| 2026-01-23 | 13F | Valley Brook Capital Group, Inc. | 15.000 | 0,00 | 90 | -1,10 |