Grundlæggende statistik
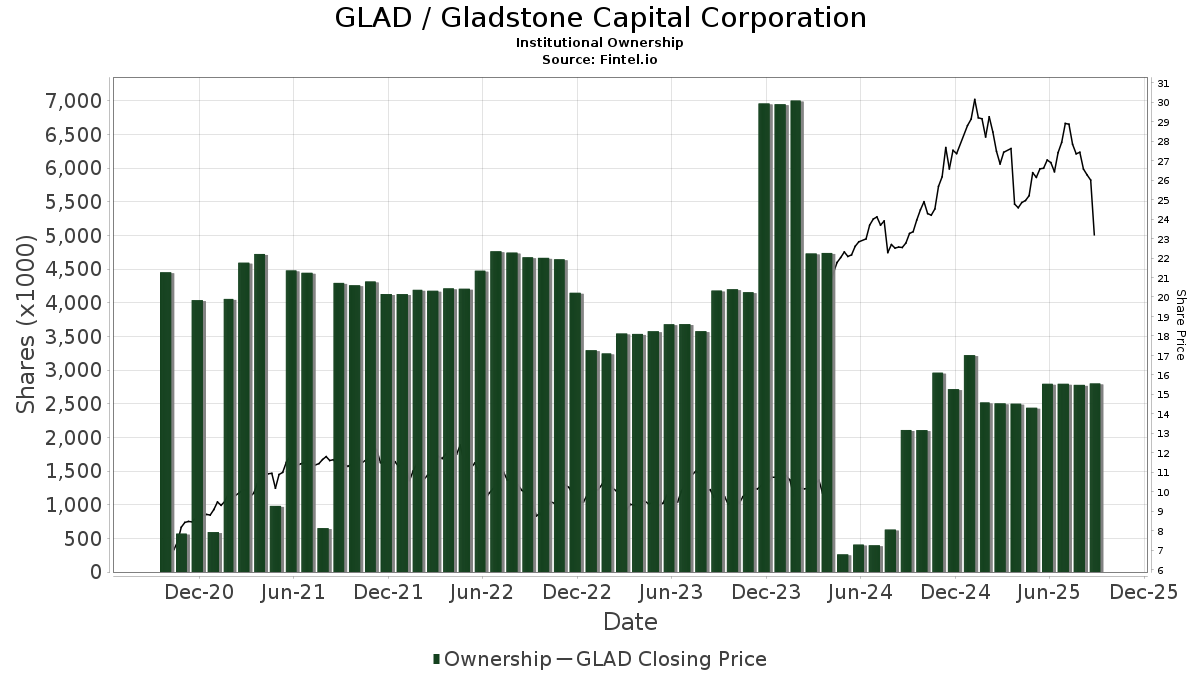
| Institutionelle ejere | 83 total, 82 long only, 0 short only, 1 long/short - change of 7,79% MRQ |
| Gennemsnitlig porteføljeallokering | 0.0522 % - change of -13,83% MRQ |
| Institutionelle aktier (lange) | 2.801.420 (ex 13D/G) - change of 0,01MM shares 0,18% MRQ |
| Institutionel værdi (lang) | $ 60.644 USD ($1000) |
Institutionelt ejerskab og aktionærer
Gladstone Capital Corporation (US:GLAD) har 83 institutionelle ejere og aktionærer, der har indsendt 13D/G- eller 13F-formularer til Securities Exchange Commission (SEC). Disse institutioner har i alt 2,801,420 aktier. Største aktionærer omfatter BIZD - VanEck Vectors BDC Income ETF, Van Eck Associates Corp, UBS Group AG, Legal & General Group Plc, LPL Financial LLC, BlackRock, Inc., D.a. Davidson & Co., Two Sigma Advisers, Lp, DnB Asset Management AS, and Two Sigma Investments, Lp .
Gladstone Capital Corporation (NasdaqGS:GLAD) institutionel ejerskabsstruktur viser aktuelle positioner i virksomheden efter institutioner og fonde, samt seneste ændringer i positionsstørrelse. Større aktionærer kan omfatte individuelle investorer, investeringsforeninger, hedgefonde eller institutioner. Skema 13D angiver, at investoren besidder (eller besidder) mere end 5 % af virksomheden og har til hensigt (eller har til hensigt at) aktivt at forfølge en ændring i forretningsstrategi. Skema 13G indikerer en passiv investering på over 5%.
The share price as of September 12, 2025 is 23,51 / share. Previously, on September 16, 2024, the share price was 23,33 / share. This represents an increase of 0,77% over that period.
Fondens stemningsscore
Fund Sentiment Score (fka Ownership Accumulation Score) finder de aktier, der bliver mest købt af fonde. Det er resultatet af en sofistikeret, multi-faktor kvantitativ model, der identificerer virksomheder med de højeste niveauer af institutionel akkumulering. Scoringsmodellen bruger en kombination af den samlede stigning i oplyste ejere, ændringerne i porteføljeallokeringer i disse ejere og andre målinger. Tallet går fra 0 til 100, hvor højere tal indikerer et højere niveau af akkumulering for sine jævnaldrende, og 50 er gennemsnittet.
Opdateringsfrekvens: Dagligt
Se Ownership Explorer, som giver en liste over højest rangerende virksomheder.
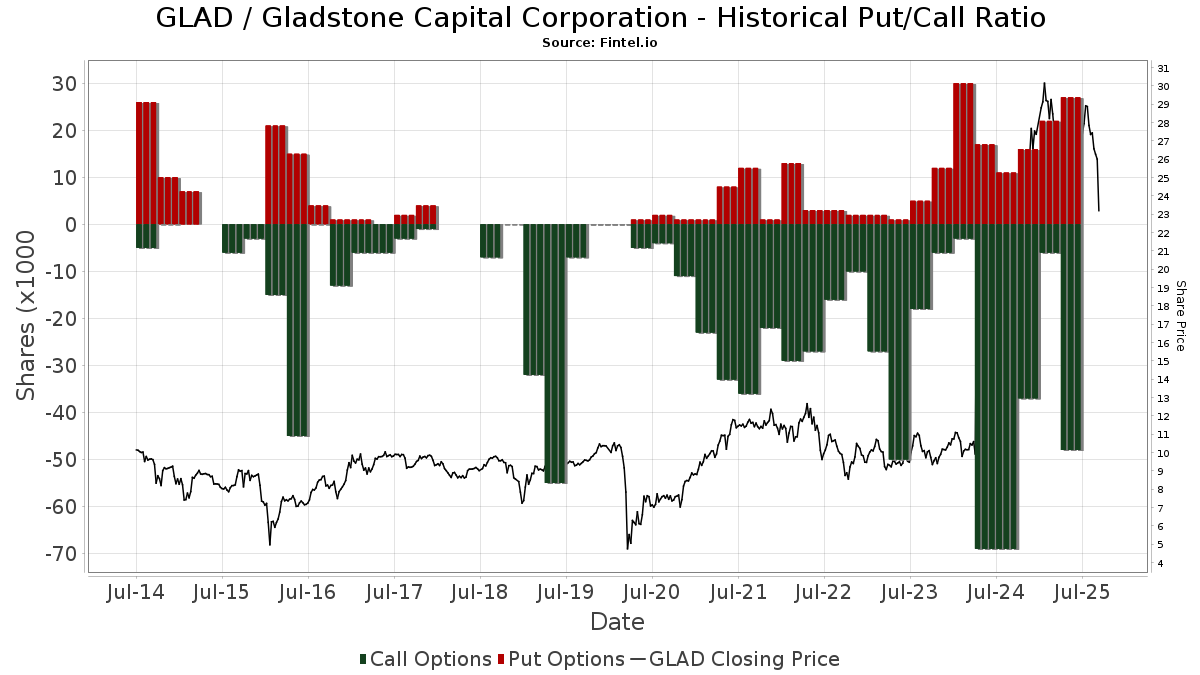
Institutionel Put/Call-forhold
Ud over at indberette standardaktie- og gældsudstedelser skal institutter med mere end 100 mill. aktiver under forvaltning også oplyse deres put- og call-optionsbeholdninger. Da salgsoptioner generelt indikerer negativ stemning, og købsoptioner indikerer positiv stemning, kan vi få en fornemmelse af den overordnede institutionelle stemning ved at plotte forholdet mellem put og kald. Diagrammet til højre viser det historiske put/call-forhold for dette instrument.
Brug af Put/Call Ratio som en indikator for investorernes stemning overvinder en af de vigtigste mangler ved at bruge totalt institutionelt ejerskab, som er, at en betydelig mængde af aktiver under forvaltning investeres passivt for at spore indekser. Passivt forvaltede fonde køber typisk ikke optioner, så indikatoren for put/call-forholdet følger mere nøje følelsen af aktivt forvaltede fonde.
13F og NPORT arkivering
Detaljer om 13F-arkivering er gratis. Detaljer om NP-ansøgninger kræver et premium-medlemskab. Grønne rækker angiver nye positioner. Røde rækker angiver lukkede positioner. Klik på linket ikon for at se den fulde transaktionshistorik.
Opgrader
for at låse premium-data op og eksportere til Excel ![]() .
.
| Fil dato | Kilde | Investor | Type | Gennemsnitlig pris (Øst) |
Aktier | Δ Aktier (%) |
Rapporteret Værdi ($1000) |
Δ Værdi (%) |
Port Alloc (%) |
|
|---|---|---|---|---|---|---|---|---|---|---|
| 2025-08-14 | 13F | Two Sigma Investments, Lp | 64.338 | -45,41 | 1.735 | -46,38 | ||||
| 2025-08-04 | 13F | Assetmark, Inc | 151 | 0,67 | 4 | 0,00 | ||||
| 2025-04-09 | 13F | American National Bank | 0 | -100,00 | 0 | |||||
| 2025-08-05 | 13F | Key FInancial Inc | 100 | 3 | ||||||
| 2025-08-12 | 13F | DnB Asset Management AS | 88.475 | 0,00 | 2.386 | -1,77 | ||||
| 2025-07-29 | 13F | International Assets Investment Management, Llc | 15.989 | 0,00 | 431 | -1,82 | ||||
| 2025-04-30 | 13F | POM Investment Strategies, LLC | 0 | -100,00 | 0 | |||||
| 2025-08-11 | 13F | Private Advisor Group, LLC | 10.460 | 0,00 | 282 | -1,74 | ||||
| 2025-08-12 | 13F | Proequities, Inc. | 0 | 0 | ||||||
| 2025-08-14 | 13F | Goldman Sachs Group Inc | 15.198 | -47,33 | 410 | -48,36 | ||||
| 2025-07-22 | 13F | Valley National Advisers Inc | 100 | 0,00 | 0 | |||||
| 2025-08-14 | 13F | Susquehanna International Group, Llp | 37.322 | 24,69 | 1.007 | 22,53 | ||||
| 2025-08-14 | 13F | Susquehanna International Group, Llp | Call | 35.700 | 963 | |||||
| 2025-08-14 | 13F | Susquehanna International Group, Llp | Put | 27.900 | 97,87 | 752 | 94,32 | |||
| 2025-08-15 | 13F | Morgan Stanley | 57.429 | -16,38 | 1.549 | -17,88 | ||||
| 2025-08-14 | 13F | Colony Group, LLC | 0 | -100,00 | 0 | |||||
| 2025-08-12 | 13F | Jpmorgan Chase & Co | 1.717 | 46 | ||||||
| 2025-07-31 | 13F | Cambridge Investment Research Advisors, Inc. | 7.876 | -43,88 | 0 | |||||
| 2025-08-11 | 13F | Nomura Asset Management Co Ltd | 1.766 | 134,22 | 48 | 135,00 | ||||
| 2025-07-21 | 13F | Ameriflex Group, Inc. | 0 | -100,00 | 0 | |||||
| 2025-08-13 | 13F | Mackenzie Financial Corp | 16.410 | 24,04 | 443 | 21,76 | ||||
| 2025-05-30 | NP | ERNZ - TrueShares Active Yield ETF | 6.594 | -74,57 | 181 | -75,44 | ||||
| 2025-09-04 | 13F/A | Advisor Group Holdings, Inc. | 6.620 | -38,11 | 179 | -39,25 | ||||
| 2025-08-13 | 13F | Russell Investments Group, Ltd. | 200 | 0,00 | 5 | 0,00 | ||||
| 2025-05-13 | 13F | Prime Capital Investment Advisors, LLC | 0 | -100,00 | 0 | |||||
| 2025-08-15 | 13F | WFA of San Diego, LLC | 1.550 | 42 | ||||||
| 2025-05-12 | 13F | Fmr Llc | 0 | -100,00 | 0 | |||||
| 2025-08-11 | 13F | Citigroup Inc | 0 | -100,00 | 0 | |||||
| 2025-08-04 | 13F | Creekmur Asset Management LLC | 236 | 2,16 | 6 | 0,00 | ||||
| 2025-07-25 | 13F | Cwm, Llc | 1.187 | 0 | ||||||
| 2025-08-12 | 13F | Steward Partners Investment Advisory, Llc | 1.367 | 37 | ||||||
| 2025-08-14 | 13F | Hrt Financial Lp | 32.229 | 84,64 | 1 | |||||
| 2025-08-19 | 13F | Newbridge Financial Services Group, Inc. | 327 | -76,59 | 9 | -78,95 | ||||
| 2025-08-14 | 13F | Van Eck Associates Corp | 497.327 | 3,56 | 13 | 0,00 | ||||
| 2025-05-08 | 13F | XTX Topco Ltd | 0 | -100,00 | 0 | |||||
| 2025-07-31 | 13F | MQS Management LLC | 8.319 | 2,34 | 224 | 0,45 | ||||
| 2025-08-21 | NP | BIZD - VanEck Vectors BDC Income ETF | 505.891 | 2,85 | 13.644 | 1,01 | ||||
| 2025-07-24 | 13F | IFP Advisors, Inc | 42 | 1 | ||||||
| 2025-08-14 | 13F | Bank Of America Corp /de/ | 7.684 | 3,81 | 207 | 1,97 | ||||
| 2025-07-28 | 13F | Harbour Investments, Inc. | 252 | 1,61 | 7 | 0,00 | ||||
| 2025-08-14 | 13F | UBS Group AG | 167.480 | 28,54 | 4.517 | 26,25 | ||||
| 2025-08-06 | 13F | First Horizon Advisors, Inc. | 1.632 | 44 | ||||||
| 2025-08-15 | 13F | WealthCollab, LLC | 170 | 5 | ||||||
| 2025-08-14 | 13F | Ausdal Financial Partners, Inc. | 32.134 | 32,43 | 867 | 30,03 | ||||
| 2025-08-13 | 13F | ExodusPoint Capital Management, LP | 0 | -100,00 | 0 | |||||
| 2025-08-12 | 13F | BlackRock, Inc. | 129.319 | 34,08 | 3.488 | 31,68 | ||||
| 2025-06-27 | NP | LBO - WHITEWOLF Publicly Listed Private Equity ETF | 1.444 | 14,24 | 36 | -2,70 | ||||
| 2025-08-04 | 13F | Kovack Advisors, Inc. | 38.479 | -0,21 | 1.038 | -1,98 | ||||
| 2025-08-06 | 13F | Commonwealth Equity Services, Llc | 11.518 | 5,87 | 0 | |||||
| 2025-07-30 | 13F | Denali Advisors Llc | 32.301 | -2,62 | 871 | -4,29 | ||||
| 2025-08-12 | 13F | Trexquant Investment LP | 34.803 | 33,01 | 939 | 30,64 | ||||
| 2025-08-14 | 13F | Two Sigma Advisers, Lp | 110.029 | -21,26 | 2.967 | -22,65 | ||||
| 2025-08-14 | 13F | Royal Bank Of Canada | 27.504 | 17,98 | 741 | 15,78 | ||||
| 2025-08-08 | 13F | Cetera Investment Advisers | 21.217 | 43,05 | 572 | 40,54 | ||||
| 2025-08-14 | 13F | Qube Research & Technologies Ltd | 19.184 | 16,22 | 517 | 14,13 | ||||
| 2025-07-30 | 13F | D.a. Davidson & Co. | 113.240 | 0,26 | 3.054 | -1,52 | ||||
| 2025-08-12 | 13F | Advisors Asset Management, Inc. | 56.560 | -33,97 | 1.525 | -35,16 | ||||
| 2025-04-22 | 13F | XML Financial, LLC | 0 | -100,00 | 0 | |||||
| 2025-08-14 | 13F | Raymond James Financial Inc | 43.580 | 29,72 | 1.175 | 27,44 | ||||
| 2025-08-14 | 13F | Brevan Howard Capital Management LP | 13.887 | 64,75 | 375 | 61,90 | ||||
| 2025-08-07 | 13F | Allworth Financial LP | 1.700 | 46 | ||||||
| 2025-05-02 | 13F | Kingsview Wealth Management, LLC | 0 | -100,00 | 0 | |||||
| 2025-08-15 | 13F | Tower Research Capital LLC (TRC) | 405 | -58,25 | 11 | -61,54 | ||||
| 2025-08-14 | 13F | Comerica Bank | 1.250 | 0,00 | 34 | -2,94 | ||||
| 2025-07-17 | 13F | Vermillion Wealth Management, Inc. | 500 | 0,00 | 13 | 0,00 | ||||
| 2025-07-11 | 13F | Farther Finance Advisors, LLC | 2.501 | -26,64 | 67 | -28,72 | ||||
| 2025-08-13 | 13F | Fortress Financial Solutions, LLC | 15.091 | 0,21 | 407 | -1,45 | ||||
| 2025-07-31 | 13F | Caitong International Asset Management Co., Ltd | 46 | 0,00 | 1 | 0,00 | ||||
| 2025-08-12 | 13F | LPL Financial LLC | 140.664 | -7,71 | 3.794 | -9,37 | ||||
| 2025-07-17 | 13F | Oakworth Capital, Inc. | 25 | 1 | ||||||
| 2025-08-14 | 13F | Citadel Advisors Llc | 0 | -100,00 | 0 | |||||
| 2025-05-06 | 13F | Wedbush Securities Inc | 0 | -100,00 | 0 | |||||
| 2025-08-12 | 13F | Deutsche Bank Ag\ | 9.509 | 0,00 | 256 | -1,92 | ||||
| 2025-04-22 | 13F | TrueMark Investments, LLC | 0 | -100,00 | 0 | |||||
| 2025-08-14 | 13F | Citadel Advisors Llc | Put | 0 | -100,00 | 0 | ||||
| 2025-07-16 | 13F | Register Financial Advisors LLC | 3.228 | 0,00 | 87 | -1,14 | ||||
| 2025-07-16 | 13F | ORG Partners LLC | 500 | 0,00 | 14 | 0,00 | ||||
| 2025-07-22 | 13F | Belpointe Asset Management LLC | 8.455 | 13,54 | 228 | 11,76 | ||||
| 2025-08-13 | 13F | Transce3nd, LLC | 175 | 0,00 | 5 | 0,00 | ||||
| 2025-08-14 | 13F | Group One Trading, L.p. | 1.092 | 29 | ||||||
| 2025-05-14 | 13F | Campbell & CO Investment Adviser LLC | 0 | -100,00 | 0 | |||||
| 2025-08-13 | 13F | Virtus Investment Advisers, Inc. | 22.133 | -12,41 | 597 | -14,00 | ||||
| 2025-08-05 | 13F | Simplex Trading, Llc | 0 | -100,00 | 0 | |||||
| 2025-05-05 | 13F | Hazlett, Burt & Watson, Inc. | 0 | -100,00 | 0 | |||||
| 2025-08-08 | 13F | Larson Financial Group LLC | 500 | 0,00 | 13 | 0,00 | ||||
| 2025-07-15 | 13F | Main Street Group, LTD | 50 | 0,00 | 1 | 0,00 | ||||
| 2025-08-08 | 13F | Good Life Advisors, LLC | 11.307 | 3,70 | 305 | 1,67 | ||||
| 2025-08-13 | 13F | Quantbot Technologies LP | 4.272 | 52,68 | 115 | 51,32 | ||||
| 2025-08-14 | 13F | Wells Fargo & Company/mn | 46.297 | 22,57 | 1.249 | 20,35 | ||||
| 2025-08-25 | NP | TMVAX - RBC Microcap Value Fund A Shares | 5.500 | 0,00 | 148 | -1,99 | ||||
| 2025-07-16 | 13F | PFS Partners, LLC | 1.969 | 0,00 | 53 | -1,85 | ||||
| 2025-08-18 | 13F/A | National Bank Of Canada /fi/ | 4.200 | 0,00 | 113 | -1,74 | ||||
| 2025-08-13 | 13F | Legacy Capital Wealth Partners, LLC | 52.709 | -3,74 | 1.422 | -5,46 | ||||
| 2025-08-14 | 13F | Citadel Advisors Llc | Call | 12.800 | 96,92 | 345 | 93,82 | |||
| 2025-08-13 | 13F | Jones Financial Companies Lllp | 1.084 | 0,00 | 29 | -3,45 | ||||
| 2025-08-14 | 13F | Atomi Financial Group, Inc. | 22.212 | 8,16 | 599 | 6,39 | ||||
| 2025-08-13 | 13F | Northern Trust Corp | 15.528 | 95,52 | 419 | 91,74 | ||||
| 2025-08-19 | 13F | MRP Capital Investments, LLC | 202 | 0,00 | 5 | 0,00 | ||||
| 2025-07-29 | 13F | Harbor Asset Planning, Inc. | 386 | 10 | ||||||
| 2025-08-14 | 13F | Aquatic Capital Management LLC | 4.011 | -57,01 | 108 | -57,81 | ||||
| 2025-08-11 | 13F | Hexagon Capital Partners LLC | 0 | -100,00 | 0 | |||||
| 2025-06-25 | NP | VPC - Virtus Private Credit Strategy ETF | 23.084 | 0,30 | 576 | -16,06 | ||||
| 2025-05-14 | 13F | Virtus ETF Advisers LLC | 0 | -100,00 | 0 | |||||
| 2025-08-12 | 13F | Legal & General Group Plc | 149.199 | 0,00 | 4.024 | -1,93 | ||||
| 2025-07-29 | 13F | Private Trust Co Na | 1.573 | 0,00 | 42 | -2,33 | ||||
| 2025-08-13 | 13F | Marshall Wace, Llp | 8.426 | 227 |