Grundlæggende statistik
| Institutionelle ejere | 122 total, 122 long only, 0 short only, 0 long/short - change of 10,81% MRQ |
| Gennemsnitlig porteføljeallokering | 0.2433 % - change of -53,87% MRQ |
| Institutionelle aktier (lange) | 4.591.288 (ex 13D/G) - change of 0,41MM shares 9,69% MRQ |
| Institutionel værdi (lang) | $ 314.386 USD ($1000) |
Institutionelt ejerskab og aktionærer
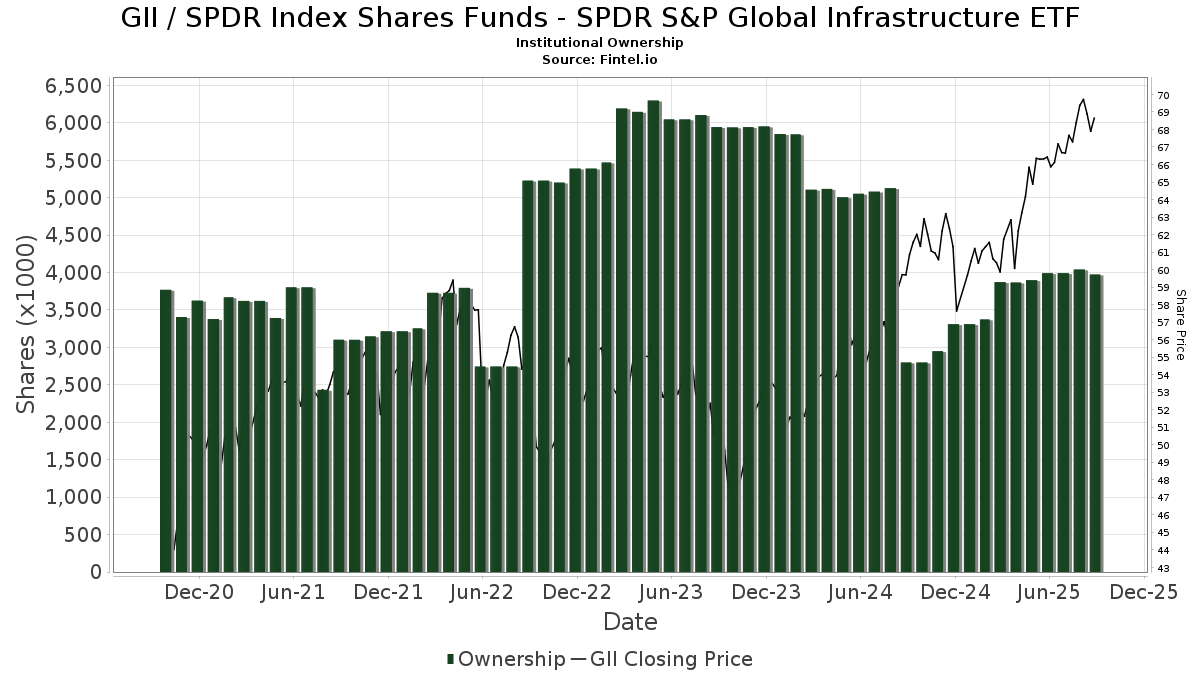
SPDR Index Shares Funds - State Street SPDR S&P Global Infrastructure ETF (US:GII) har 122 institutionelle ejere og aktionærer, der har indsendt 13D/G- eller 13F-formularer til Securities Exchange Commission (SEC). Disse institutioner har i alt 4,591,288 aktier. Største aktionærer omfatter Wealth Architects, LLC, LPL Financial LLC, Hills Bank & Trust Co, Mariner, LLC, Wharton Business Group, LLC, TOWER TRUST & INVESTMENT Co, Warren Street Wealth Advisors, LLC, Baker Avenue Asset Management, LP, Kovitz Investment Group Partners, LLC, and Clark Capital Management Group, Inc. .
SPDR Index Shares Funds - State Street SPDR S&P Global Infrastructure ETF (ARCA:GII) institutionel ejerskabsstruktur viser aktuelle positioner i virksomheden efter institutioner og fonde, samt seneste ændringer i positionsstørrelse. Større aktionærer kan omfatte individuelle investorer, investeringsforeninger, hedgefonde eller institutioner. Skema 13D angiver, at investoren besidder (eller besidder) mere end 5 % af virksomheden og har til hensigt (eller har til hensigt at) aktivt at forfølge en ændring i forretningsstrategi. Skema 13G indikerer en passiv investering på over 5%.
The share price as of April 2, 2026 is 76,98 / share. Previously, on April 3, 2025, the share price was 62,64 / share. This represents an increase of 22,89% over that period.
Fondens stemningsscore
Fund Sentiment Score (fka Ownership Accumulation Score) finder de aktier, der bliver mest købt af fonde. Det er resultatet af en sofistikeret, multi-faktor kvantitativ model, der identificerer virksomheder med de højeste niveauer af institutionel akkumulering. Scoringsmodellen bruger en kombination af den samlede stigning i oplyste ejere, ændringerne i porteføljeallokeringer i disse ejere og andre målinger. Tallet går fra 0 til 100, hvor højere tal indikerer et højere niveau af akkumulering for sine jævnaldrende, og 50 er gennemsnittet.
Opdateringsfrekvens: Dagligt
Se Ownership Explorer, som giver en liste over højest rangerende virksomheder.
AI+ Ask Fintel’s AI assistant about SPDR Index Shares Funds - State Street SPDR S&P Global Infrastructure ETF.
Select a question to share a public post with an AI-crafted answer.
Thinking of good questions…
Institutionel Put/Call-forhold
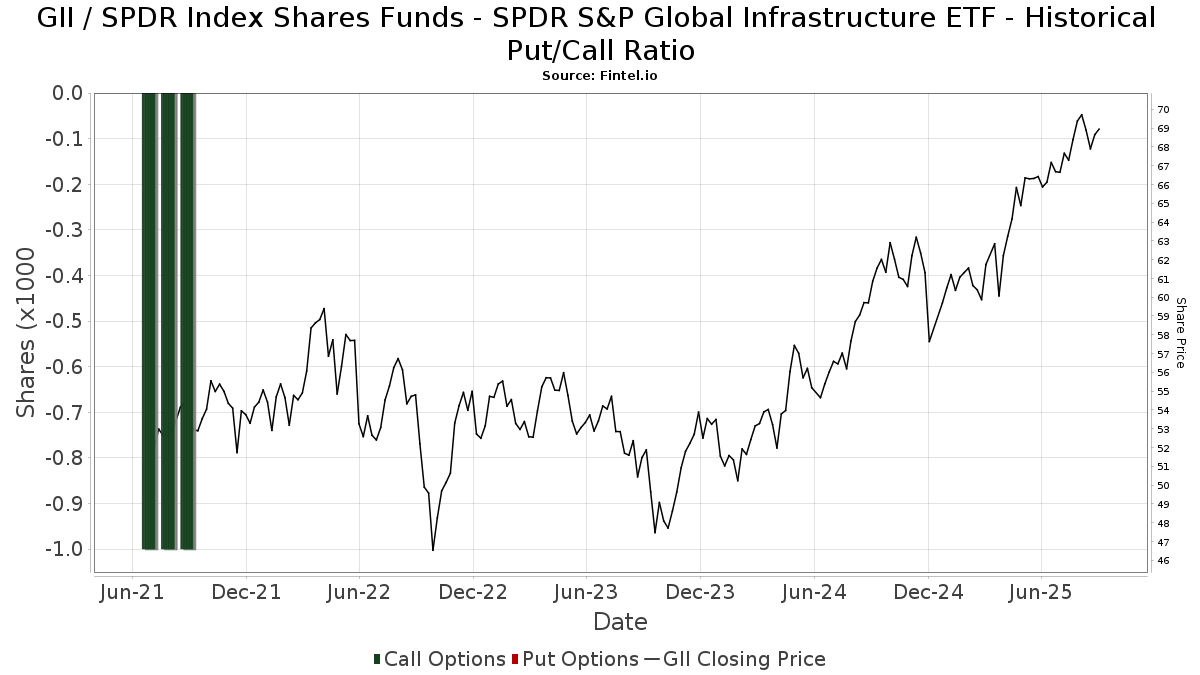
Ud over at indberette standardaktie- og gældsudstedelser skal institutter med mere end 100 mill. aktiver under forvaltning også oplyse deres put- og call-optionsbeholdninger. Da salgsoptioner generelt indikerer negativ stemning, og købsoptioner indikerer positiv stemning, kan vi få en fornemmelse af den overordnede institutionelle stemning ved at plotte forholdet mellem put og kald. Diagrammet til højre viser det historiske put/call-forhold for dette instrument.
Brug af Put/Call Ratio som en indikator for investorernes stemning overvinder en af de vigtigste mangler ved at bruge totalt institutionelt ejerskab, som er, at en betydelig mængde af aktiver under forvaltning investeres passivt for at spore indekser. Passivt forvaltede fonde køber typisk ikke optioner, så indikatoren for put/call-forholdet følger mere nøje følelsen af aktivt forvaltede fonde.
13D/G-arkivering
Vi præsenterer 13D/G ansøgninger separat fra 13F ansøgninger på grund af den forskellige behandling af SEC. 13D/G-ansøgninger kan indgives af grupper af investorer (med én ledende), hvorimod 13F-ansøgninger ikke kan. Dette resulterer i situationer, hvor en investor kan indsende en 13D/G, der rapporterer én værdi for de samlede aktier (der repræsenterer alle de aktier, der ejes af investorgruppen), men derefter indsender en 13F, der rapporterer en anden værdi for de samlede aktier (der udelukkende repræsenterer deres egne) ejendomsret). Det betyder, at aktieejerskab af 13D/G-arkiver og 13F-arkiveringer ofte ikke er direkte sammenlignelige, så vi præsenterer dem separat.
Bemærk: Fra den 16. maj 2021 viser vi ikke længere ejere, der ikke har indsendt en 13D/G inden for det seneste år. Tidligere viste vi den fulde historie af 13D/G-arkiver. Generelt skal enheder, der er forpligtet til at indgive 13D/G-ansøgninger, indgive mindst årligt, før de indsender en afsluttende ansøgning. Dog forlader fonde nogle gange positioner uden at indsende en afsluttende ansøgning (dvs. de afvikler), så visning af den fulde historie resulterede nogle gange i forvirring om det nuværende ejerskab. For at undgå forvirring viser vi nu kun 'aktuelle' ejere - det vil sige - ejere, der har anmeldt inden for det seneste år.
Upgrade to unlock premium data.
| Fil dato | Form | Investor | Forrige Aktier |
Seneste Aktier |
Δ Aktier (Procent) |
Ejendomsret (Procent) |
Δ Ejerskab (Procent) |
|
|---|---|---|---|---|---|---|---|---|
| 2026-03-26 | First Command Advisory Services, Inc. | 335,542,002 | 6.90 |
13F og NPORT arkivering
Detaljer om 13F-arkivering er gratis. Detaljer om NP-ansøgninger kræver et premium-medlemskab. Grønne rækker angiver nye positioner. Røde rækker angiver lukkede positioner. Klik på linket ikon for at se den fulde transaktionshistorik.
Opgrader
for at låse premium-data op og eksportere til Excel ![]() .
.
| Fil dato | Kilde | Investor | Type | Gennemsnitlig pris (Øst) |
Aktier | Δ Aktier (%) |
Rapporteret Værdi ($1000) |
Δ Værdi (%) |
Port Alloc (%) |
|
|---|---|---|---|---|---|---|---|---|---|---|
| 2026-02-04 | 13F | Liberty Wealth Management Llc | 3.281 | -23,45 | 229 | -23,49 | ||||
| 2026-01-29 | 13F | Ashton Thomas Private Wealth, LLC | 3.623 | 6,15 | 253 | 6,33 | ||||
| 2026-01-23 | 13F | Assetmark, Inc | 189 | 384,62 | 13 | 550,00 | ||||
| 2025-11-13 | 13F | Private Advisor Group, LLC | 0 | -100,00 | 0 | -100,00 | ||||
| 2026-01-08 | 13F | Sincerus Advisory, LLC | 7.537 | 2,85 | 526 | 3,14 | ||||
| 2026-02-12 | 13F | BlackRock, Inc. | 850 | 59 | ||||||
| 2026-02-13 | 13F | Oxford Financial Group Ltd | 55.893 | -0,42 | 3.900 | -0,18 | ||||
| 2026-01-23 | 13F | Farther Finance Advisors, LLC | 11.230 | 5.748,96 | 784 | 5.923,08 | ||||
| 2026-02-17 | 13F | Angeles Wealth Management, Llc | 0 | -100,00 | 0 | |||||
| 2025-10-22 | 13F | Twelve Points Wealth Management LLC | 0 | -100,00 | 0 | -100,00 | ||||
| 2026-02-12 | 13F | Betterment LLC | 3.103 | 0 | ||||||
| 2025-12-02 | 13F | IFP Advisors, Inc | 0 | 0 | ||||||
| 2026-01-23 | 13F | Hedeker Wealth, LLC | 31.279 | 5,77 | 2.182 | 6,08 | ||||
| 2026-01-26 | 13F | Whittier Trust Co | 278 | 0,00 | 20 | 0,00 | ||||
| 2026-02-10 | 13F/A | Northwestern Mutual Wealth Management Co | 7.142 | -18,48 | 498 | -18,23 | ||||
| 2026-01-23 | 13F | Altfest L J & Co Inc | 0 | -100,00 | 0 | |||||
| 2026-02-17 | 13F | Consultiva Wealth Management, Corp. | 790 | 172,41 | 55 | 175,00 | ||||
| 2025-11-13 | 13F | Marshall Wace, Llp | 0 | -100,00 | 0 | -100,00 | ||||
| 2026-02-12 | 13F | Wescott Financial Advisory Group, LLC | 6.687 | 467 | ||||||
| 2026-02-13 | 13F | Wells Fargo & Company/mn | 54.526 | 17,19 | 3.804 | 17,52 | ||||
| 2026-01-05 | 13F | Park Avenue Securities Llc | 6.419 | 2,69 | 0 | |||||
| 2026-02-13 | 13F | Ubs Asset Management Americas Inc | 45 | -99,78 | 3 | -99,67 | ||||
| 2026-02-09 | 13F | Harbour Investments, Inc. | 65 | -37,50 | 5 | -42,86 | ||||
| 2026-01-13 | 13F | CoreCap Advisors, LLC | 2 | 0,00 | 0 | |||||
| 2026-02-05 | 13F | AlphaCore Capital LLC | 256 | 0,00 | 18 | 0,00 | ||||
| 2026-01-26 | 13F | AE Wealth Management LLC | 562 | 39 | ||||||
| 2026-02-12 | 13F | Scotia Capital Inc. | 59.925 | 0,59 | 4.181 | 0,84 | ||||
| 2026-01-27 | 13F | Sage Financial Group Inc | 5.458 | 0,00 | 381 | 0,26 | ||||
| 2025-11-10 | 13F | Advisors Preferred, LLC | 0 | -100,00 | 0 | -100,00 | ||||
| 2026-01-02 | 13F | Boltwood Capital Management | 3.520 | 0,00 | 246 | 0,41 | ||||
| 2026-02-05 | 13F | Park Square Financial Group, LLC | 0 | -100,00 | 0 | |||||
| 2026-02-12 | 13F | Commonwealth Equity Services, Llc | 29.248 | 5,08 | 2.041 | 203.900,00 | ||||
| 2026-01-29 | 13F | D.a. Davidson & Co. | 42.429 | 14,41 | 2.960 | 14,73 | ||||
| 2026-01-16 | 13F | Worth Financial Advisory Group, LLC | 2.957 | 0,00 | 206 | 0,49 | ||||
| 2026-02-11 | 13F | Simplex Trading, Llc | 87 | 6 | ||||||
| 2026-02-10 | 13F | Godfrey Financial Associates, Inc. | 1.227 | 86 | ||||||
| 2026-02-12 | 13F | Brinker Capital Investments, LLC | 24.599 | 66,22 | 1.716 | 66,76 | ||||
| 2025-11-14 | 13F | Strategic Wealth Partners, Ltd. | 63 | 4 | ||||||
| 2026-02-06 | 13F | HighTower Advisors, LLC | 46.840 | 18,09 | 3.268 | 18,41 | ||||
| 2026-02-17 | 13F | EFG International AG | 11.757 | 820 | ||||||
| 2026-01-26 | 13F | Provenance Wealth Advisors, LLC | 16.032 | -2,63 | 1.119 | -2,36 | ||||
| 2026-02-12 | 13F | Jane Street Group, Llc | 0 | -100,00 | 0 | |||||
| 2026-02-05 | 13F | Cambridge Investment Research Advisors, Inc. | 3.424 | 4,36 | 0 | |||||
| 2026-02-04 | 13F | Naples Global Advisors, Llc | 43.640 | 1,75 | 3.045 | 2,01 | ||||
| 2026-02-11 | 13F | Prime Buchholz LLC | 30.546 | 0,12 | 2.131 | 0,38 | ||||
| 2026-02-03 | 13F | Emerald Investment Partners, Llc | 39 | 0,00 | 3 | 0,00 | ||||
| 2026-02-11 | 13F | Wharton Business Group, LLC | 252.290 | 0,08 | 17.602 | 0,34 | ||||
| 2026-02-17 | 13F | Royal Bank Of Canada | 7.090 | -1,58 | 495 | -1,39 | ||||
| 2026-02-12 | 13F | CIBC Private Wealth Group, LLC | 42 | 223,08 | 3 | |||||
| 2026-02-13 | 13F | National Bank Of Canada /fi/ | 1.125 | 0,00 | 78 | 0,00 | ||||
| 2026-02-14 | 13F | Rockefeller Capital Management L.P. | 33 | 0,00 | 2 | 0,00 | ||||
| 2025-11-05 | 13F | Austin Wealth Management, LLC | 0 | -100,00 | 0 | -100,00 | ||||
| 2026-02-13 | 13F | Visionary Wealth Advisors | 38.098 | 8,18 | 2.658 | 8,49 | ||||
| 2026-02-17 | 13F | Raymond James Financial Inc | 35.292 | 3,45 | 2.462 | 3,71 | ||||
| 2026-02-17 | 13F | Fmr Llc | 42.874 | 78,31 | 2.991 | 78,78 | ||||
| 2026-02-11 | 13F | Capital Analysts, Inc. | 350 | 0,00 | 0 | |||||
| 2026-01-28 | 13F | Geneos Wealth Management Inc. | 24 | 2 | ||||||
| 2026-02-13 | 13F/A | Newport Capital Group, LLC | 33.548 | 4,92 | 2.340 | 5,17 | ||||
| 2026-02-17 | 13F | D. E. Shaw & Co., Inc. | 4.363 | 0,00 | 304 | 0,33 | ||||
| 2026-01-26 | 13F | Cwm, Llc | 2.878 | 166,48 | 0 | |||||
| 2026-02-06 | 13F/A | Rathbone Brothers plc | 41.333 | -17,13 | 2.884 | -16,92 | ||||
| 2026-02-04 | 13F | Ameritas Advisory Services, LLC | 12.605 | 4.101,67 | 879 | 4.295,00 | ||||
| 2026-02-17 | 13F | Advisor Group Holdings, Inc. | 6.544 | -53,15 | 457 | -52,80 | ||||
| 2026-02-11 | 13F | LPL Financial LLC | 514.604 | 0,75 | 35.904 | 1,01 | ||||
| 2026-02-13 | 13F | Colony Group, LLC | 4.335 | -43,48 | 302 | -43,45 | ||||
| 2025-11-14 | 13F | EFG Asset Management (Americas) Corp. | 11.599 | 0,00 | 807 | 3,33 | ||||
| 2026-02-17 | 13F | Cetera Investment Advisers | 31.362 | 6,47 | 2.188 | 6,78 | ||||
| 2026-02-18 | 13F | GWM Advisors LLC | 10 | 0,00 | 1 | |||||
| 2026-01-29 | 13F | Comerica Bank | 719 | -0,96 | 50 | 0,00 | ||||
| 2026-02-03 | 13F | International Assets Investment Management, Llc | 61 | 4 | ||||||
| 2026-02-02 | 13F | CX Institutional | 68.358 | 0,24 | 5 | 0,00 | ||||
| 2026-02-10 | 13F | Envestnet Asset Management Inc | 63.215 | -3,90 | 4.410 | -3,65 | ||||
| 2026-02-12 | 13F | Ironsides Asset Advisors, LLC | 82.867 | -5,34 | 5.782 | -5,11 | ||||
| 2026-02-13 | 13F | Nicolet Advisory Services, Llc | 0 | -100,00 | 0 | |||||
| 2026-01-29 | 13F | Warren Street Wealth Advisors, LLC | 163.337 | 1,23 | 11.396 | 1,50 | ||||
| 2026-01-28 | 13F | N.E.W. Advisory Services LLC | 319 | 0,00 | 22 | 0,00 | ||||
| 2026-02-12 | 13F | Collier Financial | 300 | 21 | ||||||
| 2026-02-05 | 13F | Castle Rock Wealth Management, LLC | 3.860 | 0,00 | 283 | 5,60 | ||||
| 2026-02-17 | 13F | Wealth Architects, LLC | 644.516 | 3,58 | 44.968 | 3,85 | ||||
| 2026-02-12 | 13F | Principal Securities, Inc. | 6.216 | 12,26 | 434 | 12,47 | ||||
| 2026-01-21 | 13F | TOWER TRUST & INVESTMENT Co | 189.670 | 53,59 | 13.233 | 53,99 | ||||
| 2026-01-26 | 13F | Private Trust Co Na | 162 | 17,39 | 11 | 22,22 | ||||
| 2026-02-13 | 13F | State Street Corp | 51.700 | 0,00 | 3.607 | 0,28 | ||||
| 2026-02-17 | 13F | Hilltop Holdings Inc. | 5.293 | 0,44 | 369 | 0,82 | ||||
| 2026-01-20 | 13F | Austin Private Wealth, LLC | 5.597 | 11,12 | 391 | 11,43 | ||||
| 2026-01-21 | 13F | Signature Resources Capital Management, LLC | 212 | 0,00 | 15 | 0,00 | ||||
| 2026-02-18 | 13F | Beacon Pointe Advisors, LLC | 54.653 | 4,66 | 3.813 | 4,93 | ||||
| 2026-02-11 | 13F | Jpmorgan Chase & Co | 11.446 | 13,94 | 799 | 14,16 | ||||
| 2026-02-02 | 13F | Cornerstone Planning Group LLC | 30 | -94,30 | 2 | -93,33 | ||||
| 2025-11-12 | 13F | Ascent Capital Management, LLC | 10.849 | 0,00 | 755 | 3,29 | ||||
| 2026-02-17 | 13F | Advisory Services Network, LLC | 0 | -100,00 | 0 | |||||
| 2026-01-20 | 13F | Stratos Wealth Partners, LTD. | 8.943 | 624 | ||||||
| 2026-02-12 | 13F | Custom Index Systems, Llc | 18.507 | -23,62 | 1.291 | -23,43 | ||||
| 2026-01-29 | 13F | Nbc Securities, Inc. | 101 | -23,48 | 7 | -22,22 | ||||
| 2025-10-21 | 13F | Brookwood Investment Group LLC | 0 | -100,00 | 0 | -100,00 | ||||
| 2026-02-06 | 13F | Global Retirement Partners, LLC | 40.148 | 3,93 | 2.801 | 4,20 | ||||
| 2026-01-30 | 13F | Keybank National Association/oh | 13.099 | 4,64 | 914 | 4,82 | ||||
| 2026-01-30 | 13F | Us Bancorp \de\ | 13 | 1 | ||||||
| 2026-02-10 | 13F | Baker Avenue Asset Management, LP | 148.508 | 10,45 | 10.361 | 10,74 | ||||
| 2026-02-17 | 13F | Signature Equity Partners, LLC | 41 | 3 | ||||||
| 2025-11-14 | 13F | Imprint Wealth LLC | 0 | -100,00 | 0 | -100,00 | ||||
| 2026-02-13 | 13F | Mariner, LLC | 323.286 | 3,87 | 22.556 | 4,14 | ||||
| 2026-02-11 | 13F | Empowered Funds, LLC | 505 | 35 | ||||||
| 2026-02-12 | 13F | Steward Partners Investment Advisory, Llc | 5.445 | 1,87 | 380 | 2,16 | ||||
| 2026-02-17 | 13F | Jones Financial Companies Lllp | 4.104 | 8,95 | 286 | 9,58 | ||||
| 2026-02-12 | 13F | Index Technologies Group LLC | 7.502 | 523 | ||||||
| 2026-02-13 | 13F | Mml Investors Services, Llc | 16.477 | 12,64 | 1.150 | 12,98 | ||||
| 2026-02-17 | 13F | Clark Capital Management Group, Inc. | 86.460 | 2,30 | 6.032 | 2,57 | ||||
| 2026-02-03 | 13F | Sequoia Financial Advisors, LLC | 45.006 | -3,68 | 3.140 | -3,41 | ||||
| 2026-01-23 | 13F | Nbt Bank N A /ny | 70 | 0,00 | 0 | |||||
| 2026-02-13 | 13F | Morgan Stanley | 83.907 | 17,10 | 5.854 | 17,41 | ||||
| 2026-01-22 | 13F | Comprehensive Money Management Services LLC | 15.844 | -0,09 | 1.105 | 0,18 | ||||
| 2026-01-15 | 13F | Nikulski Financial, Inc. | 4.244 | 296 | ||||||
| 2026-01-22 | 13F | Paragon Capital Management Ltd | 4.869 | -3,79 | 340 | -3,69 | ||||
| 2026-01-23 | 13F | Eagle Bay Advisors LLC | 440 | 31 | ||||||
| 2026-02-17 | 13F | Bank Of America Corp /de/ | 25.577 | 3,51 | 1.785 | 3,78 | ||||
| 2026-02-10 | 13F | CIBC World Markets Inc. | 27.467 | -0,79 | 1.916 | -0,52 | ||||
| 2026-02-11 | 13F | Parallel Advisors, LLC | 806 | 168,67 | 56 | 180,00 | ||||
| 2025-11-14 | 13F | NorthRock Partners, LLC | 0 | -100,00 | 0 | -100,00 | ||||
| 2026-02-13 | 13F | SRS Capital Advisors, Inc. | 134 | 9 | ||||||
| 2025-10-16 | 13F | Lowe Wealth Advisors, LLC | 38.266 | 36,12 | 2.663 | 40,70 | ||||
| 2026-01-27 | 13F | TD Waterhouse Canada Inc. | 592 | 0,00 | 41 | 0,00 | ||||
| 2026-02-06 | 13F | Pnc Financial Services Group, Inc. | 585 | 0,00 | 41 | 0,00 | ||||
| 2026-02-20 | 13F | Kovitz Investment Group Partners, LLC | 114.951 | 1.428,60 | 8.020 | 1.433,46 | ||||
| 2026-02-12 | 13F | Federation des caisses Desjardins du Quebec | 657 | 0,00 | 46 | 0,00 | ||||
| 2026-02-06 | 13F | Copia Wealth Management | 1.012 | 18,50 | 71 | 18,64 | ||||
| 2026-02-02 | 13F | Breakwater Investment Management | 30.715 | -0,64 | 2.143 | -0,42 | ||||
| 2026-01-30 | 13F | Citizens Financial Group Inc/ri | 62.063 | 10,28 | 4.330 | 10,57 | ||||
| 2026-01-29 | 13F | UBS Group AG | 41.189 | 14,20 | 2.874 | 14,51 | ||||
| 2026-01-14 | 13F | Waldron Private Wealth LLC | 15.770 | 0,00 | 1.100 | 0,27 | ||||
| 2026-02-13 | 13F | MAI Capital Management | 46.168 | 3.221 | ||||||
| 2026-02-17 | 13F | Susquehanna International Group, Llp | 21.284 | 1.485 | ||||||
| 2026-02-05 | 13F | Hills Bank & Trust Co | 373.381 | 5,63 | 26.051 | 5,90 | ||||
| 2026-02-19 | 13F | WealthPoint Financial, LLC | 6.063 | 423 | ||||||
| 2026-02-12 | 13F | Bank Of Montreal /can/ | 9.955 | -13,93 | 695 | -13,68 | ||||
| 2026-02-13 | 13F | Pathstone Holdings, LLC | 27.807 | -2,91 | 1.940 | -2,61 |