Grundlæggende statistik
| Institutionelle ejere | 132 total, 132 long only, 0 short only, 0 long/short - change of 3,12% MRQ |
| Gennemsnitlig porteføljeallokering | 0.2270 % - change of -3,28% MRQ |
| Institutionelle aktier (lange) | 8.716.184 (ex 13D/G) - change of 0,27MM shares 3,24% MRQ |
| Institutionel værdi (lang) | $ 497.114 USD ($1000) |
Institutionelt ejerskab og aktionærer
Fidelity Covington Trust - Fidelity Value Factor ETF (US:FVAL) har 132 institutionelle ejere og aktionærer, der har indsendt 13D/G- eller 13F-formularer til Securities Exchange Commission (SEC). Disse institutioner har i alt 8,716,184 aktier. Største aktionærer omfatter Fmr Llc, Envestnet Asset Management Inc, Commonwealth Equity Services, Llc, High Probability Advisors, LLC, Royal Bank Of Canada, Custos Family Office, LLC, LPL Financial LLC, Advisor Group Holdings, Inc., Jpmorgan Chase & Co, and Kestra Advisory Services, LLC .
Fidelity Covington Trust - Fidelity Value Factor ETF (ARCA:FVAL) institutionel ejerskabsstruktur viser aktuelle positioner i virksomheden efter institutioner og fonde, samt seneste ændringer i positionsstørrelse. Større aktionærer kan omfatte individuelle investorer, investeringsforeninger, hedgefonde eller institutioner. Skema 13D angiver, at investoren besidder (eller besidder) mere end 5 % af virksomheden og har til hensigt (eller har til hensigt at) aktivt at forfølge en ændring i forretningsstrategi. Skema 13G indikerer en passiv investering på over 5%.
The share price as of September 5, 2025 is 67,54 / share. Previously, on September 9, 2024, the share price was 57,72 / share. This represents an increase of 17,01% over that period.

Fondens stemningsscore
Fund Sentiment Score (fka Ownership Accumulation Score) finder de aktier, der bliver mest købt af fonde. Det er resultatet af en sofistikeret, multi-faktor kvantitativ model, der identificerer virksomheder med de højeste niveauer af institutionel akkumulering. Scoringsmodellen bruger en kombination af den samlede stigning i oplyste ejere, ændringerne i porteføljeallokeringer i disse ejere og andre målinger. Tallet går fra 0 til 100, hvor højere tal indikerer et højere niveau af akkumulering for sine jævnaldrende, og 50 er gennemsnittet.
Opdateringsfrekvens: Dagligt
Se Ownership Explorer, som giver en liste over højest rangerende virksomheder.
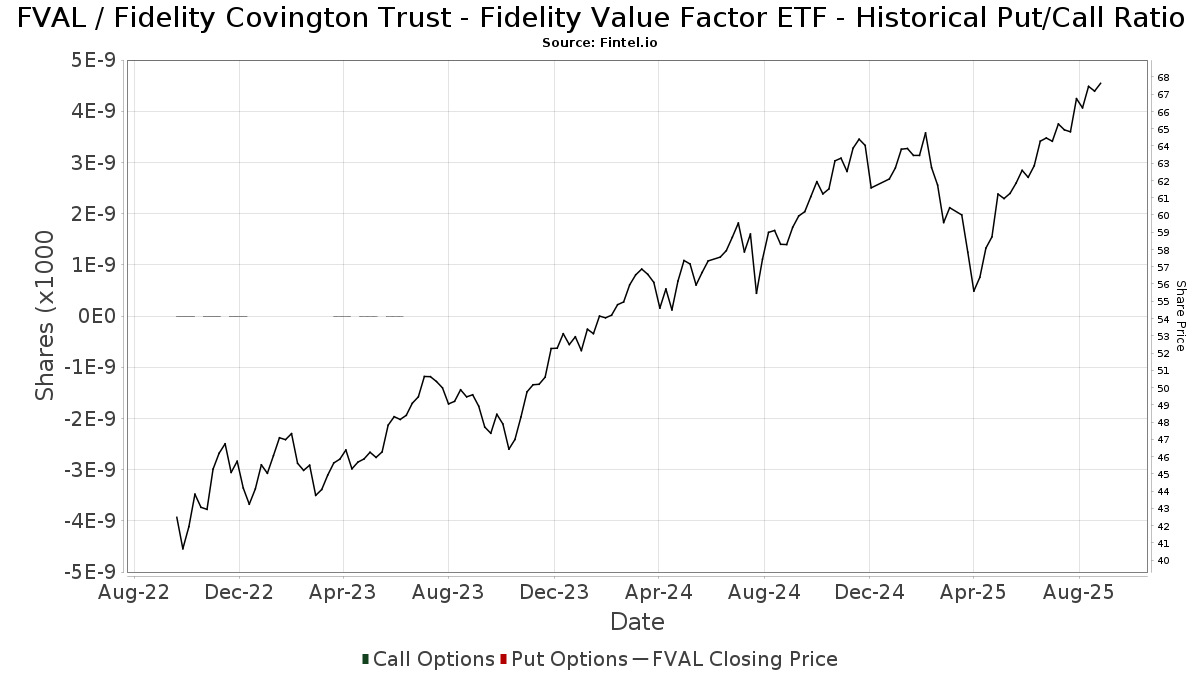
Institutionel Put/Call-forhold
Ud over at indberette standardaktie- og gældsudstedelser skal institutter med mere end 100 mill. aktiver under forvaltning også oplyse deres put- og call-optionsbeholdninger. Da salgsoptioner generelt indikerer negativ stemning, og købsoptioner indikerer positiv stemning, kan vi få en fornemmelse af den overordnede institutionelle stemning ved at plotte forholdet mellem put og kald. Diagrammet til højre viser det historiske put/call-forhold for dette instrument.
Brug af Put/Call Ratio som en indikator for investorernes stemning overvinder en af de vigtigste mangler ved at bruge totalt institutionelt ejerskab, som er, at en betydelig mængde af aktiver under forvaltning investeres passivt for at spore indekser. Passivt forvaltede fonde køber typisk ikke optioner, så indikatoren for put/call-forholdet følger mere nøje følelsen af aktivt forvaltede fonde.
13F og NPORT arkivering
Detaljer om 13F-arkivering er gratis. Detaljer om NP-ansøgninger kræver et premium-medlemskab. Grønne rækker angiver nye positioner. Røde rækker angiver lukkede positioner. Klik på linket ikon for at se den fulde transaktionshistorik.
Opgrader
for at låse premium-data op og eksportere til Excel ![]() .
.
| Fil dato | Kilde | Investor | Type | Gennemsnitlig pris (Øst) |
Aktier | Δ Aktier (%) |
Rapporteret Værdi ($1000) |
Δ Værdi (%) |
Port Alloc (%) |
|
|---|---|---|---|---|---|---|---|---|---|---|
| 2025-08-15 | 13F | Kestra Advisory Services, LLC | 178.389 | 19,57 | 11.394 | 28,16 | ||||
| 2025-07-29 | NP | EBI - Longview Advantage ETF | 0 | -100,00 | 0 | -100,00 | ||||
| 2025-08-14 | 13F | Federation des caisses Desjardins du Quebec | 80 | 0,00 | 5 | 25,00 | ||||
| 2025-09-04 | 13F/A | Advisor Group Holdings, Inc. | 246.102 | -0,87 | 15.722 | 6,24 | ||||
| 2025-07-21 | 13F | Ameriflex Group, Inc. | 0 | -100,00 | 0 | |||||
| 2025-08-15 | 13F | Morgan Stanley | 121.470 | -3,90 | 7.758 | 3,00 | ||||
| 2025-05-12 | 13F | Americana Partners, LLC | 0 | -100,00 | 0 | |||||
| 2025-08-26 | 13F/A | Thrivent Financial For Lutherans | 26.970 | -95,28 | 2 | -97,22 | ||||
| 2025-04-21 | 13F | PSI Advisors, LLC | 0 | -100,00 | 0 | |||||
| 2025-08-14 | 13F | Certified Advisory Corp | 5.461 | 0,39 | 349 | 7,41 | ||||
| 2025-08-13 | 13F | Twin Peaks Wealth Advisors, LLC | 982 | 65 | ||||||
| 2025-07-11 | 13F | Bouvel Investment Partners, LLC | 45.304 | -9,63 | 2.894 | -4,74 | ||||
| 2025-07-25 | 13F | Atria Wealth Solutions, Inc. | 27.598 | -8,55 | 1.766 | -1,78 | ||||
| 2025-07-08 | 13F | Zrc Wealth Management, Llc | 18 | 0,00 | 1 | 0,00 | ||||
| 2025-08-08 | 13F | Thoroughbred Financial Services, Llc | 4.933 | -62,14 | 0 | |||||
| 2025-04-11 | 13F | Unique Wealth, Llc | 0 | -100,00 | 0 | |||||
| 2025-07-24 | 13F | Blair William & Co/il | 200 | 0,00 | 13 | 9,09 | ||||
| 2025-08-14 | 13F | Mml Investors Services, Llc | 12.236 | 50,23 | 1 | |||||
| 2025-07-08 | 13F | Prism Advisors, Inc. | 81.530 | 0,00 | 5.207 | 7,18 | ||||
| 2025-08-18 | 13F/A | Kestra Investment Management, LLC | 3.497 | 223 | ||||||
| 2025-08-04 | 13F | Kovack Advisors, Inc. | 5.592 | 1,10 | 357 | 8,51 | ||||
| 2025-08-14 | 13F | Stifel Financial Corp | 3.486 | -1,33 | 223 | 5,71 | ||||
| 2025-08-14 | 13F | Clarity Asset Management, Inc. | 2.129 | -6,95 | 136 | -0,74 | ||||
| 2025-07-28 | 13F | Axxcess Wealth Management, Llc | 0 | -100,00 | 0 | |||||
| 2025-07-17 | 13F | Montis Financial, LLC | 13.560 | -3,74 | 866 | 3,22 | ||||
| 2025-04-21 | 13F | PUREfi Wealth, LLC | 0 | -100,00 | 0 | |||||
| 2025-08-06 | 13F | Hoxton Planning & Management, LLC | 8.830 | 0,00 | 564 | 7,03 | ||||
| 2025-08-13 | 13F | Flow Traders U.s. Llc | 0 | -100,00 | 0 | |||||
| 2025-08-14 | 13F | Sunbelt Securities, Inc. | 8.590 | -31,87 | 529 | -29,69 | ||||
| 2025-08-07 | 13F | Kestra Private Wealth Services, Llc | 104.980 | 3,02 | 6.705 | 10,42 | ||||
| 2025-07-15 | 13F | Avaii Wealth Management, Llc | 4.527 | -0,98 | 289 | 6,25 | ||||
| 2025-07-21 | 13F | Ameritas Advisory Services, LLC | 3.496 | -62,93 | 223 | -61,28 | ||||
| 2025-07-30 | 13F | Cullen/frost Bankers, Inc. | 7.669 | 17,86 | 490 | 26,36 | ||||
| 2025-08-27 | 13F/A | Brinker Capital Investments, LLC | 31.823 | 22,00 | 2.033 | 30,76 | ||||
| 2025-08-01 | 13F | Envestnet Asset Management Inc | 1.398.051 | 7,23 | 89.293 | 14,93 | ||||
| 2025-08-04 | 13F | Spire Wealth Management | 42 | 0,00 | 3 | 0,00 | ||||
| 2025-08-12 | 13F | Atlas Capital Advisors Llc | 264 | 0,00 | 17 | 6,67 | ||||
| 2025-08-14 | 13F | Susquehanna International Group, Llp | 49.535 | 115,02 | 3.164 | 130,54 | ||||
| 2025-08-14 | 13F | Fmr Llc | 1.712.580 | 78,90 | 109.382 | 91,75 | ||||
| 2025-08-08 | 13F | CFO4Life Group, LLC | 4.118 | -3,51 | 263 | 3,54 | ||||
| 2025-08-14 | 13F | Quantinno Capital Management LP | 5.324 | 340 | ||||||
| 2025-07-30 | 13F | Strategic Blueprint, LLC | 14.467 | 924 | ||||||
| 2025-08-19 | 13F | National Asset Management, Inc. | 17.973 | 1.148 | ||||||
| 2025-08-12 | 13F | MAI Capital Management | 150.335 | 0,13 | 9.602 | 7,31 | ||||
| 2025-08-13 | 13F | Vermillion & White Wealth Management Group, LLC | 78 | 0,00 | 5 | 0,00 | ||||
| 2025-08-14 | 13F | Bank Of America Corp /de/ | 140.932 | 7,93 | 9.001 | 15,68 | ||||
| 2025-08-06 | 13F | AE Wealth Management LLC | 22.959 | -76,01 | 1.466 | -74,29 | ||||
| 2025-04-14 | 13F | Patriot Financial Group Insurance Agency, LLC | 0 | -100,00 | 0 | -100,00 | ||||
| 2025-08-12 | 13F | J.w. Cole Advisors, Inc. | 13.969 | 2,96 | 892 | 10,40 | ||||
| 2025-08-11 | 13F | Private Advisor Group, LLC | 8.104 | 10,95 | 518 | 18,85 | ||||
| 2025-07-18 | 13F | Childress Capital Advisors, Llc | 0 | -100,00 | 0 | -100,00 | ||||
| 2025-07-23 | 13F | Sax Wealth Advisors, Llc | 64.778 | 9,42 | 4.137 | 17,30 | ||||
| 2025-08-05 | 13F | Sigma Planning Corp | 23.822 | -0,51 | 1.522 | 6,66 | ||||
| 2025-08-12 | 13F | Global Retirement Partners, LLC | 5.645 | 0,18 | 361 | 4,05 | ||||
| 2025-08-07 | 13F | BOK Financial Private Wealth, Inc. | 72 | 5 | ||||||
| 2025-07-11 | 13F | Farther Finance Advisors, LLC | 4.152 | 4.672,41 | 265 | 5.200,00 | ||||
| 2025-08-18 | 13F | Geneos Wealth Management Inc. | 223 | 0,00 | 14 | 7,69 | ||||
| 2025-05-15 | 13F/A | Orion Portfolio Solutions, LLC | 26.085 | -5,62 | 1.554 | -8,59 | ||||
| 2025-08-14 | 13F/A | Rockefeller Capital Management L.P. | 26.785 | 6,47 | 1.711 | 14,08 | ||||
| 2025-08-14 | 13F | Goodwin Investment Advisory | 78.879 | 21,00 | 5.038 | 29,71 | ||||
| 2025-07-14 | 13F | AdvisorNet Financial, Inc | 1.242 | 0,32 | 79 | 8,22 | ||||
| 2025-04-30 | 13F | Quotient Wealth Partners, LLC | 0 | -100,00 | 0 | |||||
| 2025-07-15 | 13F | Colonial River Wealth Management, LLC | 0 | -100,00 | 0 | |||||
| 2025-08-04 | 13F | Assetmark, Inc | 3.652 | 2,56 | 233 | 9,91 | ||||
| 2025-08-14 | 13F | Integrated Wealth Concepts LLC | 3.242 | -30,37 | 207 | -25,27 | ||||
| 2025-08-13 | 13F | Transce3nd, LLC | 29 | 0,00 | 2 | 0,00 | ||||
| 2025-08-14 | 13F | Glen Eagle Advisors, LLC | 2.850 | 0,00 | 182 | 7,69 | ||||
| 2025-07-22 | 13F | Foguth Wealth Management, LLC. | 4.211 | -12,76 | 269 | -6,62 | ||||
| 2025-07-17 | 13F | Prepared Retirement Institute LLC | 5.927 | 0,36 | 379 | 7,69 | ||||
| 2025-07-29 | 13F | Spectrum Investment Advisors, Inc. | 15.089 | 5,96 | 964 | 13,56 | ||||
| 2025-07-10 | 13F | Wealth Enhancement Advisory Services, Llc | 10.375 | -6,91 | 672 | 1,05 | ||||
| 2025-07-16 | 13F | Signaturefd, Llc | 0 | -100,00 | 0 | |||||
| 2025-08-12 | 13F | Jpmorgan Chase & Co | 208.079 | 7,44 | 13.290 | 15,16 | ||||
| 2025-08-08 | 13F | Foundations Investment Advisors, LLC | 15.056 | 13,88 | 962 | 22,11 | ||||
| 2025-08-14 | 13F | GWM Advisors LLC | 7.775 | 6,89 | 497 | 14,55 | ||||
| 2025-07-30 | 13F | Principle Wealth Partners Llc | 6.167 | 0,00 | 394 | 7,08 | ||||
| 2025-08-01 | 13F | Gwn Securities Inc. | 9.057 | -12,34 | 579 | -6,02 | ||||
| 2025-08-14 | 13F | Qube Research & Technologies Ltd | 0 | -100,00 | 0 | |||||
| 2025-07-24 | 13F | Cyndeo Wealth Partners, LLC | 5.320 | 0,08 | 340 | 7,28 | ||||
| 2025-05-13 | 13F | Steward Partners Investment Advisory, Llc | 0 | -100,00 | 0 | |||||
| 2025-07-28 | 13F | Mowery & Schoenfeld Wealth Management, LLC | 0 | -100,00 | 0 | |||||
| 2025-08-14 | 13F | Jane Street Group, Llc | 9.283 | 593 | ||||||
| 2025-05-20 | 13F/A | Colony Group, LLC | 0 | -100,00 | 0 | |||||
| 2025-08-06 | 13F | Forbes Financial Planning, Inc. | 84.443 | -24,77 | 5.393 | -19,36 | ||||
| 2025-08-14 | 13F | Royal Bank Of Canada | 357.889 | 116,85 | 22.859 | 132,43 | ||||
| 2025-07-21 | 13F | Ascent Group, LLC | 5.183 | 2,37 | 331 | 9,97 | ||||
| 2025-07-31 | 13F | Cambridge Investment Research Advisors, Inc. | 43.647 | 26,14 | 3 | 0,00 | ||||
| 2025-08-14 | 13F | Atomi Financial Group, Inc. | 0 | -100,00 | 0 | |||||
| 2025-08-14 | 13F | Raymond James Financial Inc | 32.636 | 18,43 | 2.084 | 26,92 | ||||
| 2025-08-06 | 13F | Vantage Financial Partners, LLC | 146.131 | 0,04 | 9.333 | 7,23 | ||||
| 2025-07-15 | 13F | LVZ Advisors, Inc. | 28.311 | 1.808 | ||||||
| 2025-08-07 | 13F | New England Private Wealth Advisors LLC | 3.315 | 215 | ||||||
| 2025-08-14 | 13F | Mariner, LLC | 3.647 | -6,34 | 233 | 0,00 | ||||
| 2025-08-19 | 13F | Advisory Services Network, LLC | 4.284 | -2,86 | 277 | 5,34 | ||||
| 2025-08-08 | 13F | Cetera Investment Advisers | 177.883 | 7,89 | 11.361 | 15,63 | ||||
| 2025-08-01 | 13F | Cedar Point Capital Partners, LLC | 56.078 | 5,93 | 3.582 | 13,54 | ||||
| 2025-07-29 | 13F | Primoris Wealth Advisors, Llc | 45.482 | 40,09 | 2.905 | 50,16 | ||||
| 2025-08-04 | 13F | Bay Colony Advisory Group, Inc d/b/a Bay Colony Advisors | 4.162 | 2,54 | 266 | 10,42 | ||||
| 2025-08-13 | 13F | Northwestern Mutual Wealth Management Co | 4.062 | -45,02 | 259 | -41,14 | ||||
| 2025-08-01 | 13F | Schmidt P J Investment Management Inc | 13.335 | 185,00 | 852 | 206,12 | ||||
| 2025-07-28 | 13F | Sagespring Wealth Partners, Llc | 4.020 | -62,38 | 257 | -59,75 | ||||
| 2025-08-14 | 13F | Foronjy Financial Llc | 3.428 | 219 | ||||||
| 2025-08-14 | 13F | Comerica Bank | 2.182 | 0,00 | 139 | 6,92 | ||||
| 2025-07-21 | 13F | Custos Family Office, LLC | 321.535 | 0,72 | 20.536 | 7,95 | ||||
| 2025-08-12 | 13F | O'shaughnessy Asset Management, Llc | 57 | -82,78 | 4 | -84,21 | ||||
| 2025-08-08 | 13F | Altfest L J & Co Inc | 39.660 | -4,02 | 2.533 | 2,88 | ||||
| 2025-08-11 | 13F | Traub Capital Management LLC | 18.915 | 1.208 | ||||||
| 2025-08-13 | 13F | Jones Financial Companies Lllp | 26.135 | 53,31 | 1.662 | 64,72 | ||||
| 2025-08-14 | 13F | Harwood Advisory Group, LLC | 16.818 | -4,33 | 1.074 | -0,65 | ||||
| 2025-08-14 | 13F | Glenmede Investment Management, LP | 253 | 16 | ||||||
| 2025-05-02 | 13F | Capital A Wealth Management, LLC | 12 | 0,00 | 1 | |||||
| 2025-07-07 | 13F | Kings Path Partners LLC | 3 | 0 | ||||||
| 2025-07-30 | 13F | Avidian Wealth Solutions, LLC | 0 | -100,00 | 0 | |||||
| 2025-07-10 | 13F | Oliver Lagore Vanvalin Investment Group | 14 | 366,67 | 1 | |||||
| 2025-08-12 | 13F | SRS Capital Advisors, Inc. | 44 | 3 | ||||||
| 2025-08-05 | 13F | Dynasty Wealth Management, Llc | 4.895 | 0,55 | 313 | 7,59 | ||||
| 2025-08-14 | 13F | Goldman Sachs Group Inc | 30.572 | 10,01 | 1.953 | 17,87 | ||||
| 2025-08-07 | 13F | Allworth Financial LP | 9.558 | 0,15 | 610 | 11,11 | ||||
| 2025-08-08 | 13F | Crossmark Global Holdings, Inc. | 8.098 | -11,21 | 517 | -4,79 | ||||
| 2025-08-08 | 13F | Capital Investment Counsel, Inc | 2.230 | 0,00 | 142 | 7,58 | ||||
| 2025-08-12 | 13F | Proequities, Inc. | 0 | 0 | ||||||
| 2025-07-22 | 13F | Inlight Wealth Management, LLC | 0 | -100,00 | 0 | |||||
| 2025-08-12 | 13F | Wood Tarver Financial Group, LLC | 4.084 | 0,00 | 0 | -100,00 | ||||
| 2025-05-15 | 13F | Marshall & Sterling Wealth Advisors Inc. | 0 | -100,00 | 0 | |||||
| 2025-08-04 | 13F | Arkadios Wealth Advisors | 3.746 | 3,05 | 239 | 10,65 | ||||
| 2025-07-25 | 13F | Cwm, Llc | 0 | -100,00 | 0 | |||||
| 2025-08-06 | 13F | Golden State Wealth Management, LLC | 28 | 0,00 | 2 | 0,00 | ||||
| 2025-08-07 | 13F | Samalin Investment Counsel, LLC | 9.090 | -18,34 | 581 | -12,52 | ||||
| 2025-08-08 | 13F | Condor Capital Management | 109.495 | 1,98 | 6.993 | 9,32 | ||||
| 2025-07-23 | 13F | Valmark Advisers, Inc. | 24.748 | 0,73 | 1.581 | 7,92 | ||||
| 2025-07-25 | 13F | Sequoia Financial Advisors, LLC | 6.062 | 2,33 | 387 | 9,63 | ||||
| 2025-07-31 | 13F | CNB Bank | 686 | 0,00 | 44 | 7,50 | ||||
| 2025-08-14 | 13F | Two Sigma Investments, Lp | 101.800 | -50,44 | 6.502 | -46,88 | ||||
| 2025-08-14 | 13F | Hrt Financial Lp | 4.210 | 0 | ||||||
| 2025-08-07 | 13F | PFG Advisors | 0 | -100,00 | 0 | |||||
| 2025-08-14 | 13F | UBS Group AG | 1.179 | 75 | ||||||
| 2025-08-14 | 13F | LaSalle St. Investment Advisors, LLC | 4.791 | -20,24 | 0 | |||||
| 2025-08-12 | 13F | Founders Financial Alliance, LLC | 759 | 15,17 | 48 | 23,08 | ||||
| 2025-07-10 | 13F | Signal Advisors Wealth, LLC | 4.211 | -10,46 | 269 | -4,29 | ||||
| 2025-07-09 | 13F | Dynamic Advisor Solutions LLC | 178.222 | 2,48 | 11.383 | 9,85 | ||||
| 2025-04-28 | 13F | Clarity Capital Partners LLC | 0 | -100,00 | 0 | |||||
| 2025-08-08 | 13F | Creative Planning | 110.004 | -2,70 | 7.026 | 4,27 | ||||
| 2025-08-13 | 13F | Russell Investments Group, Ltd. | 37 | 2 | ||||||
| 2025-08-14 | 13F | Citadel Advisors Llc | 32.237 | -25,23 | 2.059 | -19,89 | ||||
| 2025-08-06 | 13F | Commonwealth Equity Services, Llc | 830.198 | -2,73 | 53 | 6,00 | ||||
| 2025-08-12 | 13F | LPL Financial LLC | 294.469 | 15,90 | 18.808 | 24,22 | ||||
| 2025-08-14 | 13F | CoreCap Advisors, LLC | 5.352 | -1,20 | 342 | 5,90 | ||||
| 2025-05-19 | 13F | Heck Capital Advisors, LLC | 0 | 0 | ||||||
| 2025-07-09 | 13F | High Probability Advisors, LLC | 414.937 | 9,83 | 26.502 | 17,72 | ||||
| 2025-08-13 | 13F | Cerity Partners LLC | 7.853 | 0,10 | 502 | 7,28 | ||||
| 2025-07-07 | 13F | Thurston, Springer, Miller, Herd & Titak, Inc. | 245 | 0,00 | 16 | 7,14 | ||||
| 2025-08-14 | 13F | Wells Fargo & Company/mn | 23 | -93,92 | 1 | -95,45 | ||||
| 2025-08-11 | 13F | Citigroup Inc | 2.054 | 0,00 | 131 | 7,38 | ||||
| 2025-07-24 | 13F | IFP Advisors, Inc | 3.317 | 5,60 | 212 | 12,83 | ||||
| 2025-07-31 | 13F | Glass Jacobson Investment Advisors llc | 3.968 | 0,84 | 253 | 4,55 | ||||
| 2025-08-11 | 13F | Principal Securities, Inc. | 613 | -77,72 | 39 | -76,92 | ||||
| 2025-07-25 | 13F | Envestnet Portfolio Solutions, Inc. | 29.371 | 12,72 | 1.876 | 20,81 | ||||
| 2025-04-17 | 13F | Fairvoy Private Wealth, LLC | 0 | -100,00 | 0 | |||||
| 2025-08-14 | 13F | Kovitz Investment Group Partners, LLC | 3.500 | 224 | ||||||
| 2025-08-11 | 13F | NewEdge Wealth, LLC | 0 | -100,00 | 0 |