Grundlæggende statistik
| Institutionelle ejere | 91 total, 91 long only, 0 short only, 0 long/short - change of -1,05% MRQ |
| Gennemsnitlig porteføljeallokering | 0.6010 % - change of 0,01% MRQ |
| Institutionelle aktier (lange) | 8.095.454 (ex 13D/G) - change of -0,14MM shares -1,66% MRQ |
| Institutionel værdi (lang) | $ 421.072 USD ($1000) |
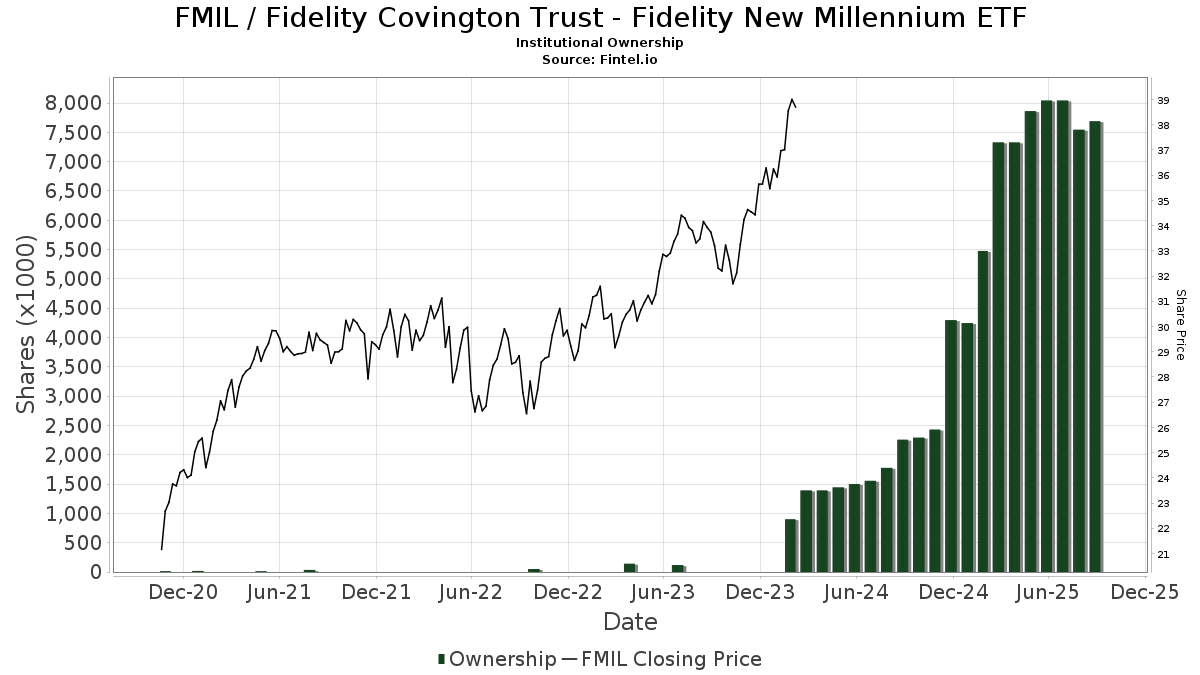
Institutionelt ejerskab og aktionærer
Fidelity Covington Trust - Fidelity New Millennium ETF (US:FMIL) har 91 institutionelle ejere og aktionærer, der har indsendt 13D/G- eller 13F-formularer til Securities Exchange Commission (SEC). Disse institutioner har i alt 8,095,454 aktier. Største aktionærer omfatter Commonwealth Equity Services, Llc, LPL Financial LLC, Mariner, LLC, Socha Financial Group, LLC, Novem Group, Dahring | Cusmano Llc, Envestnet Asset Management Inc, Prasad Wealth Partners, LLC, Fiduciary Planning LLC, and Tactive Advisors, LLC .
Fidelity Covington Trust - Fidelity New Millennium ETF (BATS:FMIL) institutionel ejerskabsstruktur viser aktuelle positioner i virksomheden efter institutioner og fonde, samt seneste ændringer i positionsstørrelse. Større aktionærer kan omfatte individuelle investorer, investeringsforeninger, hedgefonde eller institutioner. Skema 13D angiver, at investoren besidder (eller besidder) mere end 5 % af virksomheden og har til hensigt (eller har til hensigt at) aktivt at forfølge en ændring i forretningsstrategi. Skema 13G indikerer en passiv investering på over 5%.
Fondens stemningsscore
Fund Sentiment Score (fka Ownership Accumulation Score) finder de aktier, der bliver mest købt af fonde. Det er resultatet af en sofistikeret, multi-faktor kvantitativ model, der identificerer virksomheder med de højeste niveauer af institutionel akkumulering. Scoringsmodellen bruger en kombination af den samlede stigning i oplyste ejere, ændringerne i porteføljeallokeringer i disse ejere og andre målinger. Tallet går fra 0 til 100, hvor højere tal indikerer et højere niveau af akkumulering for sine jævnaldrende, og 50 er gennemsnittet.
Opdateringsfrekvens: Dagligt
Se Ownership Explorer, som giver en liste over højest rangerende virksomheder.
AI+ Ask Fintel’s AI assistant about Fidelity Covington Trust - Fidelity New Millennium ETF.
Select a question to share a public post with an AI-crafted answer.
Thinking of good questions…
Institutionel Put/Call-forhold
Ud over at indberette standardaktie- og gældsudstedelser skal institutter med mere end 100 mill. aktiver under forvaltning også oplyse deres put- og call-optionsbeholdninger. Da salgsoptioner generelt indikerer negativ stemning, og købsoptioner indikerer positiv stemning, kan vi få en fornemmelse af den overordnede institutionelle stemning ved at plotte forholdet mellem put og kald. Diagrammet til højre viser det historiske put/call-forhold for dette instrument.
Brug af Put/Call Ratio som en indikator for investorernes stemning overvinder en af de vigtigste mangler ved at bruge totalt institutionelt ejerskab, som er, at en betydelig mængde af aktiver under forvaltning investeres passivt for at spore indekser. Passivt forvaltede fonde køber typisk ikke optioner, så indikatoren for put/call-forholdet følger mere nøje følelsen af aktivt forvaltede fonde.
13F og NPORT arkivering
Detaljer om 13F-arkivering er gratis. Detaljer om NP-ansøgninger kræver et premium-medlemskab. Grønne rækker angiver nye positioner. Røde rækker angiver lukkede positioner. Klik på linket ikon for at se den fulde transaktionshistorik.
Opgrader
for at låse premium-data op og eksportere til Excel ![]() .
.
| Fil dato | Kilde | Investor | Type | Gennemsnitlig pris (Øst) |
Aktier | Δ Aktier (%) |
Rapporteret Værdi ($1000) |
Δ Værdi (%) |
Port Alloc (%) |
|
|---|---|---|---|---|---|---|---|---|---|---|
| 2026-04-23 | 13F | Oppenheimer & Co Inc | 18.644 | -3,76 | 956 | -7,45 | ||||
| 2026-02-12 | 13F | Bank Of Montreal /can/ | 320 | 0,00 | 17 | 6,25 | ||||
| 2026-02-05 | 13F | Western Wealth Management, LLC | 6.884 | 367 | ||||||
| 2026-02-13 | 13F | Mariner, LLC | 997.832 | 2,22 | 53.244 | 4,82 | ||||
| 2026-02-11 | 13F | Mascagni Wealth Management, Inc. | 18.905 | 6,42 | 1.009 | 9,09 | ||||
| 2025-11-06 | 13F | Atria Investments Llc | 0 | -100,00 | 0 | |||||
| 2026-02-05 | 13F | Dahring | Cusmano Llc | 314.608 | 6,06 | 16.787 | 8,75 | ||||
| 2026-04-13 | 13F | Elm3 Financial Group, LLC | 9.081 | 0,22 | 466 | -3,73 | ||||
| 2026-01-20 | 13F | Stratos Wealth Partners, LTD. | 50.236 | 29,63 | 2.681 | 32,94 | ||||
| 2026-01-22 | 13F | Fiduciary Planning LLC | 252.018 | 2,94 | 13.448 | 5,55 | ||||
| 2026-02-17 | 13F | Bank Of America Corp /de/ | 103 | 5 | ||||||
| 2026-02-17 | 13F | Advisory Services Network, LLC | 0 | -100,00 | 0 | |||||
| 2026-02-13 | 13F | Brown Advisory Inc | 10.858 | 1,17 | 579 | 3,76 | ||||
| 2026-02-20 | 13F | Sunbelt Securities, Inc. | 689 | 37,80 | 37 | 38,46 | ||||
| 2026-01-27 | 13F | Berger Financial Group, Inc | 3.784 | 202 | ||||||
| 2026-02-05 | 13F | Cambridge Investment Research Advisors, Inc. | 26.335 | 105,44 | 1 | |||||
| 2026-02-12 | 13F | Brueske Advisory Services, LLC | 0 | -100,00 | 0 | |||||
| 2026-02-17 | 13F | Per Stirling Capital Management, LLC. | 26.071 | 16,98 | 1.391 | 20,02 | ||||
| 2026-04-17 | 13F | New Covenant Trust Company, N.A. | 11.965 | -4,55 | 614 | -8,92 | ||||
| 2026-02-05 | 13F | Northwestern Mutual Wealth Management Co | 109.588 | 19.645,59 | 5.466 | 19.421,43 | ||||
| 2026-02-11 | 13F | Flagship Wealth Advisors, Llc | 22.120 | 1,22 | 1.180 | 3,78 | ||||
| 2026-02-12 | 13F | Johnson Financial Group, Inc. | 254 | 0,00 | 14 | 0,00 | ||||
| 2026-02-12 | 13F | Steward Partners Investment Advisory, Llc | 625 | 380,77 | 33 | 450,00 | ||||
| 2026-04-20 | 13F | CWA Asset Management Group, LLC | 0 | -100,00 | 0 | |||||
| 2026-01-21 | 13F | Sound Income Strategies, LLC | 485 | 0,00 | 26 | 4,00 | ||||
| 2026-04-10 | 13F | Novem Group | 454.573 | -0,96 | 23.313 | -4,82 | ||||
| 2026-04-13 | 13F | Creative Financial Designs Inc /adv | 500 | 0,20 | 26 | -3,85 | ||||
| 2026-02-10 | 13F | Envestnet Asset Management Inc | 299.951 | -6,33 | 16.005 | -3,95 | ||||
| 2026-02-13 | 13F | Kane Investment Management, Inc. | 32.782 | 1,48 | 1.749 | 4,05 | ||||
| 2026-01-29 | 13F | Comerica Bank | 1.909 | 0,00 | 102 | 2,02 | ||||
| 2026-02-13 | 13F | Wells Fargo & Company/mn | 0 | 0 | ||||||
| 2026-04-22 | 13F | Onyx Bridge Wealth Group LLC | 139.309 | -17,90 | 7.144 | -21,09 | ||||
| 2026-02-17 | 13F | Regal Investment Advisors LLC | 6.708 | -72,12 | 358 | -71,46 | ||||
| 2026-01-30 | 13F | Socha Financial Group, LLC | 593.408 | -35,44 | 31.664 | -33,80 | ||||
| 2026-02-17 | 13F | Raymond James Financial Inc | 7.344 | 0,00 | 392 | 2,36 | ||||
| 2026-02-05 | 13F | Thrivent Financial For Lutherans | 56.640 | -7,77 | 3 | 0,00 | ||||
| 2026-02-10 | 13F | Foundations Investment Advisors, LLC | 5.490 | -13,35 | 293 | -11,25 | ||||
| 2026-02-13 | 13F | Flow Traders U.s. Llc | 14.215 | 1 | ||||||
| 2026-02-03 | 13F | Vantage Financial Partners, LLC | 10.165 | 0,42 | 542 | 3,04 | ||||
| 2026-04-22 | 13F | Patriot Financial Group Insurance Agency, LLC | 53.764 | 109,53 | 2.757 | 101,39 | ||||
| 2026-04-07 | 13F | Central Pacific Bank - Trust Division | 160 | 0,00 | 8 | 0,00 | ||||
| 2026-02-10 | 13F | Principia Wealth Advisory, LLC | 930 | -9,71 | 50 | -7,55 | ||||
| 2026-02-04 | 13F | Ameritas Advisory Services, LLC | 0 | -100,00 | 0 | |||||
| 2026-04-20 | 13F | Kestra Private Wealth Services, Llc | 166.994 | 30,72 | 8.564 | 25,65 | ||||
| 2026-04-22 | 13F | Coston, McIsaac & Partners | 668 | 42,13 | 0 | |||||
| 2026-01-26 | 13F | Private Trust Co Na | 245 | 0,00 | 13 | 8,33 | ||||
| 2026-02-04 | 13F | MONECO Advisors, LLC | 7.311 | 0,43 | 390 | 3,17 | ||||
| 2026-02-13 | 13F | Morgan Stanley | 1.414 | 53,70 | 75 | 59,57 | ||||
| 2026-02-17 | 13F | Mercer Global Advisors Inc /adv | 6.031 | 322 | ||||||
| 2026-02-13 | 13F | Kestra Advisory Services, LLC | 0 | -100,00 | 0 | |||||
| 2026-04-16 | 13F | Brookstone Capital Management | 6.341 | 325 | ||||||
| 2026-02-12 | 13F | Commonwealth Equity Services, Llc | 1.338.379 | 10,39 | 71.416 | 113.257,14 | ||||
| 2026-02-13 | 13F | Mml Investors Services, Llc | 35.518 | -40,06 | 1.895 | -38,53 | ||||
| 2026-02-13 | 13F | Bay Colony Advisory Group, Inc d/b/a Bay Colony Advisors | 0 | -100,00 | 0 | -100,00 | ||||
| 2026-01-29 | 13F | Sanctuary Advisors, LLC | 27.813 | 3,51 | 1.484 | 6,15 | ||||
| 2025-11-14 | 13F | Two Sigma Investments, Lp | 0 | -100,00 | 0 | |||||
| 2026-02-13 | 13F | Visionary Wealth Advisors | 6.274 | 20,56 | 335 | 23,70 | ||||
| 2026-04-17 | 13F | RFG Advisory, LLC | 0 | -100,00 | 0 | |||||
| 2026-02-11 | 13F | Jpmorgan Chase & Co | 139 | -6,08 | 7 | 0,00 | ||||
| 2026-04-08 | 13F | Wealth Enhancement Advisory Services, Llc | 8.164 | -2,37 | 423 | -7,03 | ||||
| 2026-02-13 | 13F | Ausdal Financial Partners, Inc. | 0 | -100,00 | 0 | |||||
| 2026-04-10 | 13F | Perigon Wealth Management, LLC | 8.084 | 0,00 | 415 | -3,94 | ||||
| 2026-02-26 | 13F | TD Capital Management LLC | 2.132 | 114 | ||||||
| 2025-11-07 | 13F | Pnc Financial Services Group, Inc. | 0 | -100,00 | 0 | |||||
| 2026-02-09 | 13F | Huntington National Bank | 14.357 | 1,99 | ||||||
| 2026-04-23 | 13F | J.w. Cole Advisors, Inc. | 0 | -100,00 | 0 | |||||
| 2026-04-24 | 13F | Root Financial Partners, LLC | 2.500 | 128 | ||||||
| 2025-11-03 | 13F | Mirae Asset Global Investments Co., Ltd. | 0 | -100,00 | 0 | |||||
| 2026-02-13 | 13F | Gts Securities Llc | 9.904 | 37,48 | 528 | 41,18 | ||||
| 2025-11-06 | 13F | Abich Financial Wealth Management LLC | 357 | 19 | ||||||
| 2026-02-09 | 13F | Harbour Investments, Inc. | 94.789 | -11,50 | 5.058 | -9,26 | ||||
| 2026-02-13 | 13F | Integrated Wealth Concepts LLC | 0 | -100,00 | 0 | |||||
| 2025-11-12 | 13F | Ameriflex Group, Inc. | 0 | -100,00 | 0 | |||||
| 2026-04-16 | 13F | Triad Wealth Partners, LLC | 14.999 | 135,46 | 769 | 126,84 | ||||
| 2026-02-04 | 13F | Pensionmark Financial Group, Llc | 16.496 | 53,05 | 880 | 57,14 | ||||
| 2026-01-14 | 13F | Tradewinds Capital Management, LLC | 0 | -100,00 | 0 | |||||
| 2025-11-14 | 13F | Goldman Sachs Group Inc | 0 | -100,00 | 0 | |||||
| 2026-02-17 | 13F | Fmr Llc | 24.601 | 48,07 | 1.313 | 51,85 | ||||
| 2026-02-13 | 13F | Stifel Financial Corp | 37.178 | 1.984 | ||||||
| 2026-01-27 | 13F | Prasad Wealth Partners, LLC | 254.316 | 1,98 | 13.570 | 4,57 | ||||
| 2026-01-30 | 13F | Sigma Planning Corp | 9.600 | 17,81 | 512 | 20,75 | ||||
| 2026-02-13 | 13F | Aptus Capital Advisors, LLC | 8.561 | 293,43 | 457 | 303,54 | ||||
| 2026-02-17 | 13F | Royal Bank Of Canada | 20.969 | -1,56 | 1.120 | 0,99 | ||||
| 2026-04-23 | 13F | Atlas Private Wealth Advisors | 13.705 | 47,37 | 703 | 41,53 | ||||
| 2026-04-07 | 13F | Farther Finance Advisors, LLC | 19.443 | 0,23 | 1.007 | -2,71 | ||||
| 2026-04-16 | 13F | Tactive Advisors, LLC | 237.650 | -13,16 | 12.188 | -16,54 | ||||
| 2026-02-06 | 13F | New Millennium Group LLC | 0 | 0 | ||||||
| 2026-02-12 | 13F | Jane Street Group, Llc | 9.878 | -80,75 | 527 | -80,26 | ||||
| 2026-02-17 | 13F | Citadel Advisors Llc | 0 | -100,00 | 0 | |||||
| 2026-01-26 | 13F | Cwm, Llc | 3.819 | 8,93 | 0 | |||||
| 2026-02-10 | 13F | Thoroughbred Financial Services, Llc | 40.141 | 12,92 | 2 | 100,00 | ||||
| 2025-11-06 | 13F | Assetmark, Inc | 0 | -100,00 | 0 | |||||
| 2026-02-11 | 13F | LPL Financial LLC | 1.016.452 | 11,10 | 54.238 | 13,92 | ||||
| 2026-02-13 | 13F | National Bank Of Canada /fi/ | 514 | 27 | ||||||
| 2026-04-06 | 13F | Rosenberg Matthew Hamilton | 96 | 0,00 | 5 | -20,00 | ||||
| 2026-02-17 | 13F | Cetera Investment Advisers | 19.402 | 69,41 | 1.035 | 73,66 | ||||
| 2026-04-15 | 13F | Nations Financial Group Inc, /ia/ /adv | 135.846 | 1,12 | 6.967 | -2,82 | ||||
| 2026-02-12 | 13F | Principal Securities, Inc. | 6.444 | 32,32 | 344 | 35,57 | ||||
| 2026-01-23 | 13F | RFG - Bristol Wealth Advisors, LLC | 117.917 | 54,61 | 6.292 | 58,57 | ||||
| 2026-04-21 | 13F | OneAscent Financial Services LLC | 8.517 | -0,86 | 437 | -4,80 | ||||
| 2026-02-02 | 13F | Holistic Planning, LLC | 6.897 | 368 | ||||||
| 2026-02-04 | 13F | Anson Capital, Inc. | 54.482 | -5,54 | 2.907 | -3,13 | ||||
| 2026-02-12 | 13F | Brinker Capital Investments, LLC | 41.646 | -25,49 | 2.222 | -23,59 | ||||
| 2026-01-26 | 13F | AE Wealth Management LLC | 0 | -100,00 | 0 | |||||
| 2026-04-08 | 13F | High Point Wealth Management, LLC | 307 | 0,33 | 16 | -6,25 | ||||
| 2026-01-29 | 13F | Concurrent Investment Advisors, LLC | 127.193 | 0,02 | 6.787 | 2,57 | ||||
| 2026-02-10 | 13F | Florida Financial Advisors, Llc | 4.847 | -6,21 | 259 | -3,73 | ||||
| 2026-02-09 | 13F | Atlantic Trust, LLC | 104 | 0,00 | 6 | 0,00 | ||||
| 2026-02-05 | 13F | Dana Investment Advisors, Inc. | 37.344 | -0,77 | 1.993 | 1,74 | ||||
| 2026-02-17 | 13F | Advisor Group Holdings, Inc. | 189.669 | 5,25 | 10.123 | 9,03 | ||||
| 2026-04-15 | 13F | Dedeker Financial LLC | 118.819 | -7,09 | 6.094 | -10,71 | ||||
| 2026-04-17 | 13F/A | Founders Financial Securities Llc | 35.446 | 8,64 | 1.921 | 10,40 | ||||
| 2026-02-17 | 13F | Equitable Holdings, Inc. | 86.345 | 81,54 | 4.607 | 86,14 | ||||
| 2026-02-10 | 13F | IFG Advisory, LLC | 93.501 | 4.989 |
Other Listings
| US:FFLC | 57,00 $ |