Grundlæggende statistik
| Institutionelle ejere | 178 total, 178 long only, 0 short only, 0 long/short - change of 4,07% MRQ |
| Gennemsnitlig porteføljeallokering | 0.1662 % - change of -6,68% MRQ |
| Institutionelle aktier (lange) | 13.365.158 (ex 13D/G) - change of 0,70MM shares 5,51% MRQ |
| Institutionel værdi (lang) | $ 613.918 USD ($1000) |
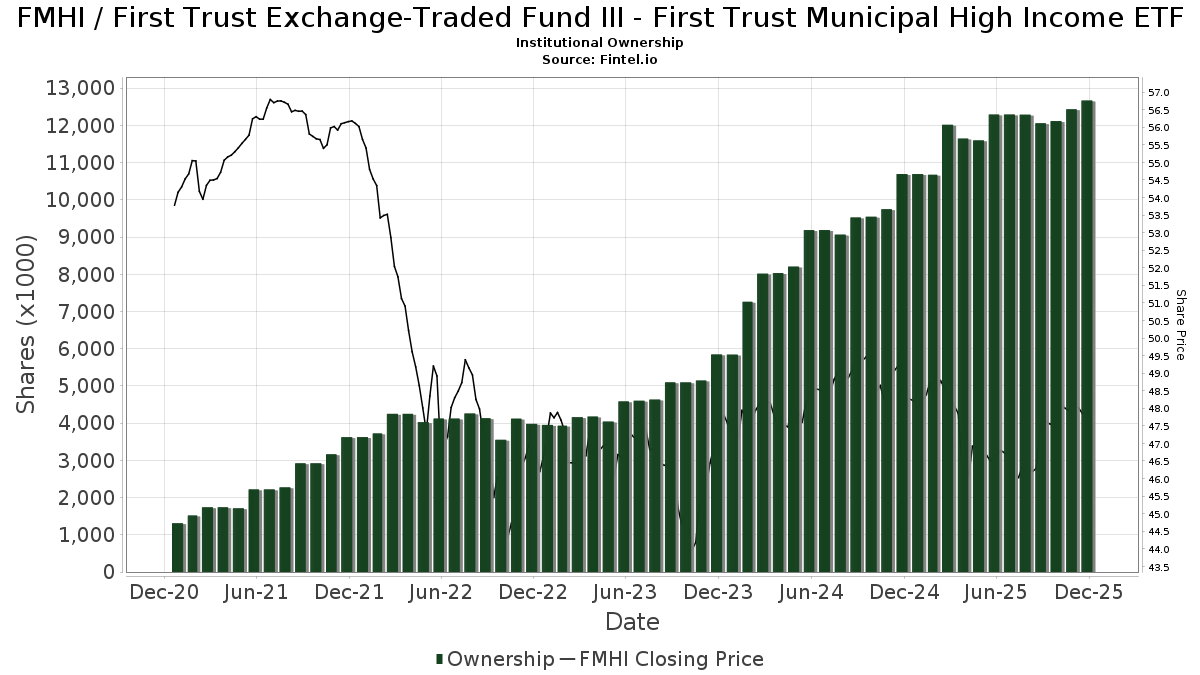
Institutionelt ejerskab og aktionærer
First Trust Exchange-Traded Fund III - First Trust Municipal High Income ETF (US:FMHI) har 178 institutionelle ejere og aktionærer, der har indsendt 13D/G- eller 13F-formularer til Securities Exchange Commission (SEC). Disse institutioner har i alt 13,365,158 aktier. Største aktionærer omfatter Wealth Enhancement Advisory Services, Llc, Morgan Stanley, LPL Financial LLC, Wells Fargo & Company/mn, Bank Of America Corp /de/, Meeder Advisory Services, Inc., Citigroup Inc, UBS Group AG, Raymond James Financial Inc, and Cetera Investment Advisers .
First Trust Exchange-Traded Fund III - First Trust Municipal High Income ETF (NasdaqGM:FMHI) institutionel ejerskabsstruktur viser aktuelle positioner i virksomheden efter institutioner og fonde, samt seneste ændringer i positionsstørrelse. Større aktionærer kan omfatte individuelle investorer, investeringsforeninger, hedgefonde eller institutioner. Skema 13D angiver, at investoren besidder (eller besidder) mere end 5 % af virksomheden og har til hensigt (eller har til hensigt at) aktivt at forfølge en ændring i forretningsstrategi. Skema 13G indikerer en passiv investering på over 5%.
The share price as of March 18, 2026 is 48,09 / share. Previously, on March 19, 2025, the share price was 48,25 / share. This represents a decline of 0,33% over that period.
Fondens stemningsscore
Fund Sentiment Score (fka Ownership Accumulation Score) finder de aktier, der bliver mest købt af fonde. Det er resultatet af en sofistikeret, multi-faktor kvantitativ model, der identificerer virksomheder med de højeste niveauer af institutionel akkumulering. Scoringsmodellen bruger en kombination af den samlede stigning i oplyste ejere, ændringerne i porteføljeallokeringer i disse ejere og andre målinger. Tallet går fra 0 til 100, hvor højere tal indikerer et højere niveau af akkumulering for sine jævnaldrende, og 50 er gennemsnittet.
Opdateringsfrekvens: Dagligt
Se Ownership Explorer, som giver en liste over højest rangerende virksomheder.
AI+ Ask Fintel’s AI assistant about First Trust Exchange-Traded Fund III - First Trust Municipal High Income ETF.
Select a question to share a public post with an AI-crafted answer.
Thinking of good questions…
Institutionel Put/Call-forhold
Ud over at indberette standardaktie- og gældsudstedelser skal institutter med mere end 100 mill. aktiver under forvaltning også oplyse deres put- og call-optionsbeholdninger. Da salgsoptioner generelt indikerer negativ stemning, og købsoptioner indikerer positiv stemning, kan vi få en fornemmelse af den overordnede institutionelle stemning ved at plotte forholdet mellem put og kald. Diagrammet til højre viser det historiske put/call-forhold for dette instrument.
Brug af Put/Call Ratio som en indikator for investorernes stemning overvinder en af de vigtigste mangler ved at bruge totalt institutionelt ejerskab, som er, at en betydelig mængde af aktiver under forvaltning investeres passivt for at spore indekser. Passivt forvaltede fonde køber typisk ikke optioner, så indikatoren for put/call-forholdet følger mere nøje følelsen af aktivt forvaltede fonde.
13F og NPORT arkivering
Detaljer om 13F-arkivering er gratis. Detaljer om NP-ansøgninger kræver et premium-medlemskab. Grønne rækker angiver nye positioner. Røde rækker angiver lukkede positioner. Klik på linket ikon for at se den fulde transaktionshistorik.
Opgrader
for at låse premium-data op og eksportere til Excel ![]() .
.
| Fil dato | Kilde | Investor | Type | Gennemsnitlig pris (Øst) |
Aktier | Δ Aktier (%) |
Rapporteret Værdi ($1000) |
Δ Værdi (%) |
Port Alloc (%) |
|
|---|---|---|---|---|---|---|---|---|---|---|
| 2026-02-05 | 13F | Cornerstone Wealth Management, LLC | 81.032 | 1,12 | 3.884 | 2,02 | ||||
| 2026-02-17 | 13F | Citadel Advisors Llc | 15.423 | 148,00 | 739 | 150,51 | ||||
| 2026-01-21 | 13F | Flagship Harbor Advisors, Llc | 150 | 7 | ||||||
| 2026-02-17 | 13F | Raymond James Financial Inc | 307.205 | 43,13 | 14.726 | 44,41 | ||||
| 2026-01-29 | 13F | Sanctuary Advisors, LLC | 21.420 | 10,30 | 1.027 | 11,28 | ||||
| 2026-01-07 | 13F | Sagespring Wealth Partners, Llc | 15.187 | 32,51 | 728 | 33,64 | ||||
| 2026-01-23 | 13F | High Net Worth Advisory Group LLC | 22.312 | 0,37 | 1.070 | 1,23 | ||||
| 2026-01-28 | 13F | Chicago Partners Investment Group LLC | 5.840 | -14,43 | 280 | -14,94 | ||||
| 2026-02-12 | 13F | CIBC Private Wealth Group, LLC | 3 | -95,38 | 0 | -100,00 | ||||
| 2026-02-11 | 13F | J.w. Cole Advisors, Inc. | 14.802 | 8,04 | 116 | -82,31 | ||||
| 2026-01-23 | 13F | Farther Finance Advisors, LLC | 539 | -55,34 | 26 | -56,14 | ||||
| 2026-02-10 | 13F | Goldman Sachs Group Inc | 18.351 | 880 | ||||||
| 2026-01-21 | 13F | Crux Wealth Advisors | 6.364 | 305 | ||||||
| 2026-01-29 | 13F | D.a. Davidson & Co. | 46.928 | 6,91 | 2.249 | 7,87 | ||||
| 2026-01-20 | 13F | AdvisorNet Financial, Inc | 11.349 | -1,43 | 544 | -0,55 | ||||
| 2026-01-20 | 13F | Stratos Wealth Partners, LTD. | 8.771 | 55,46 | 420 | 56,72 | ||||
| 2025-11-04 | 13F | Pineridge Advisors LLC | 2.038 | -43,95 | 97 | -43,20 | ||||
| 2026-01-26 | 13F | Seamount Financial Group Inc | 15.547 | 0,50 | 745 | 1,50 | ||||
| 2026-02-05 | 13F | Stonebridge Financial Planning Group, LLC | 12.552 | 602 | ||||||
| 2026-02-12 | 13F | Commonwealth Equity Services, Llc | 57.479 | -14,58 | 2.755 | 91.733,33 | ||||
| 2026-02-02 | 13F | Mutual Advisors, LLC | 36.599 | -2,46 | 1.754 | -2,77 | ||||
| 2026-02-02 | 13F | Manhattan West Asset Management, LLC | 212.202 | -1,10 | 10.172 | -0,22 | ||||
| 2026-02-17 | 13F | Snowden Capital Advisors LLC | 5.677 | 18,54 | 272 | 19,82 | ||||
| 2026-01-28 | 13F | Evergreen Private Wealth LLC | 37.912 | 8,67 | 1.817 | 9,66 | ||||
| 2026-02-17 | 13F | Signature Equity Partners, LLC | 988 | 47 | ||||||
| 2026-02-17 | 13F | Aqr Capital Management Llc | 5.078 | 0,00 | 243 | 0,83 | ||||
| 2026-02-05 | 13F | Cambridge Investment Research Advisors, Inc. | 109.327 | 30,21 | 5 | 66,67 | ||||
| 2026-01-29 | 13F | Traction Financial Partners, LLC | 20.465 | -2,40 | 981 | -1,61 | ||||
| 2026-02-12 | 13F | Rossby Financial, LCC | 130 | 0,00 | 6 | 0,00 | ||||
| 2026-02-03 | 13F | International Assets Investment Management, Llc | 61.087 | 501,43 | 2.928 | 517,72 | ||||
| 2026-02-13 | 13F | Morgan Stanley | 1.321.787 | 9,74 | 63.359 | 10,72 | ||||
| 2026-02-05 | 13F | Stephens Inc /ar/ | 45.738 | -24,56 | 2.192 | -23,89 | ||||
| 2026-01-09 | 13F | Dynamic Advisor Solutions LLC | 8.073 | 5,47 | 387 | 6,34 | ||||
| 2026-01-12 | 13F | Daymark Wealth Partners, Llc | 50.525 | 9,92 | 2.422 | 10,90 | ||||
| 2026-01-29 | 13F | Kestra Private Wealth Services, Llc | 43.956 | 47,88 | 2.107 | 49,22 | ||||
| 2026-02-13 | 13F | Level Four Advisory Services, Llc | 5.987 | -9,92 | 287 | -9,21 | ||||
| 2026-02-13 | 13F | Stifel Financial Corp | 30.893 | 24,18 | 1.481 | 25,32 | ||||
| 2026-02-17 | 13F | Private Advisor Group, LLC | 86.569 | 5,13 | 4.150 | 6,06 | ||||
| 2025-11-14 | 13F | Old Mission Capital Llc | 0 | -100,00 | 0 | |||||
| 2026-01-16 | 13F | Genesee Capital Advisors, LLC | 7.630 | -0,74 | 366 | 0,00 | ||||
| 2026-02-13 | 13F | MAI Capital Management | 1.028 | 0,00 | 49 | 2,08 | ||||
| 2026-01-22 | 13F | Curran Financial Partners, LLC | 17.895 | 16,47 | 858 | 17,56 | ||||
| 2026-01-27 | 13F | Summit Wealth Partners, LLC | 14.401 | 0,00 | 690 | 0,88 | ||||
| 2026-02-13 | 13F | Baird Financial Group, Inc. | 6.100 | -6,15 | 292 | -5,19 | ||||
| 2026-02-09 | 13F | Prospera Financial Services Inc | 7.410 | -35,73 | 355 | -35,10 | ||||
| 2026-01-23 | 13F | Hedeker Wealth, LLC | 9.896 | 1,06 | 474 | 1,94 | ||||
| 2025-11-12 | 13F | Creative Financial Designs Inc /adv | 0 | -100,00 | 0 | |||||
| 2026-01-28 | 13F | Geneos Wealth Management Inc. | 6.037 | 22,36 | 289 | 23,50 | ||||
| 2026-02-11 | 13F | SlateStone Wealth, LLC | 269.208 | 10,19 | 13 | 9,09 | ||||
| 2026-02-12 | 13F | Principal Securities, Inc. | 0 | -100,00 | 0 | -100,00 | ||||
| 2026-01-09 | 13F | Marshall Financial Group LLC | 12.362 | -8,29 | 593 | -7,50 | ||||
| 2026-01-27 | 13F | Duncker Streett & Co Inc | 1.392 | 0,00 | 67 | 0,00 | ||||
| 2026-02-12 | 13F | Brown Brothers Harriman & Co | 338 | 16 | ||||||
| 2026-01-13 | 13F | Signature Securities Group Corporation | 4.814 | -37,76 | 231 | -37,33 | ||||
| 2026-02-03 | 13F | RFG Advisory, LLC | 34.599 | 246,54 | 1.658 | 249,79 | ||||
| 2025-11-10 | 13F | Invictus Private Wealth, Llc | 0 | -100,00 | 0 | |||||
| 2026-01-28 | 13F | EnRich Financial Partners LLC | 176.821 | 1,07 | 8.476 | 1,97 | ||||
| 2026-02-17 | 13F | Equitable Holdings, Inc. | 78.824 | -1,85 | 3.778 | -0,97 | ||||
| 2026-02-18 | 13F | GWM Advisors LLC | 0 | -100,00 | 0 | |||||
| 2026-02-11 | 13F | LPL Financial LLC | 1.167.716 | 12,49 | 55.974 | 13,50 | ||||
| 2026-02-17 | 13F | Cetera Investment Advisers | 277.945 | 13,54 | 13.323 | 14,56 | ||||
| 2026-02-13 | 13F | SRS Capital Advisors, Inc. | 27.494 | 1.318 | ||||||
| 2026-02-13 | 13F | Kestra Advisory Services, LLC | 0 | -100,00 | 0 | |||||
| 2026-02-13 | 13F | Change Path, LLC | 11.584 | 17,80 | 555 | 18,84 | ||||
| 2026-01-21 | 13F | Capital Investment Advisory Services, LLC | 16.796 | 0,63 | 805 | 1,64 | ||||
| 2025-11-13 | 13F | Seacrest Wealth Management, Llc | 0 | -100,00 | 0 | |||||
| 2026-01-29 | 13F | Nbc Securities, Inc. | 151 | 4,14 | 7 | 16,67 | ||||
| 2026-02-17 | 13F | Bank Of America Corp /de/ | 645.750 | 77,41 | 30.953 | 78,99 | ||||
| 2025-11-12 | 13F | Armis Advisers, LLC | 0 | -100,00 | 0 | |||||
| 2025-11-05 | 13F | Lokken Investment Group LLC | 7.368 | 350 | ||||||
| 2026-01-14 | 13F | Wealthcare Advisory Partners LLC | 0 | -100,00 | 0 | |||||
| 2026-02-10 | 13F | Dynasty Wealth Management, Llc | 11.421 | 1,21 | 547 | 2,05 | ||||
| 2026-01-26 | 13F | AE Wealth Management LLC | 6.553 | 9,93 | 314 | 10,95 | ||||
| 2026-02-13 | 13F | Arkadios Wealth Advisors | 6.683 | 320 | ||||||
| 2026-02-17 | 13F | Gladstone Institutional Advisory LLC | 9.704 | -20,86 | 465 | -20,10 | ||||
| 2026-02-10 | 13F | Evolution Wealth Management Inc. | 582 | 0,00 | 28 | 0,00 | ||||
| 2026-02-14 | 13F | Rockefeller Capital Management L.P. | 128.294 | 2,52 | 6.150 | 3,43 | ||||
| 2026-02-12 | 13F | Brinker Capital Investments, LLC | 9.381 | 24,32 | 450 | 25,42 | ||||
| 2026-01-23 | 13F | Clear Creek Financial Management, LLC | 5.452 | 29,50 | 261 | 30,50 | ||||
| 2026-02-09 | 13F | Investors Portfolio Services LLC | 17.044 | 817 | ||||||
| 2025-11-12 | 13F | Creekmur Asset Management LLC | 1.107 | 0,00 | 53 | 1,96 | ||||
| 2026-02-13 | 13F | Integrated Wealth Concepts LLC | 30.745 | -37,48 | 1.474 | -36,94 | ||||
| 2026-02-05 | 13F | Tucker Asset Management Llc | 214 | 10 | ||||||
| 2026-02-13 | 13F | Citigroup Inc | 410.996 | -3,16 | 19.701 | -2,30 | ||||
| 2026-02-17 | 13F | Royal Bank Of Canada | 133.827 | -16,15 | 6.415 | -15,40 | ||||
| 2026-01-26 | 13F | Cwm, Llc | 110.529 | -1,71 | 5 | 0,00 | ||||
| 2026-02-13 | 13F | Visionary Wealth Advisors | 0 | -100,00 | 0 | |||||
| 2026-01-07 | 13F | Cyndeo Wealth Partners, LLC | 92.000 | -1,12 | 4.410 | -0,25 | ||||
| 2026-01-26 | 13F | Private Trust Co Na | 2.849 | -14,19 | 137 | -13,38 | ||||
| 2026-02-03 | 13F | Fsb Premier Wealth Management, Inc. | 4.888 | 14,21 | 234 | 15,27 | ||||
| 2026-02-17 | 13F | Ameriflex Group, Inc. | 159 | -50,00 | 8 | -53,33 | ||||
| 2026-02-11 | 13F | Vise Technologies, Inc. | 116.797 | 147,18 | 5.599 | 149,47 | ||||
| 2026-02-10 | 13F/A | Northwestern Mutual Wealth Management Co | 6.666 | 0,45 | 320 | 1,27 | ||||
| 2026-02-02 | 13F | Truist Financial Corp | 58.177 | 0,96 | 2.789 | 1,86 | ||||
| 2026-02-11 | 13F | Jpmorgan Chase & Co | 186.949 | 54,83 | 8.961 | 56,22 | ||||
| 2026-01-21 | 13F | AJ Advisors, LLC | 60.429 | 7,71 | 2.897 | 8,67 | ||||
| 2026-02-13 | 13F | Capital Financial Group Inc\co\ /adv | 39.474 | 1.892 | ||||||
| 2026-02-06 | 13F | IFP Advisors, Inc | 31.689 | -5,69 | 1.519 | -4,89 | ||||
| 2026-02-12 | 13F | Skopos Labs, Inc. | 7.385 | 354 | ||||||
| 2025-11-04 | 13F | Jones Financial Companies Lllp | 0 | -100,00 | 0 | |||||
| 2026-02-13 | 13F | Altus Wealth Group LLC | 7.484 | 4,47 | 359 | 5,29 | ||||
| 2025-11-13 | 13F | Newbridge Financial Services Group, Inc. | 0 | 0 | ||||||
| 2026-01-22 | 13F | Financial Consulate, Inc | 10 | 0 | ||||||
| 2026-02-17 | 13F | Captrust Financial Advisors | 12.113 | -13,93 | 581 | -13,17 | ||||
| 2026-01-26 | 13F | Nations Financial Group Inc, /ia/ /adv | 18.860 | 3,14 | 904 | 4,15 | ||||
| 2026-01-21 | 13F | MBL Wealth, LLC | 74.470 | 1,07 | 3.570 | 1,97 | ||||
| 2026-02-10 | 13F | IFG Advisory, LLC | 17.527 | 840 | ||||||
| 2026-02-13 | 13F | Golden State Wealth Management, LLC | 225 | 0,00 | 11 | 0,00 | ||||
| 2026-02-06 | 13F | HighTower Advisors, LLC | 129.117 | 6,67 | 6.189 | 7,63 | ||||
| 2025-10-06 | 13F | Insight Wealth Strategies, LLC | 0 | -100,00 | 0 | |||||
| 2026-02-13 | 13F | Flow Traders U.s. Llc | 17.591 | 1 | ||||||
| 2026-02-10 | 13F | Envestnet Asset Management Inc | 75.939 | 6,67 | 3.640 | 7,63 | ||||
| 2026-02-13 | 13F | Jacobi Capital Management LLC | 5.433 | 0,95 | 260 | 1,96 | ||||
| 2026-02-17 | 13F | Wiley Bros.-aintree Capital, Llc | 17.141 | 822 | ||||||
| 2026-02-05 | 13F | Triton Wealth Management, PLLC | 23.428 | -1,64 | 1.127 | -1,57 | ||||
| 2026-02-03 | 13F | Legacy Wealth Managment, LLC/ID | 181 | 9 | ||||||
| 2026-02-17 | 13F | Main Street Financial Solutions, LLC | 25.965 | 16,20 | 1.245 | 17,25 | ||||
| 2026-02-06 | 13F | Principle Wealth Partners Llc | 230.094 | -19,92 | 11.029 | -19,20 | ||||
| 2026-02-11 | 13F | Capital Analysts, Inc. | 1.443 | 0,00 | 0 | |||||
| 2026-02-13 | 13F | Wells Fargo & Company/mn | 1.145.777 | 15,60 | 54.922 | 16,63 | ||||
| 2025-11-12 | 13F | Per Stirling Capital Management, LLC. | 0 | -100,00 | 0 | |||||
| 2026-02-13 | 13F | Platform Technology Partners | 19.060 | -56,60 | 914 | -56,23 | ||||
| 2025-10-07 | 13F | EWG Elevate Inc. | 49.639 | 7,91 | 2.358 | 9,78 | ||||
| 2026-02-02 | 13F | Ashton Thomas Securities, Llc | 136.878 | -2,82 | 6.561 | -1,94 | ||||
| 2026-01-29 | 13F | Comerica Bank | 19.341 | -4,59 | 927 | -3,74 | ||||
| 2026-02-10 | 13F | ShoreHaven Wealth Partners, LLC | 49.860 | 9,48 | 2.390 | 10,49 | ||||
| 2026-01-08 | 13F | GSG Advisors LLC | 27.163 | -36,95 | 1.302 | -36,43 | ||||
| 2026-02-03 | 13F | Plan Group Financial, LLC | 82.516 | 37,34 | 3.955 | 38,58 | ||||
| 2026-02-10 | 13F | Rothschild Investment Llc | 625 | 0,00 | 30 | 0,00 | ||||
| 2026-01-26 | 13F | Milestones Private Investment Advisors LLC | 15.751 | 0,47 | 755 | 1,48 | ||||
| 2026-02-02 | 13F | Total Clarity Wealth Management, Inc. | 4.315 | -32,23 | 207 | -31,79 | ||||
| 2026-01-13 | 13F | CoreCap Advisors, LLC | 3.792 | 243,79 | 182 | 248,08 | ||||
| 2026-02-13 | 13F | Mml Investors Services, Llc | 113.120 | 11,46 | 5.422 | 12,47 | ||||
| 2026-02-13 | 13F | Resources Investment Advisors, LLC. | 14.318 | 0,00 | 686 | 0,88 | ||||
| 2026-02-11 | 13F | Waddell & Associates, Llc | 5.570 | 0,00 | 267 | 0,76 | ||||
| 2026-02-09 | 13F | Harbour Investments, Inc. | 18.305 | 44,36 | 877 | 45,68 | ||||
| 2026-01-28 | 13F | Arbor Capital Management Inc /adv | 16.354 | 4,98 | 786 | 6,08 | ||||
| 2026-01-15 | 13F | Stewardship Advisors, LLC | 81.744 | 6,37 | 3.918 | 7,31 | ||||
| 2026-01-15 | 13F | Wright Fund Managment, LLC | 116.300 | 0,00 | 5.575 | 0,89 | ||||
| 2026-02-11 | 13F | Janney Montgomery Scott LLC | 37.716 | 17,76 | 2 | 0,00 | ||||
| 2026-02-04 | 13F/A | Nwam Llc | 0 | -100,00 | 0 | |||||
| 2026-01-29 | 13F | UBS Group AG | 324.495 | 10,34 | 15.554 | 11,32 | ||||
| 2025-11-12 | 13F | Trustmark National Bank Trust Department | 0 | -100,00 | 0 | |||||
| 2026-02-06 | 13F | Vestmark Advisory Solutions, Inc. | 27.284 | 21,73 | 1.308 | 22,84 | ||||
| 2026-02-03 | 13F | Koshinski Asset Management, Inc. | 9.574 | 459 | ||||||
| 2026-02-09 | 13F | Keating Financial Advisory Services, Inc. | 8.620 | 413 | ||||||
| 2026-01-27 | 13F | First Horizon Corp | 49.500 | 0,00 | 2.373 | 0,89 | ||||
| 2026-01-13 | 13F | Dakota Wealth Management | 7.368 | 353 | ||||||
| 2026-02-17 | 13F | Susquehanna International Group, Llp | 0 | -100,00 | 0 | |||||
| 2026-01-21 | 13F | Country Trust Bank | 15.125 | -3,17 | 725 | -2,29 | ||||
| 2026-02-03 | 13F | Financial Partners Group, Inc | 227.133 | 14,57 | 10.910 | 15,83 | ||||
| 2026-01-23 | 13F | DHJJ Financial Advisors, Ltd. | 8.911 | -0,10 | 427 | 0,95 | ||||
| 2026-01-15 | 13F | Rockland Trust Co | 36.992 | 0,00 | 1.773 | 0,91 | ||||
| 2026-02-06 | 13F | Larson Financial Group LLC | 587 | 0,00 | 28 | 3,70 | ||||
| 2026-02-06 | 13F | Envestnet Portfolio Solutions, Inc. | 9.767 | 6,84 | 468 | 7,83 | ||||
| 2026-02-17 | 13F | Advisory Services Network, LLC | 8.302 | -8,85 | 398 | -8,10 | ||||
| 2026-01-06 | 13F | WealthCare Investment Partners, LLC | 9.405 | -1,32 | 451 | -0,44 | ||||
| 2026-01-23 | 13F | Westside Investment Management, Inc. | 4.900 | -2,00 | 235 | -1,27 | ||||
| 2026-01-30 | 13F | Sigma Planning Corp | 6.942 | -32,16 | 333 | -31,69 | ||||
| 2026-01-26 | 13F | Xcel Wealth Management, LLC | 6.000 | 0,00 | 288 | 0,70 | ||||
| 2026-01-29 | 13F | Camelot Portfolios, LLC | 2.000 | 96 | ||||||
| 2026-02-06 | 13F | Global Retirement Partners, LLC | 10.615 | 1,05 | 509 | 1,80 | ||||
| 2026-02-17 | 13F | Advisor Group Holdings, Inc. | 181.418 | 16,95 | 8.696 | 20,43 | ||||
| 2026-02-10 | 13F | Bank of New York Mellon Corp | 41.833 | -2,76 | 2.005 | -1,86 | ||||
| 2026-02-03 | 13F | Farmers & Merchants Investments Inc | 2.200 | 0,00 | 105 | 0,96 | ||||
| 2026-02-17 | 13F | Tower Research Capital LLC (TRC) | 8.743 | 419 | ||||||
| 2026-02-09 | 13F | Cary Street Partners Financial Llc | 11.665 | 0,00 | 559 | 0,90 | ||||
| 2026-02-17 | 13F | Mpwm Advisory Solutions, Llc | 0 | -100,00 | 0 | |||||
| 2025-11-06 | 13F | Financial Advocates Investment Management | 0 | -100,00 | 0 | |||||
| 2026-02-12 | 13F | Jane Street Group, Llc | 0 | -100,00 | 0 | |||||
| 2026-02-04 | 13F | Ameritas Advisory Services, LLC | 0 | -100,00 | 0 | |||||
| 2026-02-02 | 13F | Cornerstone Planning Group LLC | 338 | 0,90 | 16 | 0,00 | ||||
| 2026-02-09 | 13F | Key FInancial Inc | 4.375 | 0,00 | 210 | 0,48 | ||||
| 2026-01-30 | 13F | Us Bancorp \de\ | 7.970 | -33,62 | 382 | -32,98 | ||||
| 2025-10-15 | 13F | Stephens Consulting, LLC | 0 | -100,00 | 0 | |||||
| 2026-02-06 | 13F | CFO4Life Group, LLC | 5.375 | 0,00 | 258 | 0,78 | ||||
| 2026-02-05 | 13F | Landmark Wealth Management, LLC | 5.235 | 1,53 | 251 | 2,46 | ||||
| 2026-02-12 | 13F | Mount Yale Investment Advisors, LLC | 27.284 | -3,74 | 1.308 | -2,90 | ||||
| 2026-02-12 | 13F | Steward Partners Investment Advisory, Llc | 10.594 | 7,91 | 508 | 8,80 | ||||
| 2026-02-06 | 13F | Synergy Investment Management, LLC | 36.320 | 29,83 | 1.741 | 30,93 | ||||
| 2026-02-11 | 13F | Hughes Financial Services, LLC | 3.060 | -0,46 | 147 | -0,68 | ||||
| 2025-11-03 | 13F | Belpointe Asset Management LLC | 0 | -100,00 | 0 | |||||
| 2026-02-02 | 13F | Oppenheimer & Co Inc | 48.517 | 81,20 | 2.326 | 82,78 | ||||
| 2026-01-08 | 13F | Wealth Enhancement Advisory Services, Llc | 1.604.484 | 3,33 | 76.993 | 4,28 | ||||
| 2025-11-06 | 13F | Atria Investments Llc | 0 | -100,00 | 0 | |||||
| 2026-01-28 | 13F | Boyd Wealth Management, LLC | 16.318 | 0,19 | 782 | 1,16 | ||||
| 2026-01-14 | 13F | Crumly & Associates Inc. | 77.854 | -2,01 | 3.732 | -1,14 | ||||
| 2026-02-11 | 13F | OneAscent Financial Services LLC | 9.678 | -25,19 | 464 | -24,59 | ||||
| 2026-02-05 | 13F | Atlas Private Wealth Advisors | 63.711 | 0,89 | 3.054 | 1,77 | ||||
| 2026-02-13 | 13F | Advyzon Investment Management, LLC | 10.674 | 9,11 | 512 | 10,13 | ||||
| 2026-02-17 | 13F | Elequin Capital Lp | 7.105 | -76,91 | 341 | -76,73 | ||||
| 2026-01-20 | 13F | BKA Wealth Consulting, Inc. | 23.502 | -0,52 | 1.127 | 0,36 | ||||
| 2026-02-12 | 13F | Great Valley Advisor Group, Inc. | 23.018 | -79,93 | 1.103 | -79,75 | ||||
| 2026-02-13 | 13F | Mariner, LLC | 6.828 | 327 | ||||||
| 2026-02-11 | 13F | Meeder Advisory Services, Inc. | 488.345 | 23.409 | ||||||
| 2026-01-16 | 13F | Mattern Wealth Management LLC | 8.000 | 0,00 | 383 | 0,79 | ||||
| 2026-01-29 | 13F | Concurrent Investment Advisors, LLC | 18.747 | 30,41 | 899 | 31,67 | ||||
| 2026-02-17 | 13F | National Asset Management, Inc. | 0 | -100,00 | 0 | -100,00 | ||||
| 2026-01-21 | 13F | Sound Income Strategies, LLC | 228 | 0,00 | 11 | 0,00 | ||||
| 2026-02-03 | 13F | Sequoia Financial Advisors, LLC | 56.586 | -6,16 | 2.712 | -5,31 | ||||
| 2026-02-02 | 13F | Aurora Private Wealth, Inc. | 0 | -100,00 | 0 | |||||
| 2026-01-27 | 13F | Hobart Private Capital, LLC | 18.380 | 0,00 | 881 | 0,92 | ||||
| 2026-02-12 | 13F | Summit Financial, LLC | 80.320 | 9,74 | 3.850 | 10,73 | ||||
| 2026-01-21 | 13F | Sowell Financial Services LLC | 27.930 | 0,69 | 1.339 | 1,59 |