Grundlæggende statistik
| Institutionelle aktier (lange) | 5.695.099 - 18,35% (ex 13D/G) - change of 0,92MM shares 19,31% MRQ |
| Institutionel værdi (lang) | $ 19.699 USD ($1000) |
Institutionelt ejerskab og aktionærer
Fortress Biotech, Inc. (US:FBIO) har 55 institutionelle ejere og aktionærer, der har indsendt 13D/G- eller 13F-formularer til Securities Exchange Commission (SEC). Disse institutioner har i alt 5,695,099 aktier. Største aktionærer omfatter Vanguard Group Inc, Opaleye Management Inc., Summit Financial, LLC, Shikiar Asset Management Inc, Geode Capital Management, Llc, Northern Trust Corp, Susquehanna International Group, Llp, Susquehanna International Group, Llp, Sculptor Capital LP, and Sculptor Capital LP .
Fortress Biotech, Inc. (NasdaqCM:FBIO) institutionel ejerskabsstruktur viser aktuelle positioner i virksomheden efter institutioner og fonde, samt seneste ændringer i positionsstørrelse. Større aktionærer kan omfatte individuelle investorer, investeringsforeninger, hedgefonde eller institutioner. Skema 13D angiver, at investoren besidder (eller besidder) mere end 5 % af virksomheden og har til hensigt (eller har til hensigt at) aktivt at forfølge en ændring i forretningsstrategi. Skema 13G indikerer en passiv investering på over 5%.
The share price as of March 20, 2026 is 2,99 / share. Previously, on March 21, 2025, the share price was 1,71 / share. This represents an increase of 74,85% over that period.

Fondens stemningsscore
Fund Sentiment Score (fka Ownership Accumulation Score) finder de aktier, der bliver mest købt af fonde. Det er resultatet af en sofistikeret, multi-faktor kvantitativ model, der identificerer virksomheder med de højeste niveauer af institutionel akkumulering. Scoringsmodellen bruger en kombination af den samlede stigning i oplyste ejere, ændringerne i porteføljeallokeringer i disse ejere og andre målinger. Tallet går fra 0 til 100, hvor højere tal indikerer et højere niveau af akkumulering for sine jævnaldrende, og 50 er gennemsnittet.
Opdateringsfrekvens: Dagligt
Se Ownership Explorer, som giver en liste over højest rangerende virksomheder.
AI+ Ask Fintel’s AI assistant about Fortress Biotech, Inc..
Select a question to share a public post with an AI-crafted answer.
Thinking of good questions…
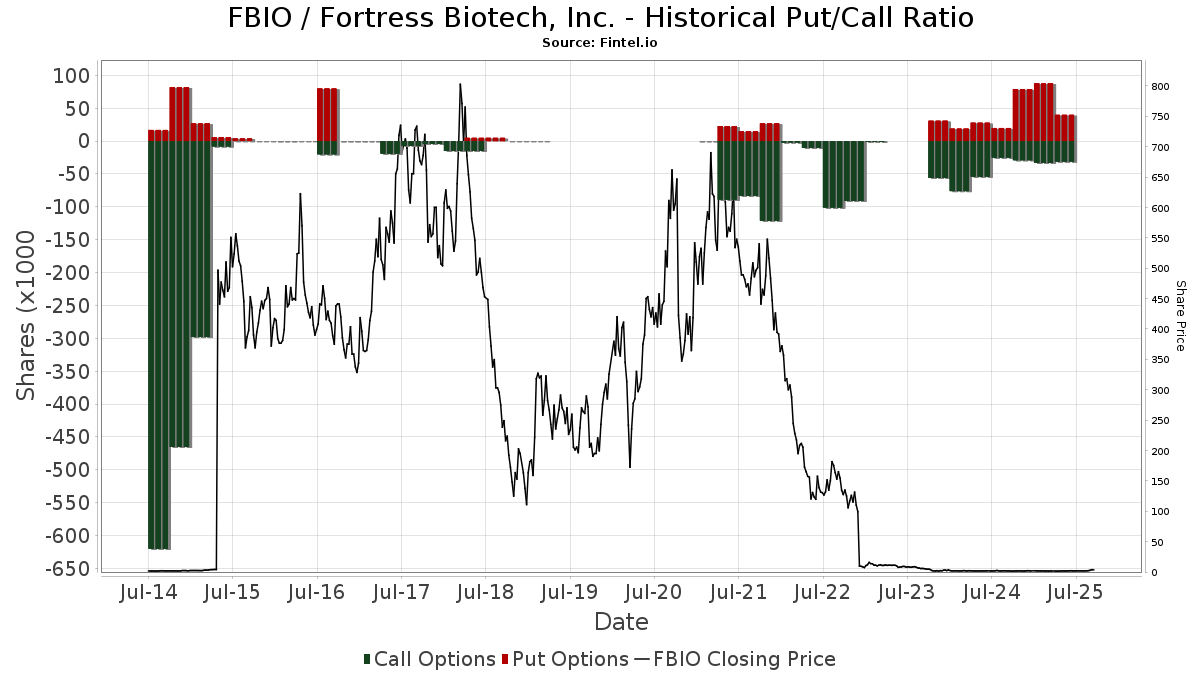
Institutionel Put/Call-forhold
Ud over at indberette standardaktie- og gældsudstedelser skal institutter med mere end 100 mill. aktiver under forvaltning også oplyse deres put- og call-optionsbeholdninger. Da salgsoptioner generelt indikerer negativ stemning, og købsoptioner indikerer positiv stemning, kan vi få en fornemmelse af den overordnede institutionelle stemning ved at plotte forholdet mellem put og kald. Diagrammet til højre viser det historiske put/call-forhold for dette instrument.
Brug af Put/Call Ratio som en indikator for investorernes stemning overvinder en af de vigtigste mangler ved at bruge totalt institutionelt ejerskab, som er, at en betydelig mængde af aktiver under forvaltning investeres passivt for at spore indekser. Passivt forvaltede fonde køber typisk ikke optioner, så indikatoren for put/call-forholdet følger mere nøje følelsen af aktivt forvaltede fonde.
13F og NPORT arkivering
Detaljer om 13F-arkivering er gratis. Detaljer om NP-ansøgninger kræver et premium-medlemskab. Grønne rækker angiver nye positioner. Røde rækker angiver lukkede positioner. Klik på linket ikon for at se den fulde transaktionshistorik.
Opgrader
for at låse premium-data op og eksportere til Excel ![]() .
.
| Fil dato | Kilde | Investor | Type | Gennemsnitlig pris (Øst) |
Aktier | Δ Aktier (%) |
Rapporteret Værdi ($1000) |
Δ Værdi (%) |
Port Alloc (%) |
|
|---|---|---|---|---|---|---|---|---|---|---|
| 2026-02-11 | 13F | Jpmorgan Chase & Co | 672 | 0,00 | 2 | 0,00 | ||||
| 2026-02-12 | 13F | BlackRock, Inc. | 200.563 | 5,67 | 734 | 4,71 | ||||
| 2026-02-09 | 13F | Geode Capital Management, Llc | 262.492 | 7,39 | 961 | 6,42 | ||||
| 2026-02-18 | 13F | GWM Advisors LLC | 32.531 | 162,35 | 119 | 164,44 | ||||
| 2026-02-10 | 13F | Weaver Consulting Group | 19.532 | -5,24 | 71 | -6,58 | ||||
| 2026-02-17 | 13F | Advisor Group Holdings, Inc. | 7.552 | -71,16 | 28 | -61,97 | ||||
| 2025-11-14 | 13F | Wolverine Trading, Llc | Call | 32.000 | 82,86 | 125 | 300,00 | |||
| 2026-02-13 | 13F | Morgan Stanley | 2.158 | -12,17 | 8 | -22,22 | ||||
| 2025-11-14 | 13F | Wolverine Trading, Llc | Put | 33.200 | 129 | |||||
| 2026-02-14 | 13F | Rockefeller Capital Management L.P. | 0 | -100,00 | 0 | |||||
| 2026-02-17 | 13F | Quadrature Capital Ltd | 49.096 | 180 | ||||||
| 2026-02-13 | 13F | OMERS ADMINISTRATION Corp | 0 | -100,00 | 0 | -100,00 | ||||
| 2026-02-13 | 13F | Integrated Wealth Concepts LLC | 51.000 | -25,00 | 187 | -25,90 | ||||
| 2026-02-17 | 13F | Citadel Advisors Llc | Put | 60.900 | 223 | |||||
| 2025-11-05 | 13F | Titleist Asset Management, Llc | 0 | -100,00 | 0 | |||||
| 2026-02-17 | 13F | Citadel Advisors Llc | Call | 53.100 | -67,92 | 194 | -68,25 | |||
| 2026-02-17 | 13F | Man Group plc | 52.653 | 193 | ||||||
| 2026-02-11 | 13F | Group One Trading, L.p. | 63.692 | 314,07 | 233 | 316,07 | ||||
| 2026-02-11 | 13F | Simplex Trading, Llc | 0 | -100,00 | 0 | |||||
| 2026-02-17 | 13F | Tower Research Capital LLC (TRC) | 0 | -100,00 | 0 | |||||
| 2026-01-20 | 13F | Toth Financial Advisory Corp | 0 | -100,00 | 0 | |||||
| 2026-01-23 | 13F | Rsm Us Wealth Management Llc | 36.250 | 0,00 | 130 | -3,01 | ||||
| 2026-02-13 | 13F | Sculptor Capital LP | 208.900 | 0,00 | 765 | -0,91 | ||||
| 2026-02-17 | 13F | Susquehanna International Group, Llp | 229.777 | -35,49 | 841 | -36,17 | ||||
| 2026-02-17 | 13F | Susquehanna International Group, Llp | Put | 222.800 | 199,87 | 815 | 197,45 | |||
| 2026-02-12 | 13F | SWAN Capital LLC | 0 | -100,00 | 0 | |||||
| 2026-01-27 | 13F | Forum Financial Management, LP | 10.000 | 37 | ||||||
| 2026-02-13 | 13F | State Street Corp | 77.266 | 11,55 | 283 | 10,59 | ||||
| 2026-01-28 | 13F | HB Wealth Management, LLC | 120.175 | 0,00 | 440 | -1,13 | ||||
| 2026-02-03 | 13F | SBI Securities Co., Ltd. | 0 | -100,00 | 0 | |||||
| 2026-02-17 | 13F | Two Sigma Investments, Lp | 139.151 | 63,74 | 509 | 62,10 | ||||
| 2026-02-10 | 13F | Bnp Paribas Arbitrage, Sa | 2 | 0,00 | 0 | |||||
| 2025-10-22 | 13F | Commonwealth Equity Services, Llc | 0 | -100,00 | 0 | |||||
| 2026-02-12 | 13F | Jane Street Group, Llc | Put | 17.200 | 63 | |||||
| 2026-02-12 | 13F | Jane Street Group, Llc | 91.919 | 25,75 | 336 | 24,44 | ||||
| 2026-02-17 | 13F | Susquehanna International Group, Llp | Call | 0 | -100,00 | 0 | -100,00 | |||
| 2025-11-14 | 13F | Virtu Financial LLC | 0 | -100,00 | 0 | |||||
| 2025-10-08 | 13F | Sheets Smith Investment Management | 73.142 | 270 | ||||||
| 2026-02-13 | 13F | National Bank Of Canada /fi/ | 2.400 | -90,59 | 9 | -91,49 | ||||
| 2025-12-18 | 13F | Danske Bank A/s | 0 | -100,00 | 0 | |||||
| 2026-02-12 | 13F | Summit Financial, LLC | 439.928 | -1,08 | 1.610 | -2,13 | ||||
| 2026-02-13 | 13F | Wells Fargo & Company/mn | 5.000 | 0,00 | 18 | 0,00 | ||||
| 2026-02-12 | 13F | Steward Partners Investment Advisory, Llc | 2.400 | -64,71 | 9 | -68,00 | ||||
| 2025-11-06 | 13F | Financial Advocates Investment Management | 0 | -100,00 | 0 | -100,00 | ||||
| 2025-11-14 | 13F | Raymond James Financial Inc | 0 | -100,00 | 0 | |||||
| 2026-02-17 | 13F | Scientech Research LLC | 0 | -100,00 | 0 | |||||
| 2026-01-27 | 13F | Tme Financial, Inc. | 0 | -100,00 | 0 | |||||
| 2026-02-17 | 13F | Two Sigma Advisers, Lp | 25.250 | 92 | ||||||
| 2026-01-26 | 13F | PFG Investments, LLC | 34.701 | 22,10 | 127 | 20,95 | ||||
| 2026-02-09 | 13F | MTM Investment Management, LLC | 4.249 | 16 | ||||||
| 2026-02-12 | 13F | Renaissance Technologies Llc | 81.100 | 98,77 | 297 | 97,33 | ||||
| 2026-02-06 | 13F | Gsa Capital Partners Llp | 36.074 | 0 | ||||||
| 2025-11-14 | 13F | Nantahala Capital Management, LLC | 0 | -100,00 | 0 | |||||
| 2026-02-10 | 13F/A | Northwestern Mutual Wealth Management Co | 33 | 0,00 | 0 | |||||
| 2026-02-19 | 13F | CI Private Wealth, LLC | 96.800 | 1,40 | 354 | 0,57 | ||||
| 2025-11-14 | 13F | Citadel Advisors Llc | 0 | -100,00 | 0 | -100,00 | ||||
| 2026-01-22 | 13F | Shikiar Asset Management Inc | 278.469 | 0,00 | 1 | 0,00 | ||||
| 2026-02-13 | 13F | Visionary Wealth Advisors | 11.235 | 41 | ||||||
| 2025-11-14 | 13F | Goldman Sachs Group Inc | 0 | -100,00 | 0 | |||||
| 2026-02-12 | 13F | Hrt Financial Lp | 0 | -100,00 | 0 | |||||
| 2026-01-29 | 13F | UBS Group AG | 23.108 | -23,71 | 85 | -24,32 | ||||
| 2026-01-08 | 13F | Wealth Enhancement Advisory Services, Llc | 51.017 | 65,90 | 215 | 130,11 | ||||
| 2025-11-14 | 13F | Cetera Investment Advisers | 0 | -100,00 | 0 | |||||
| 2026-02-13 | 13F | Prudential Financial Inc | 13.033 | -1,01 | 48 | -2,08 | ||||
| 2026-02-02 | 13F | Wolverine Asset Management Llc | Call | 600 | 0,00 | 2 | 0,00 | |||
| 2026-02-13 | 13F | Kestra Advisory Services, LLC | 0 | -100,00 | 0 | |||||
| 2026-02-06 | 13F | Larson Financial Group LLC | 16 | 0 | ||||||
| 2026-02-13 | 13F | Macquarie Group Ltd | 0 | -100,00 | 0 | |||||
| 2026-02-10 | 13F | Acadian Asset Management Llc | 0 | -100,00 | 0 | |||||
| 2026-02-17 | 13F | Two Sigma Securities, Llc | 0 | -100,00 | 0 | |||||
| 2026-02-17 | 13F | Opaleye Management Inc. | 1.090.000 | 3.989 | ||||||
| 2026-02-13 | 13F | Sculptor Capital LP | Put | 211.400 | 1,20 | 774 | 0,26 | |||
| 2025-11-12 | 13F | R Squared Ltd | 0 | -100,00 | 0 | |||||
| 2026-02-13 | 13F | Citigroup Inc | 0 | -100,00 | 0 | |||||
| 2026-01-16 | 13F | Abacus Planning Group, Inc. | 14.534 | 0,00 | 53 | 0,00 | ||||
| 2026-02-17 | 13F | Bank Of America Corp /de/ | 459 | -93,56 | 2 | -96,15 | ||||
| 2026-02-17 | 13F | Bridgeway Capital Management Inc | 182.368 | -45,15 | 667 | -23,68 | ||||
| 2026-01-09 | 13F | 180 Wealth Advisors, Llc | 75.850 | -8,06 | 278 | -8,88 | ||||
| 2026-02-17 | 13F | Northern Trust Corp | 239.533 | 8,56 | 877 | 7,48 | ||||
| 2025-11-06 | 13F | Atria Investments Llc | 0 | -100,00 | 0 | |||||
| 2025-11-14 | 13F | Creative Planning | 0 | -100,00 | 0 | |||||
| 2026-02-17 | 13F | Fmr Llc | 0 | -100,00 | 0 | |||||
| 2026-02-17 | 13F | XTX Topco Ltd | 14.433 | 53 | ||||||
| 2026-02-10 | 13F | Envestnet Asset Management Inc | 23.508 | 5,48 | 86 | 4,88 | ||||
| 2026-01-30 | 13F | Pvg Asset Management Corp | 38.788 | -46,97 | 142 | -47,78 | ||||
| 2025-11-14 | 13F | Cubist Systematic Strategies, LLC | 20.933 | 77 | ||||||
| 2026-02-13 | 13F | SRS Capital Advisors, Inc. | 4.086 | 95,88 | 15 | 100,00 | ||||
| 2026-02-13 | 13F | Motiv8 Investments LLC | 33 | 0 | ||||||
| 2026-02-13 | 13F | Panagora Asset Management Inc | 56.668 | 56,92 | 207 | 55,64 | ||||
| 2026-01-29 | 13F | Vanguard Group Inc | 1.100.570 | 15,81 | 4.028 | 14,73 |