Grundlæggende statistik
| Institutionelle ejere | 99 total, 99 long only, 0 short only, 0 long/short - change of 41,43% MRQ |
| Gennemsnitlig porteføljeallokering | 0.0621 % - change of 256,67% MRQ |
| Institutionelle aktier (lange) | 7.907.067 (ex 13D/G) - change of 3,00MM shares 61,05% MRQ |
| Institutionel værdi (lang) | $ 232.161 USD ($1000) |
Institutionelt ejerskab og aktionærer
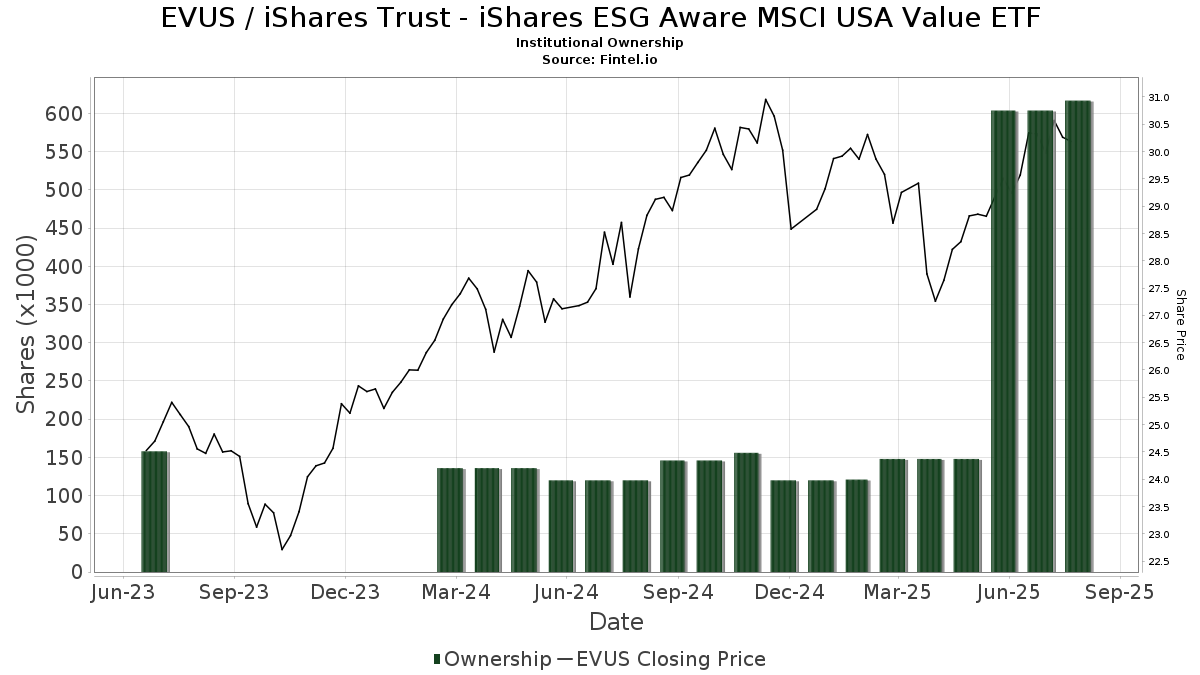
iShares Trust - iShares ESG Aware MSCI USA Value ETF (US:EVUS) har 99 institutionelle ejere og aktionærer, der har indsendt 13D/G- eller 13F-formularer til Securities Exchange Commission (SEC). Disse institutioner har i alt 7,907,067 aktier. Største aktionærer omfatter Envestnet Asset Management Inc, LPL Financial LLC, Envestnet Portfolio Solutions, Inc., Jpmorgan Chase & Co, Park Avenue Securities Llc, Lido Advisors, LLC, Cetera Investment Advisers, Mml Investors Services, Llc, Cwm, Llc, and Commonwealth Equity Services, Llc .
iShares Trust - iShares ESG Aware MSCI USA Value ETF (BATS:EVUS) institutionel ejerskabsstruktur viser aktuelle positioner i virksomheden efter institutioner og fonde, samt seneste ændringer i positionsstørrelse. Større aktionærer kan omfatte individuelle investorer, investeringsforeninger, hedgefonde eller institutioner. Skema 13D angiver, at investoren besidder (eller besidder) mere end 5 % af virksomheden og har til hensigt (eller har til hensigt at) aktivt at forfølge en ændring i forretningsstrategi. Skema 13G indikerer en passiv investering på over 5%.
The share price as of April 7, 2026 is 32,24 / share. Previously, on April 8, 2025, the share price was 25,95 / share. This represents an increase of 24,24% over that period.
Fondens stemningsscore
Fund Sentiment Score (fka Ownership Accumulation Score) finder de aktier, der bliver mest købt af fonde. Det er resultatet af en sofistikeret, multi-faktor kvantitativ model, der identificerer virksomheder med de højeste niveauer af institutionel akkumulering. Scoringsmodellen bruger en kombination af den samlede stigning i oplyste ejere, ændringerne i porteføljeallokeringer i disse ejere og andre målinger. Tallet går fra 0 til 100, hvor højere tal indikerer et højere niveau af akkumulering for sine jævnaldrende, og 50 er gennemsnittet.
Opdateringsfrekvens: Dagligt
Se Ownership Explorer, som giver en liste over højest rangerende virksomheder.
AI+ Ask Fintel’s AI assistant about iShares Trust - iShares ESG Aware MSCI USA Value ETF.
Select a question to share a public post with an AI-crafted answer.
Thinking of good questions…
Institutionel Put/Call-forhold
Ud over at indberette standardaktie- og gældsudstedelser skal institutter med mere end 100 mill. aktiver under forvaltning også oplyse deres put- og call-optionsbeholdninger. Da salgsoptioner generelt indikerer negativ stemning, og købsoptioner indikerer positiv stemning, kan vi få en fornemmelse af den overordnede institutionelle stemning ved at plotte forholdet mellem put og kald. Diagrammet til højre viser det historiske put/call-forhold for dette instrument.
Brug af Put/Call Ratio som en indikator for investorernes stemning overvinder en af de vigtigste mangler ved at bruge totalt institutionelt ejerskab, som er, at en betydelig mængde af aktiver under forvaltning investeres passivt for at spore indekser. Passivt forvaltede fonde køber typisk ikke optioner, så indikatoren for put/call-forholdet følger mere nøje følelsen af aktivt forvaltede fonde.
13F og NPORT arkivering
Detaljer om 13F-arkivering er gratis. Detaljer om NP-ansøgninger kræver et premium-medlemskab. Grønne rækker angiver nye positioner. Røde rækker angiver lukkede positioner. Klik på linket ikon for at se den fulde transaktionshistorik.
Opgrader
for at låse premium-data op og eksportere til Excel ![]() .
.
| Fil dato | Kilde | Investor | Type | Gennemsnitlig pris (Øst) |
Aktier | Δ Aktier (%) |
Rapporteret Værdi ($1000) |
Δ Værdi (%) |
Port Alloc (%) |
|
|---|---|---|---|---|---|---|---|---|---|---|
| 2026-02-10 | 13F | Eq Llc | 7.995 | 256 | ||||||
| 2026-02-17 | 13F | SageView Advisory Group, LLC | 67.259 | 2,80 | 2.155 | 4,72 | ||||
| 2026-01-07 | 13F | Sagespring Wealth Partners, Llc | 17.722 | 60,38 | 568 | 63,40 | ||||
| 2026-02-12 | 13F | Gerber Kawasaki Wealth & Investment Management | 14.121 | 452 | ||||||
| 2026-02-10 | 13F | Bank of New York Mellon Corp | 41.951 | 98,46 | 1.344 | 102,41 | ||||
| 2026-02-12 | 13F | BlackRock, Inc. | 1.527 | 74,12 | 49 | 77,78 | ||||
| 2026-02-03 | 13F | Cassaday & Co Wealth Management LLC | 14.725 | 2,08 | 472 | 3,97 | ||||
| 2026-02-12 | 13F | Brinker Capital Investments, LLC | 36.198 | 68,32 | 1.160 | 71,45 | ||||
| 2026-02-17 | 13F | Snowden Capital Advisors LLC | 9.574 | 0,77 | 307 | 2,68 | ||||
| 2026-02-05 | 13F | Bessemer Group Inc | 784 | 0 | ||||||
| 2025-11-14 | 13F | Strategic Wealth Partners, Ltd. | 33 | 1 | ||||||
| 2026-02-06 | 13F | Envestnet Portfolio Solutions, Inc. | 666.388 | 64,53 | 21.351 | 67,63 | ||||
| 2026-01-13 | 13F | Sharkey, Howes & Javer | 42.947 | 78,07 | 1.376 | 81,53 | ||||
| 2026-02-13 | 13F | Resources Investment Advisors, LLC. | 43.013 | 131,90 | 1.378 | 136,36 | ||||
| 2026-02-17 | 13F | Fmr Llc | 617 | 20 | ||||||
| 2026-02-13 | 13F | Kestra Advisory Services, LLC | 978 | 31 | ||||||
| 2026-02-13 | 13F | Kilter Group LLC | 300 | 57,07 | 10 | 50,00 | ||||
| 2026-02-11 | 13F | Capital Analysts, Inc. | 6.800 | 69,96 | 0 | |||||
| 2026-02-12 | 13F | Investor's Fiduciary Advisor Network, LLC | 22.087 | 73,48 | 1 | |||||
| 2026-02-13 | 13F | Wells Fargo & Company/mn | 153 | 5 | ||||||
| 2026-02-17 | 13F | Wiley Bros.-aintree Capital, Llc | 13.499 | 38,85 | 432 | 41,64 | ||||
| 2026-02-17 | 13F | Susquehanna International Group, Llp | 18.171 | -32,93 | 582 | -31,69 | ||||
| 2026-02-17 | 13F | Cetera Investment Advisers | 216.258 | 66,56 | 6.929 | 69,68 | ||||
| 2026-02-13 | 13F | Gen-Wealth Partners Inc | 4.997 | 40,76 | 160 | 44,14 | ||||
| 2026-01-20 | 13F | Austin Private Wealth, LLC | 19.394 | 59,44 | 621 | 62,57 | ||||
| 2026-02-12 | 13F | Commonwealth Equity Services, Llc | 107.711 | 334,02 | 3.451 | |||||
| 2026-01-12 | 13F | Archer Investment Management, LLC | 8.227 | 264 | ||||||
| 2026-01-13 | 13F | Mather Group, Llc. | 0 | -100,00 | 0 | |||||
| 2026-01-23 | 13F | Assetmark, Inc | 83.970 | 59,78 | 2.690 | 62,83 | ||||
| 2026-01-29 | 13F | Comerica Bank | 2.604 | 57,25 | 83 | 59,62 | ||||
| 2026-01-15 | 13F | RCS Financial Planning, LLC | 10.058 | 322 | ||||||
| 2026-02-13 | 13F | Mml Investors Services, Llc | 168.348 | 83,00 | 5.394 | 86,42 | ||||
| 2026-02-06 | 13F | Larson Financial Group LLC | 3.066 | 213,50 | 98 | 226,67 | ||||
| 2026-02-10 | 13F | Lido Advisors, LLC | 232.858 | 3,60 | 7.331 | 3,72 | ||||
| 2026-02-11 | 13F | Janney Montgomery Scott LLC | 100.268 | 79,07 | 3 | 200,00 | ||||
| 2026-02-10 | 13F | Theory Financial Llc | 9.648 | 320 | ||||||
| 2026-01-26 | 13F | Key Capital Management, INC | 47 | 2 | ||||||
| 2026-02-04 | 13F | Pensionmark Financial Group, Llc | 14.181 | 86,62 | 426 | 78,99 | ||||
| 2026-01-29 | 13F | Concurrent Investment Advisors, LLC | 7.150 | 229 | ||||||
| 2026-02-02 | 13F | Truist Financial Corp | 6.559 | 0,00 | 210 | 1,94 | ||||
| 2026-02-06 | 13F | Global Retirement Partners, LLC | 0 | -100,00 | 0 | |||||
| 2026-02-17 | 13F | GeoWealth Management, LLC | 58.198 | 100,74 | 1.865 | 104,61 | ||||
| 2026-02-11 | 13F | Wealthgarden F.s. Llc | 7.154 | 238 | ||||||
| 2026-02-10 | 13F | Godfrey Financial Associates, Inc. | 336 | 11 | ||||||
| 2026-02-17 | 13F | One Wealth Capital Management, Llc | 12.222 | 49,01 | 392 | 52,14 | ||||
| 2026-02-17 | 13F | Bank Of America Corp /de/ | 695 | 22 | ||||||
| 2026-02-02 | 13F | One Wealth Advisors, LLC | 52.004 | 58,80 | 1.666 | 61,90 | ||||
| 2026-04-07 | 13F | CoreCap Advisors, LLC | 1.189 | 167,79 | 38 | 171,43 | ||||
| 2026-02-17 | 13F | Tower Research Capital LLC (TRC) | 0 | -100,00 | 0 | |||||
| 2026-02-20 | 13F | Sunbelt Securities, Inc. | 104 | 96,23 | 3 | 200,00 | ||||
| 2026-02-17 | 13F | Royal Bank Of Canada | 13.701 | 439 | ||||||
| 2026-02-11 | 13F | Jpmorgan Chase & Co | 455.575 | 59,40 | 14.597 | 62,39 | ||||
| 2026-02-17 | 13F | Scarborough Advisors, LLC | 1.624 | 57,06 | 52 | 62,50 | ||||
| 2026-02-13 | 13F | Wealth Alliance | 11.588 | 29,85 | 371 | 32,50 | ||||
| 2026-01-16 | 13F | Oregon Pacific Wealth Management, LLC | 6.532 | 209 | ||||||
| 2026-01-23 | 13F | Kelsey Financial, LLC | 8.114 | 260 | ||||||
| 2026-02-13 | 13F | Aptus Capital Advisors, LLC | 705 | 63,95 | 23 | 69,23 | ||||
| 2025-11-14 | 13F | Goldman Sachs Group Inc | 0 | -100,00 | 0 | |||||
| 2026-02-11 | 13F | Buckingham Strategic Partners | 21.403 | -33,76 | 686 | -32,71 | ||||
| 2026-02-12 | 13F | Steward Partners Investment Advisory, Llc | 21.672 | 145,41 | 694 | 150,54 | ||||
| 2026-01-16 | 13F | Perigon Wealth Management, LLC | 50.725 | 108,78 | 1.625 | 112,70 | ||||
| 2026-01-23 | 13F | Charter Oak Capital Management, LLC | 7.794 | 9,30 | 250 | 11,16 | ||||
| 2026-02-11 | 13F | LPL Financial LLC | 797.952 | 83,25 | 25.566 | 86,69 | ||||
| 2026-01-12 | 13F | Lifelong Wealth Advisors, Inc. | 10.123 | 324 | ||||||
| 2026-01-29 | 13F | UMA Financial Services, Inc. | 328 | 11 | ||||||
| 2026-02-02 | 13F | Cornerstone Planning Group LLC | 101 | 3 | ||||||
| 2026-02-03 | 13F | RFG Advisory, LLC | 18.019 | 577 | ||||||
| 2026-02-17 | 13F | Regal Investment Advisors LLC | 17.602 | 55,48 | 564 | 58,15 | ||||
| 2026-02-05 | 13F | Cambridge Investment Research Advisors, Inc. | 41.103 | 69,95 | 1 | |||||
| 2026-02-06 | 13F | Pnc Financial Services Group, Inc. | 928 | 58,09 | 30 | 61,11 | ||||
| 2026-02-13 | 13F | OpenArc Corporate Advisory, LLC | 11.424 | 366 | ||||||
| 2026-02-03 | 13F | Diversify Wealth Management, Llc | 8.607 | 283 | ||||||
| 2026-01-21 | 13F | Flagship Harbor Advisors, Llc | 359 | 12 | ||||||
| 2026-02-17 | 13F | Raymond James Financial Inc | 9.273 | 297 | ||||||
| 2026-04-07 | 13F | Park Avenue Securities Llc | 295.814 | -10,64 | 9 | -10,00 | ||||
| 2026-02-10 | 13F | Envestnet Asset Management Inc | 3.334.235 | 63,34 | 106.829 | 66,41 | ||||
| 2026-02-11 | 13F | Commonwealth Retirement Investments LLC | 67 | 2 | ||||||
| 2026-02-12 | 13F | Keystone Financial Services | 8.033 | 257 | ||||||
| 2026-02-03 | 13F | We Are One Seven, LLC | 15.990 | -3,84 | 512 | -1,92 | ||||
| 2026-01-29 | 13F | UBS Group AG | 0 | -100,00 | 0 | |||||
| 2026-02-03 | 13F | Emerald Investment Partners, Llc | 373 | 64,32 | 12 | 57,14 | ||||
| 2026-01-26 | 13F | Merit Financial Group, LLC | 29.845 | 111,49 | 956 | 115,80 | ||||
| 2026-02-05 | 13F | Allworth Financial LP | 0 | -100,00 | 0 | |||||
| 2026-02-11 | 13F | Avise Financial Cooperative, Inc. | 60.943 | 1.953 | ||||||
| 2026-02-17 | 13F | Davis Wealth Advisors, LLC | 30.042 | 963 | ||||||
| 2026-02-05 | 13F | Atria Investments Llc | 10.997 | 352 | ||||||
| 2026-02-12 | 13F | Jane Street Group, Llc | 0 | -100,00 | 0 | |||||
| 2026-02-06 | 13F | Addison Advisors LLC | 1.855 | 44,36 | 59 | 47,50 | ||||
| 2026-02-09 | 13F | LifePlan Investment Advisors, Inc. | 6.527 | 209 | ||||||
| 2026-02-06 | 13F | EverSource Wealth Advisors, LLC | 10.183 | 73,18 | 326 | 77,17 | ||||
| 2026-02-17 | 13F | Advisory Services Network, LLC | 16.841 | 240,57 | 540 | 247,74 | ||||
| 2026-02-03 | 13F | International Assets Investment Management, Llc | 101 | 3 | ||||||
| 2026-01-20 | 13F | SOA Wealth Advisors, LLC. | 793 | 0,00 | 25 | 4,17 | ||||
| 2026-01-16 | 13F | SigFig Wealth Management, LLC | 31.057 | 40,88 | 995 | 43,99 | ||||
| 2026-02-13 | 13F | Gts Securities Llc | 38.781 | 1.243 | ||||||
| 2026-02-13 | 13F | Maia Wealth LLC | 6.023 | 201 | ||||||
| 2026-02-06 | 13F | HighTower Advisors, LLC | 23.237 | 161,00 | 745 | 166,67 | ||||
| 2026-01-26 | 13F | Cwm, Llc | 151.103 | 38,31 | 5 | 33,33 | ||||
| 2026-01-26 | 13F | AE Wealth Management LLC | 5.294 | 128,09 | 170 | 134,72 | ||||
| 2026-02-13 | 13F | Transamerica Financial Advisors, Inc. | 1.072 | 34 | ||||||
| 2026-02-05 | 13F | Thrivent Financial For Lutherans | 38.651 | -25,64 | 1 | 0,00 | ||||
| 2026-02-13 | 13F | Integrated Wealth Concepts LLC | 0 | -100,00 | 0 | |||||
| 2026-04-07 | 13F | Farther Finance Advisors, LLC | 14.867 | 42,28 | 476 | 42,51 | ||||
| 2026-01-27 | 13F | Horst & Graben Wealth Management LLC | 39.270 | 55,81 | 1.258 | 58,84 | ||||
| 2026-01-14 | 13F | Jfs Wealth Advisors, Llc | 2.820 | 68,06 | 90 | 73,08 | ||||
| 2026-02-17 | 13F | United Capital Financial Advisers, Llc | 51.291 | 70,77 | 1.643 | 74,05 | ||||
| 2026-02-17 | 13F | Advisor Group Holdings, Inc. | 11.622 | -19,96 | 372 | -18,24 |