Grundlæggende statistik
| Institutionelle ejere | 174 total, 174 long only, 0 short only, 0 long/short - change of 1,16% MRQ |
| Gennemsnitlig porteføljeallokering | 0.1723 % - change of -16,36% MRQ |
| Institutionelle aktier (lange) | 13.546.156 (ex 13D/G) - change of 0,78MM shares 6,12% MRQ |
| Institutionel værdi (lang) | $ 571.629 USD ($1000) |
Institutionelt ejerskab og aktionærer
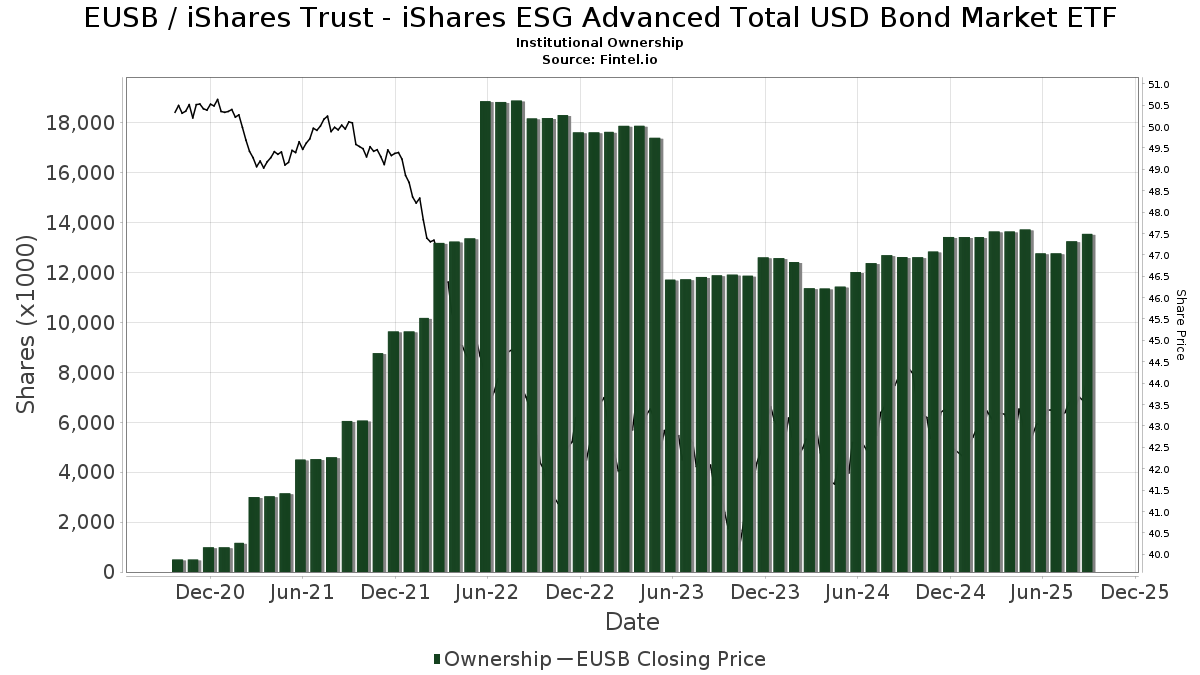
iShares Trust - iShares ESG Advanced Total USD Bond Market ETF (US:EUSB) har 174 institutionelle ejere og aktionærer, der har indsendt 13D/G- eller 13F-formularer til Securities Exchange Commission (SEC). Disse institutioner har i alt 13,546,156 aktier. Største aktionærer omfatter BlackRock, Inc., Envestnet Asset Management Inc, LPL Financial LLC, SigFig Wealth Management, LLC, IMPACTfolio, LLC, Jpmorgan Chase & Co, Envestnet Portfolio Solutions, Inc., Seeds Investor Llc, Us Bancorp \de\, and Jones Financial Companies Lllp .
iShares Trust - iShares ESG Advanced Total USD Bond Market ETF (ARCA:EUSB) institutionel ejerskabsstruktur viser aktuelle positioner i virksomheden efter institutioner og fonde, samt seneste ændringer i positionsstørrelse. Større aktionærer kan omfatte individuelle investorer, investeringsforeninger, hedgefonde eller institutioner. Skema 13D angiver, at investoren besidder (eller besidder) mere end 5 % af virksomheden og har til hensigt (eller har til hensigt at) aktivt at forfølge en ændring i forretningsstrategi. Skema 13G indikerer en passiv investering på over 5%.
The share price as of September 12, 2025 is 44,11 / share. Previously, on September 13, 2024, the share price was 44,52 / share. This represents a decline of 0,92% over that period.
Fondens stemningsscore
Fund Sentiment Score (fka Ownership Accumulation Score) finder de aktier, der bliver mest købt af fonde. Det er resultatet af en sofistikeret, multi-faktor kvantitativ model, der identificerer virksomheder med de højeste niveauer af institutionel akkumulering. Scoringsmodellen bruger en kombination af den samlede stigning i oplyste ejere, ændringerne i porteføljeallokeringer i disse ejere og andre målinger. Tallet går fra 0 til 100, hvor højere tal indikerer et højere niveau af akkumulering for sine jævnaldrende, og 50 er gennemsnittet.
Opdateringsfrekvens: Dagligt
Se Ownership Explorer, som giver en liste over højest rangerende virksomheder.
Institutionel Put/Call-forhold
Ud over at indberette standardaktie- og gældsudstedelser skal institutter med mere end 100 mill. aktiver under forvaltning også oplyse deres put- og call-optionsbeholdninger. Da salgsoptioner generelt indikerer negativ stemning, og købsoptioner indikerer positiv stemning, kan vi få en fornemmelse af den overordnede institutionelle stemning ved at plotte forholdet mellem put og kald. Diagrammet til højre viser det historiske put/call-forhold for dette instrument.
Brug af Put/Call Ratio som en indikator for investorernes stemning overvinder en af de vigtigste mangler ved at bruge totalt institutionelt ejerskab, som er, at en betydelig mængde af aktiver under forvaltning investeres passivt for at spore indekser. Passivt forvaltede fonde køber typisk ikke optioner, så indikatoren for put/call-forholdet følger mere nøje følelsen af aktivt forvaltede fonde.
13D/G-arkivering
Vi præsenterer 13D/G ansøgninger separat fra 13F ansøgninger på grund af den forskellige behandling af SEC. 13D/G-ansøgninger kan indgives af grupper af investorer (med én ledende), hvorimod 13F-ansøgninger ikke kan. Dette resulterer i situationer, hvor en investor kan indsende en 13D/G, der rapporterer én værdi for de samlede aktier (der repræsenterer alle de aktier, der ejes af investorgruppen), men derefter indsender en 13F, der rapporterer en anden værdi for de samlede aktier (der udelukkende repræsenterer deres egne) ejendomsret). Det betyder, at aktieejerskab af 13D/G-arkiver og 13F-arkiveringer ofte ikke er direkte sammenlignelige, så vi præsenterer dem separat.
Bemærk: Fra den 16. maj 2021 viser vi ikke længere ejere, der ikke har indsendt en 13D/G inden for det seneste år. Tidligere viste vi den fulde historie af 13D/G-arkiver. Generelt skal enheder, der er forpligtet til at indgive 13D/G-ansøgninger, indgive mindst årligt, før de indsender en afsluttende ansøgning. Dog forlader fonde nogle gange positioner uden at indsende en afsluttende ansøgning (dvs. de afvikler), så visning af den fulde historie resulterede nogle gange i forvirring om det nuværende ejerskab. For at undgå forvirring viser vi nu kun 'aktuelle' ejere - det vil sige - ejere, der har anmeldt inden for det seneste år.
Upgrade to unlock premium data.
| Fil dato | Form | Investor | Forrige Aktier |
Seneste Aktier |
Δ Aktier (Procent) |
Ejendomsret (Procent) |
Δ Ejerskab (Procent) |
|
|---|---|---|---|---|---|---|---|---|
| 2025-04-15 | BlackRock Portfolio Management LLC | 5,203,685 | 4,952,117 | -4.83 | 31.00 | -5.78 | ||
| 2025-02-07 | BlackRock, Inc. | 5,050,180 | 0 | -100.00 | 0.00 | -100.00 |
13F og NPORT arkivering
Detaljer om 13F-arkivering er gratis. Detaljer om NP-ansøgninger kræver et premium-medlemskab. Grønne rækker angiver nye positioner. Røde rækker angiver lukkede positioner. Klik på linket ikon for at se den fulde transaktionshistorik.
Opgrader
for at låse premium-data op og eksportere til Excel ![]() .
.
| Fil dato | Kilde | Investor | Type | Gennemsnitlig pris (Øst) |
Aktier | Δ Aktier (%) |
Rapporteret Værdi ($1000) |
Δ Værdi (%) |
Port Alloc (%) |
|
|---|---|---|---|---|---|---|---|---|---|---|
| 2025-08-14 | 13F | Wells Fargo & Company/mn | 35.599 | -16,87 | 1.550 | -16,44 | ||||
| 2025-08-06 | 13F | Golden State Wealth Management, LLC | 105 | 0,00 | 5 | 0,00 | ||||
| 2025-05-06 | 13F | Venturi Wealth Management, LLC | 0 | -100,00 | 0 | |||||
| 2025-08-07 | 13F | Guardian Capital Lp | 11.700 | 2,63 | 510 | 3,25 | ||||
| 2025-07-10 | 13F | Stewardship Advisors, LLC | 102.017 | -3,06 | 4.443 | -2,54 | ||||
| 2025-07-23 | 13F | Optas, LLC | 7.702 | -0,84 | 335 | -0,30 | ||||
| 2025-08-14 | 13F | Goldman Sachs Group Inc | 0 | -100,00 | 0 | |||||
| 2025-07-18 | 13F | SigFig Wealth Management, LLC | 566.243 | 4,22 | 24.581 | 4,56 | ||||
| 2025-08-11 | 13F | United Capital Financial Advisers, Llc | 42.080 | 10,77 | 1.833 | 11,37 | ||||
| 2025-08-19 | 13F | Advisory Services Network, LLC | 158.759 | 1,82 | 6.877 | 1,82 | ||||
| 2025-08-14 | 13F | Jane Street Group, Llc | 31.961 | -80,49 | 1.392 | -80,40 | ||||
| 2025-08-06 | 13F | Hoxton Planning & Management, LLC | 6.925 | 302 | ||||||
| 2025-07-15 | 13F | Bfsg, Llc | 25.365 | 24,55 | 1.105 | 25,17 | ||||
| 2025-08-13 | 13F | Transce3nd, LLC | 550 | 12,47 | 24 | 9,52 | ||||
| 2025-07-29 | 13F | Stratos Wealth Partners, LTD. | 39.958 | 6,11 | 1.740 | 6,68 | ||||
| 2025-08-13 | 13F | Haverford Trust Co | 34.728 | 1.512 | ||||||
| 2025-08-14 | 13F | IHT Wealth Management, LLC | 4.804 | 2,65 | 209 | 3,47 | ||||
| 2025-04-28 | 13F | Fedenia Advisers LLC | 0 | -100,00 | 0 | |||||
| 2025-08-14 | 13F | Synovus Financial Corp | 13.574 | 0,00 | 591 | 0,51 | ||||
| 2025-08-11 | 13F | Principal Securities, Inc. | 3.717 | 0,62 | 162 | 3,21 | ||||
| 2025-08-14 | 13F | GWM Advisors LLC | 35.098 | 12,59 | 1.529 | 13,19 | ||||
| 2025-07-16 | 13F | MBE Wealth Management, LLC | 4.922 | -0,08 | 214 | 0,47 | ||||
| 2025-08-07 | 13F | Allworth Financial LP | 225.155 | 2,51 | 9.805 | 3,60 | ||||
| 2025-08-05 | 13F | GPS Wealth Strategies Group, LLC | 2.788 | 0,32 | 121 | 0,83 | ||||
| 2025-08-14 | 13F | Susquehanna International Group, Llp | 8.301 | -80,44 | 362 | -80,36 | ||||
| 2025-07-21 | 13F | Ascent Group, LLC | 8.835 | 4,68 | 385 | 5,21 | ||||
| 2025-08-14 | 13F | Essential Planning, LLC. | 13.278 | 2,19 | 578 | 2,85 | ||||
| 2025-08-12 | 13F | Coldstream Capital Management Inc | 6.684 | 291 | ||||||
| 2025-08-12 | 13F | Archer Investment Corp | 320 | 0,00 | 14 | 0,00 | ||||
| 2025-08-11 | 13F | Tidemark, LLC | 0 | -100,00 | 0 | |||||
| 2025-08-13 | 13F | Townsquare Capital Llc | 0 | -100,00 | 0 | |||||
| 2025-08-14 | 13F | Citadel Advisors Llc | 0 | -100,00 | 0 | |||||
| 2025-08-29 | 13F | Evolution Wealth Management Inc. | 463 | 20 | ||||||
| 2025-08-13 | 13F | Rockport Wealth LLC | 13.536 | 0,00 | 589 | 0,51 | ||||
| 2025-08-12 | 13F | Global Retirement Partners, LLC | 676 | 191,38 | 29 | 222,22 | ||||
| 2025-07-23 | 13F | Valmark Advisers, Inc. | 8.671 | 378 | ||||||
| 2025-08-07 | 13F | Resources Investment Advisors, LLC. | 41.079 | 22,38 | 1.789 | 22,97 | ||||
| 2025-08-14 | 13F | Mariner, LLC | 6.309 | 275 | ||||||
| 2025-08-07 | 13F | Shared Vision Wealth Group LLC | 20.410 | -27,17 | 884 | -27,12 | ||||
| 2025-08-14 | 13F | Qube Research & Technologies Ltd | 68 | 0,00 | 3 | 0,00 | ||||
| 2025-08-01 | 13F | Rossby Financial, LCC | 1.235 | -18,16 | 54 | -18,46 | ||||
| 2025-08-08 | 13F | Wealth Alliance | 0 | -100,00 | 0 | |||||
| 2025-07-24 | 13F | Jfs Wealth Advisors, Llc | 1.901 | 25,40 | 83 | 26,15 | ||||
| 2025-07-17 | 13F | One Wealth Advisors, LLC | 104.719 | 9,67 | 4.561 | 10,25 | ||||
| 2025-08-12 | 13F | BlackRock, Inc. | 5.219.893 | 5,41 | 227.326 | 5,97 | ||||
| 2025-08-06 | 13F | AE Wealth Management LLC | 1.443 | 27,25 | 63 | 26,53 | ||||
| 2025-08-14 | 13F | LifePlan Investment Advisors, Inc. | 12.482 | 12,08 | 544 | 12,66 | ||||
| 2025-08-14 | 13F | EP Wealth Advisors, Inc. | 2.634 | 115 | ||||||
| 2025-08-26 | 13F/A | Thrivent Financial For Lutherans | 11.290 | -87,94 | 0 | -100,00 | ||||
| 2025-08-14 | 13F | Balanced Rock Investment Advisor | 67.206 | -68,17 | 2.927 | -68,01 | ||||
| 2025-07-22 | 13F | Valley National Advisers Inc | 11.432 | -0,06 | 0 | |||||
| 2025-08-11 | 13F | HighTower Advisors, LLC | 10.600 | -2,21 | 462 | -1,71 | ||||
| 2025-08-08 | 13F | W.H. Cornerstone Investments Inc. | 5.031 | -2,35 | 219 | -1,79 | ||||
| 2025-07-29 | 13F | Fundamentun, Llc | 7.301 | 15,16 | 318 | 15,69 | ||||
| 2025-08-12 | 13F | Seeds Investor Llc | 330.494 | -10,66 | 14.393 | -10,18 | ||||
| 2025-08-13 | 13F | Capital Analysts, Inc. | 2.680 | 31,63 | 0 | |||||
| 2025-04-23 | 13F | Williams Financial, LLC | 0 | -100,00 | 0 | |||||
| 2025-07-09 | 13F | Dynamic Advisor Solutions LLC | 9.727 | 0,00 | 424 | 0,48 | ||||
| 2025-08-12 | 13F | Ameritas Investment Partners, Inc. | 1.834 | -3,22 | 80 | -3,66 | ||||
| 2025-08-13 | 13F | Kilter Group LLC | 128 | 6 | ||||||
| 2025-08-14 | 13F | Comerica Bank | 1.984 | 26,94 | 86 | 28,36 | ||||
| 2025-08-11 | 13F | Theory Financial Llc | 15.671 | 8,26 | 679 | 8,13 | ||||
| 2025-07-10 | 13F | IMPACTfolio, LLC | 478.924 | 3,63 | 20.857 | 4,19 | ||||
| 2025-07-17 | 13F | KWB Wealth | 9.464 | -9,31 | 410 | -7,67 | ||||
| 2025-07-25 | 13F | Cwm, Llc | 2.855 | 0,00 | 0 | |||||
| 2025-08-13 | 13F | Continuum Advisory, LLC | 0 | -100,00 | 0 | |||||
| 2025-05-15 | 13F/A | Orion Portfolio Solutions, LLC | 5.105 | 221 | ||||||
| 2025-08-12 | 13F | Change Path, LLC | 4.813 | 210 | ||||||
| 2025-08-11 | 13F | Perennial Investment Advisors, LLC | 38.233 | 0,06 | 1.665 | 0,60 | ||||
| 2025-08-12 | 13F | Steward Partners Investment Advisory, Llc | 15.978 | 2,75 | 696 | 3,27 | ||||
| 2025-07-10 | 13F | Oliver Lagore Vanvalin Investment Group | 341 | -5,01 | 15 | -6,67 | ||||
| 2025-07-21 | 13F | Ameriflex Group, Inc. | 151 | -5,03 | 7 | 0,00 | ||||
| 2025-08-08 | 13F | Pnc Financial Services Group, Inc. | 672 | 12,00 | 29 | 11,54 | ||||
| 2025-08-13 | 13F | Milestone Investment Advisors LLC | 9.463 | -0,13 | 412 | 0,49 | ||||
| 2025-05-08 | 13F | Endeavor Private Wealth, Inc. | 0 | -100,00 | 0 | |||||
| 2025-08-14 | 13F | Smartleaf Asset Management LLC | 0 | -100,00 | 0 | |||||
| 2025-07-29 | 13F | Horst & Graben Wealth Management LLC | 45.690 | 8,98 | 1.990 | 9,53 | ||||
| 2025-07-25 | 13F | Apollon Wealth Management, LLC | 9.521 | 1,31 | 415 | 1,72 | ||||
| 2025-08-14 | 13F | Raymond James Financial Inc | 39.606 | 6,39 | 1.725 | 6,95 | ||||
| 2025-07-11 | 13F | Farther Finance Advisors, LLC | 10.639 | -11,12 | 463 | -10,62 | ||||
| 2025-08-08 | 13F | WASHINGTON TRUST Co | 0 | -100,00 | 0 | |||||
| 2025-08-14 | 13F | Mml Investors Services, Llc | 88.685 | 25,23 | 4 | 0,00 | ||||
| 2025-07-28 | 13F | RFG Advisory, LLC | 9.755 | 41,64 | 425 | 42,28 | ||||
| 2025-07-09 | 13F | Sandbox Financial Partners, LLC | 22.401 | 10,48 | 976 | 11,05 | ||||
| 2025-08-12 | 13F | Financial Advocates Investment Management | 0 | -100,00 | 0 | |||||
| 2025-08-12 | 13F | WealthTrak Capital Management LLC | 261 | 27,32 | 11 | 37,50 | ||||
| 2025-07-14 | 13F | Leonard Rickey Investment Advisors P.L.L.C. | 44.737 | -7,67 | 1.948 | -5,85 | ||||
| 2025-08-06 | 13F | Decker Retirement Planning Inc. | 68.912 | 47.425,52 | 3.001 | 49.916,67 | ||||
| 2025-07-23 | 13F | Sax Wealth Advisors, Llc | 0 | -100,00 | 0 | |||||
| 2025-08-13 | 13F | EverSource Wealth Advisors, LLC | 7.363 | 25,09 | 321 | 25,98 | ||||
| 2025-07-25 | 13F | Atria Wealth Solutions, Inc. | 0 | -100,00 | 0 | |||||
| 2025-04-17 | 13F | Sagespring Wealth Partners, Llc | 0 | -100,00 | 0 | |||||
| 2025-07-16 | 13F | Traveka Wealth, LLC | 4.818 | -0,80 | 210 | -0,48 | ||||
| 2025-07-24 | 13F | Us Bancorp \de\ | 257.558 | 1,32 | 11.217 | 1,86 | ||||
| 2025-08-13 | 13F | Congress Wealth Management LLC / DE / | 16.244 | 17,96 | 707 | 18,62 | ||||
| 2025-07-15 | 13F | Brewster Financial Planning LLC | 6.857 | 43,99 | 299 | 44,66 | ||||
| 2025-07-17 | 13F | Janney Montgomery Scott LLC | 34.312 | 115,62 | 1 | |||||
| 2025-08-14 | 13F | Clarity Asset Management, Inc. | 1.159 | 50 | ||||||
| 2025-07-22 | 13F | Merit Financial Group, LLC | 8.828 | 46,91 | 384 | 47,69 | ||||
| 2025-08-12 | 13F | Franklin Resources Inc | 521 | 30,25 | 23 | 29,41 | ||||
| 2025-08-08 | 13F | Cetera Investment Advisers | 147.271 | 31,59 | 6.414 | 32,28 | ||||
| 2025-08-15 | 13F | Fsb Premier Wealth Management, Inc. | 6.248 | 272 | ||||||
| 2025-07-15 | 13F | Spectrum Planning & Advisory Services Inc. | 4.897 | -2,99 | 213 | -2,29 | ||||
| 2025-08-12 | 13F | LPL Financial LLC | 617.316 | 29,60 | 26.884 | 30,30 | ||||
| 2025-07-10 | 13F | Sharkey, Howes & Javer | 36.664 | 33,57 | 1.597 | 34,23 | ||||
| 2025-07-31 | 13F | Cambridge Investment Research Advisors, Inc. | 43.763 | 32,39 | 2 | 0,00 | ||||
| 2025-08-11 | 13F | Retirement Capital Strategies | 60.612 | 19,73 | 2.640 | 20,34 | ||||
| 2025-07-14 | 13F | Signature Securities Group Corporation | 5.531 | 0,97 | 241 | 1,27 | ||||
| 2025-07-02 | 13F | Central Pacific Bank - Trust Division | 16.397 | 93,98 | 714 | 95,08 | ||||
| 2025-08-06 | 13F | SOUTH STATE Corp | 0 | -100,00 | 0 | |||||
| 2025-08-14 | 13F | Old Mission Capital Llc | 13.259 | 577 | ||||||
| 2025-08-06 | 13F | Savant Capital, LLC | 19.537 | 9,04 | 851 | 9,54 | ||||
| 2025-05-16 | 13F/A | Kestra Investment Management, LLC | 0 | -100,00 | 0 | |||||
| 2025-07-28 | 13F | Harbour Investments, Inc. | 9.523 | 2,01 | 415 | 2,48 | ||||
| 2025-08-11 | 13F | Aptus Capital Advisors, LLC | 587 | 19,55 | 26 | 19,05 | ||||
| 2025-07-10 | 13F | Charter Oak Capital Management, LLC | 15.292 | 103,27 | 666 | 104,62 | ||||
| 2025-08-08 | 13F | Larson Financial Group LLC | 104 | 0,00 | 5 | 0,00 | ||||
| 2025-08-11 | 13F | Cornerstone Planning Group LLC | 0 | -100,00 | 0 | |||||
| 2025-08-13 | 13F | Twin Peaks Wealth Advisors, LLC | 1.111 | 48 | ||||||
| 2025-07-16 | 13F | Perigon Wealth Management, LLC | 88.496 | -0,94 | 3.854 | -0,41 | ||||
| 2025-08-13 | 13F | Van Hulzen Asset Management, LLC | 24.762 | 0,00 | 1.078 | 0,56 | ||||
| 2025-07-15 | 13F | Mather Group, Llc. | 0 | -100,00 | 0 | |||||
| 2025-08-14 | 13F | Diversify Advisory Services, LLC | 0 | -100,00 | 0 | |||||
| 2025-08-01 | 13F | Fort Vancouver Investment Management, LLC | 256 | 0,00 | 11 | 0,00 | ||||
| 2025-08-13 | 13F | Flow Traders U.s. Llc | 22.483 | 1 | ||||||
| 2025-04-01 | 13F | Massmutual Trust Co Fsb/adv | 0 | -100,00 | 0 | |||||
| 2025-08-08 | 13F | Keyvantage Wealth, Llc | 5.406 | -1,87 | 235 | -1,26 | ||||
| 2025-07-21 | 13F | Ameritas Advisory Services, LLC | 180 | 8 | ||||||
| 2025-07-10 | 13F | Global Financial Private Client, LLC | 0 | -100,00 | 0 | |||||
| 2025-08-13 | 13F | Elios Financial Group Inc. | 8.089 | 16,56 | 352 | 17,33 | ||||
| 2025-08-15 | 13F | Morgan Stanley | 141.702 | -3,10 | 6.171 | -2,57 | ||||
| 2025-07-23 | 13F | Dohj, Llc | 20.508 | 0,49 | 878 | -0,68 | ||||
| 2025-08-06 | 13F | Walkner Condon Financial Advisors LLC | 10.083 | -6,30 | 439 | -5,79 | ||||
| 2025-05-02 | 13F | Cable Hill Partners, LLC | 6.872 | 0,00 | 298 | 2,41 | ||||
| 2025-07-25 | 13F | Keener Financial Planning LLC | 4.399 | 0,00 | 0 | |||||
| 2025-07-24 | 13F | Financial Connections Group, Inc. | 7.361 | 12,02 | 0 | |||||
| 2025-07-29 | 13F | Goldstein Advisors, LLC | 12.386 | -1,24 | 539 | -0,74 | ||||
| 2025-08-01 | 13F | Envestnet Asset Management Inc | 1.596.618 | 24,28 | 69.533 | 24,94 | ||||
| 2025-08-08 | 13F | Fiera Capital Corp | 0 | -100,00 | 0 | |||||
| 2025-07-18 | 13F | Bartlett & Co. Wealth Management Llc | 6.762 | 0,00 | 294 | 0,68 | ||||
| 2025-08-12 | 13F | Proequities, Inc. | 0 | 0 | ||||||
| 2025-07-25 | 13F | We Are One Seven, LLC | 8.469 | 30,92 | 369 | 31,43 | ||||
| 2025-07-23 | 13F | Nbt Bank N A /ny | 47 | 0,00 | 2 | 0,00 | ||||
| 2025-08-13 | 13F | Mount Yale Investment Advisors, LLC | 468 | 20 | ||||||
| 2025-08-14 | 13F | Fmr Llc | 20 | 1 | ||||||
| 2025-07-14 | 13F | Park Avenue Securities Llc | 98.692 | 39,01 | 4 | 33,33 | ||||
| 2025-07-15 | 13F | Carr Financial Group Corp | 0 | -100,00 | 0 | |||||
| 2025-07-17 | 13F | Johnson Bixby & Associates, LLC | 30.050 | -2,17 | 1.309 | -1,65 | ||||
| 2025-08-13 | 13F | Baker Avenue Asset Management, LP | 40.879 | -5,97 | 1.780 | -5,47 | ||||
| 2025-08-15 | 13F | Kestra Advisory Services, LLC | 5.832 | 12,76 | 254 | 12,95 | ||||
| 2025-08-27 | 13F/A | Brinker Capital Investments, LLC | 7.787 | 52,54 | 339 | 53,39 | ||||
| 2025-08-13 | 13F | Hsbc Holdings Plc | 36.100 | 1.572 | ||||||
| 2025-07-31 | 13F | Longview Financial Advisors, Inc. | 0 | -100,00 | 0 | |||||
| 2025-08-08 | 13F | Avantax Advisory Services, Inc. | 9.598 | 20,62 | 418 | 21,22 | ||||
| 2025-08-12 | 13F | Investor's Fiduciary Advisor Network, LLC | 9.610 | -3,99 | 0 | |||||
| 2025-05-06 | 13F | Tempus Wealth Planning, LLC | 0 | -100,00 | 0 | |||||
| 2025-08-04 | 13F | Pensionmark Financial Group, Llc | 7.550 | 25,52 | 329 | 26,15 | ||||
| 2025-08-11 | 13F | Sofi Wealth, Llc | 38.621 | 61,78 | 1.682 | 62,57 | ||||
| 2025-08-14 | 13F | Royal Bank Of Canada | 46.548 | 9,52 | 2.027 | 10,10 | ||||
| 2025-08-14 | 13F | CoreCap Advisors, LLC | 66 | 0,00 | 3 | 0,00 | ||||
| 2025-08-08 | 13F | Taylor, Cottrill, Erickson & Associates, Inc. | 5.150 | 224 | ||||||
| 2025-04-30 | 13F | Stratos Wealth Advisors, LLC | 0 | -100,00 | 0 | |||||
| 2025-07-24 | 13F | IFP Advisors, Inc | 151 | 5,59 | 7 | 0,00 | ||||
| 2025-07-18 | 13F | Institute for Wealth Management, LLC. | 46.163 | 2.010 | ||||||
| 2025-08-13 | 13F | Jones Financial Companies Lllp | 257.195 | 16,07 | 11.165 | 16,45 | ||||
| 2025-08-13 | 13F | Ally Invest Advisors Inc. | 15.702 | 20,81 | 684 | 21,31 | ||||
| 2025-09-04 | 13F/A | Advisor Group Holdings, Inc. | 65.827 | 17,35 | 2.866 | 17,94 | ||||
| 2025-08-04 | 13F | Creative Financial Designs Inc /adv | 1.973 | -18,84 | 86 | -19,05 | ||||
| 2025-08-04 | 13F | Assetmark, Inc | 26.277 | 21,23 | 1.144 | 21,96 | ||||
| 2025-08-14 | 13F | UBS Group AG | 21.107 | -3,42 | 919 | -2,85 | ||||
| 2025-07-21 | 13F | Barrett & Company, Inc. | 70 | 0,00 | 3 | 0,00 | ||||
| 2025-08-05 | 13F | Bank of New York Mellon Corp | 8.928 | 27,45 | 389 | 28,05 | ||||
| 2025-08-14 | 13F | Bank Of America Corp /de/ | 35.427 | 17,51 | 1.543 | 18,07 | ||||
| 2025-08-01 | 13F | Austin Private Wealth, LLC | 7.403 | 33,94 | 322 | 34,73 | ||||
| 2025-08-06 | 13F | Commonwealth Equity Services, Llc | 26.362 | 3,77 | 1 | 0,00 | ||||
| 2025-07-23 | 13F | 1 North Wealth Services Llc | 310 | 0,00 | 14 | 0,00 | ||||
| 2025-08-05 | 13F | Key FInancial Inc | 2.650 | 0,00 | 115 | 0,88 | ||||
| 2025-08-06 | 13F | First Horizon Advisors, Inc. | 4.105 | 193,21 | 179 | 196,67 | ||||
| 2025-08-14 | 13F | Betterment LLC | 35.270 | -0,90 | 2 | 0,00 | ||||
| 2025-04-08 | 13F | Parallel Advisors, LLC | 0 | -100,00 | 0 | |||||
| 2025-08-14 | 13F | Gen-Wealth Partners Inc | 535 | 0,00 | 23 | 0,00 | ||||
| 2025-07-17 | 13F | Hanson & Doremus Investment Management | 2.395 | 0,97 | 0 | |||||
| 2025-07-31 | 13F | Jordan Park Group LLC | 63.271 | -15,36 | 2.755 | -14,92 | ||||
| 2025-08-04 | 13F | Spire Wealth Management | 293 | 0,00 | 13 | 0,00 | ||||
| 2025-08-12 | 13F | Tarbox Family Office, Inc. | 29.935 | 0,17 | 1.304 | 0,70 | ||||
| 2025-07-11 | 13F | Skyline Advisors, Inc. | 28.793 | 6,52 | 1.254 | 7,09 | ||||
| 2025-08-12 | 13F | Jpmorgan Chase & Co | 395.713 | 2,20 | 17.233 | 2,75 | ||||
| 2025-07-15 | 13F | Oregon Pacific Wealth Management, LLC | 5.778 | -2,10 | 252 | -1,57 | ||||
| 2025-07-31 | 13F | Mason & Associates Inc | 6.999 | -0,21 | 305 | 0,33 | ||||
| 2025-08-13 | 13F | Natixis Advisors, L.p. | 12.975 | 1,00 | 1 | |||||
| 2025-07-25 | 13F | Envestnet Portfolio Solutions, Inc. | 365.377 | 7,69 | 15.912 | 8,27 | ||||
| 2025-07-30 | 13F | Brookstone Capital Management | 15.864 | -5,57 | 691 | -5,09 | ||||
| 2025-08-06 | 13F | One Wealth Capital Management, Llc | 6.942 | 29,85 | 302 | 30,74 | ||||
| 2025-08-08 | 13F | Accredited Investors Inc. | 38.982 | 17,16 | 1.698 | 17,77 | ||||
| 2025-08-14 | 13F | Integrated Wealth Concepts LLC | 10.954 | 17,91 | 477 | 18,66 | ||||
| 2025-07-30 | 13F | Red Crane Wealth Management, Llc | 11.547 | 1,34 | 503 | 1,83 | ||||
| 2025-08-01 | 13F | Ashton Thomas Private Wealth, LLC | 6.270 | -5,37 | 273 | -4,88 | ||||
| 2025-08-15 | 13F | Equitable Holdings, Inc. | 39.375 | 18,56 | 1.715 | 19,19 | ||||
| 2025-08-01 | 13F | Schmidt P J Investment Management Inc | 4.992 | 217 | ||||||
| 2025-07-22 | 13F | Miracle Mile Advisors, LLC | 20.843 | 908 | ||||||
| 2025-08-13 | 13F | GeoWealth Management, LLC | 72.478 | -12,03 | 3.156 | -11,57 | ||||
| 2025-07-31 | 13F | CVA Family Office, LLC | 601 | 0,00 | 26 | 0,00 | ||||
| 2025-04-21 | 13F | ORG Partners LLC | 0 | -100,00 | 0 | |||||
| 2025-07-14 | 13F | UMA Financial Services, Inc. | 4.431 | 0,52 | 193 | 1,05 |