Grundlæggende statistik
| Institutionelle ejere | 207 total, 203 long only, 1 short only, 3 long/short - change of 22,94% MRQ |
| Gennemsnitlig porteføljeallokering | 0.2063 % - change of 33,52% MRQ |
| Institutionelle aktier (lange) | 71.947.248 (ex 13D/G) - change of 5,85MM shares 8,84% MRQ |
| Institutionel værdi (lang) | $ 2.250.856 USD ($1000) |
Institutionelt ejerskab og aktionærer
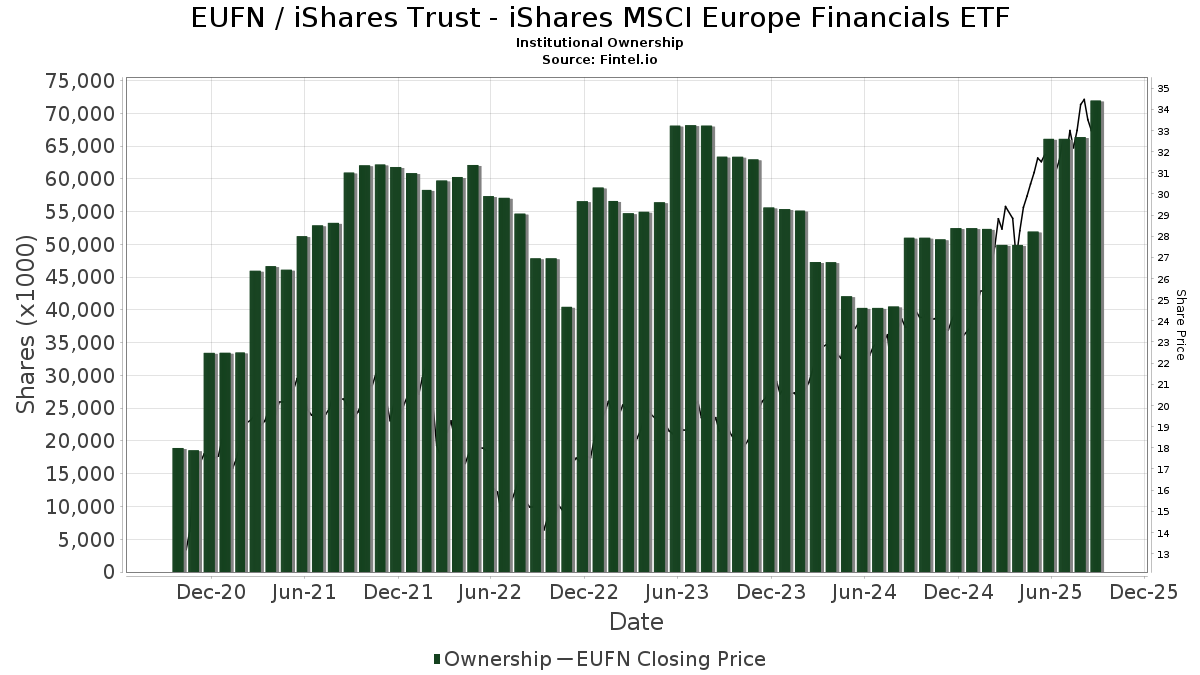
iShares Trust - iShares MSCI Europe Financials ETF (US:EUFN) har 207 institutionelle ejere og aktionærer, der har indsendt 13D/G- eller 13F-formularer til Securities Exchange Commission (SEC). Disse institutioner har i alt 71,947,248 aktier. Største aktionærer omfatter Fisher Asset Management, LLC, Jpmorgan Chase & Co, Morgan Stanley, Envestnet Asset Management Inc, Assetmark, Inc, RiverFront Investment Group, LLC, Schroder Investment Management Group, Jane Street Group, Llc, Td Asset Management Inc, and Congress Wealth Management LLC / DE / .
iShares Trust - iShares MSCI Europe Financials ETF (NasdaqGM:EUFN) institutionel ejerskabsstruktur viser aktuelle positioner i virksomheden efter institutioner og fonde, samt seneste ændringer i positionsstørrelse. Større aktionærer kan omfatte individuelle investorer, investeringsforeninger, hedgefonde eller institutioner. Skema 13D angiver, at investoren besidder (eller besidder) mere end 5 % af virksomheden og har til hensigt (eller har til hensigt at) aktivt at forfølge en ændring i forretningsstrategi. Skema 13G indikerer en passiv investering på over 5%.
The share price as of September 12, 2025 is 34,10 / share. Previously, on September 16, 2024, the share price was 24,34 / share. This represents an increase of 40,10% over that period.
Fondens stemningsscore
Fund Sentiment Score (fka Ownership Accumulation Score) finder de aktier, der bliver mest købt af fonde. Det er resultatet af en sofistikeret, multi-faktor kvantitativ model, der identificerer virksomheder med de højeste niveauer af institutionel akkumulering. Scoringsmodellen bruger en kombination af den samlede stigning i oplyste ejere, ændringerne i porteføljeallokeringer i disse ejere og andre målinger. Tallet går fra 0 til 100, hvor højere tal indikerer et højere niveau af akkumulering for sine jævnaldrende, og 50 er gennemsnittet.
Opdateringsfrekvens: Dagligt
Se Ownership Explorer, som giver en liste over højest rangerende virksomheder.
Institutionel Put/Call-forhold
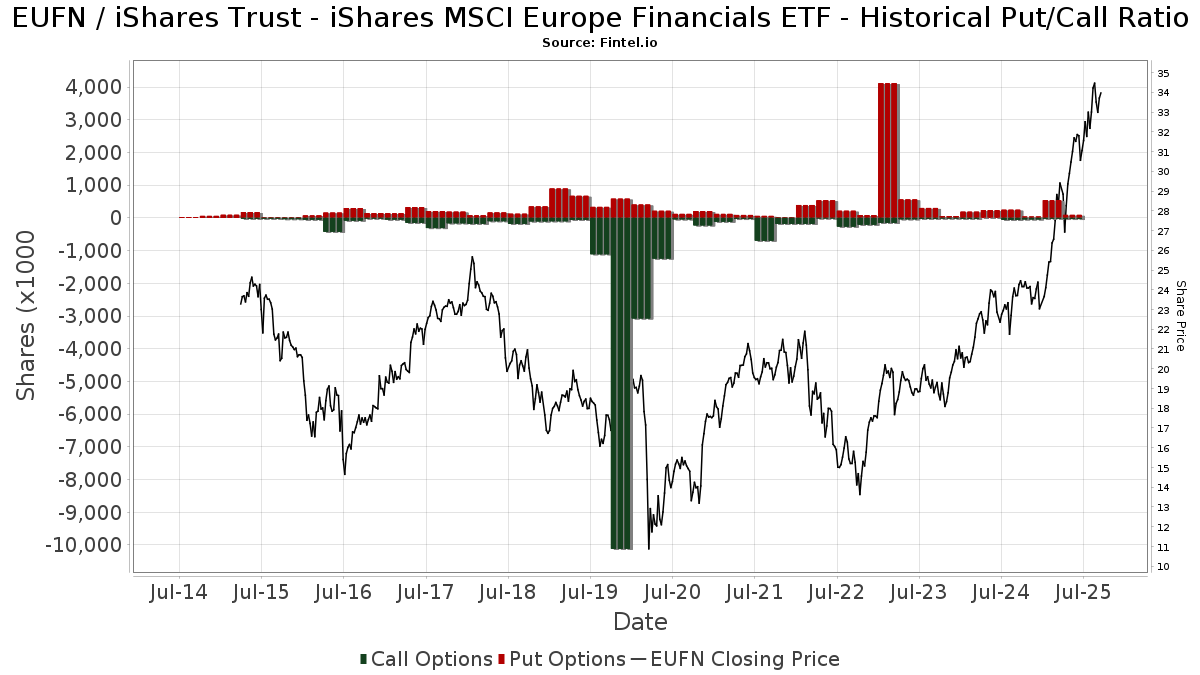
Ud over at indberette standardaktie- og gældsudstedelser skal institutter med mere end 100 mill. aktiver under forvaltning også oplyse deres put- og call-optionsbeholdninger. Da salgsoptioner generelt indikerer negativ stemning, og købsoptioner indikerer positiv stemning, kan vi få en fornemmelse af den overordnede institutionelle stemning ved at plotte forholdet mellem put og kald. Diagrammet til højre viser det historiske put/call-forhold for dette instrument.
Brug af Put/Call Ratio som en indikator for investorernes stemning overvinder en af de vigtigste mangler ved at bruge totalt institutionelt ejerskab, som er, at en betydelig mængde af aktiver under forvaltning investeres passivt for at spore indekser. Passivt forvaltede fonde køber typisk ikke optioner, så indikatoren for put/call-forholdet følger mere nøje følelsen af aktivt forvaltede fonde.
13F og NPORT arkivering
Detaljer om 13F-arkivering er gratis. Detaljer om NP-ansøgninger kræver et premium-medlemskab. Grønne rækker angiver nye positioner. Røde rækker angiver lukkede positioner. Klik på linket ikon for at se den fulde transaktionshistorik.
Opgrader
for at låse premium-data op og eksportere til Excel ![]() .
.
| Fil dato | Kilde | Investor | Type | Gennemsnitlig pris (Øst) |
Aktier | Δ Aktier (%) |
Rapporteret Værdi ($1000) |
Δ Værdi (%) |
Port Alloc (%) |
|
|---|---|---|---|---|---|---|---|---|---|---|
| 2025-08-13 | 13F | Custom Index Systems, Llc | 16.420 | 519 | ||||||
| 2025-07-30 | NP | ENDW - Cambria Endowment Style ETF | 894 | 28 | ||||||
| 2025-07-15 | 13F | North Star Investment Management Corp. | 197.217 | 34,48 | 6.238 | 49,28 | ||||
| 2025-07-14 | 13F | Sowell Financial Services LLC | 8.303 | 263 | ||||||
| 2025-07-09 | 13F | VisionPoint Advisory Group, LLC | 48.564 | 1.536 | ||||||
| 2025-07-15 | 13F | Td Private Client Wealth Llc | 1.635 | 30,80 | 52 | 45,71 | ||||
| 2025-08-14 | 13F | Aspen Grove Capital, LLC | 165.358 | 2,64 | 5.230 | 13,97 | ||||
| 2025-07-07 | 13F | Hedges Asset Management LLC | 21.000 | -40,00 | 664 | -33,40 | ||||
| 2025-08-14 | 13F | D. E. Shaw & Co., Inc. | 409.112 | 12.940 | ||||||
| 2025-07-22 | 13F | DAVENPORT & Co LLC | 9.878 | 15,99 | 312 | 28,93 | ||||
| 2025-08-06 | 13F | North Capital, Inc. | 200 | 0,00 | 6 | 20,00 | ||||
| 2025-08-14 | 13F | Headlands Technologies LLC | 2.215 | 70 | ||||||
| 2025-05-12 | 13F | Simplex Trading, Llc | 0 | -100,00 | 0 | |||||
| 2025-08-04 | 13F | Spire Wealth Management | 1.745 | 2,83 | 55 | 14,58 | ||||
| 2025-08-13 | 13F/A | StoneX Group Inc. | 0 | -100,00 | 0 | |||||
| 2025-08-14 | 13F | Atomi Financial Group, Inc. | 12.137 | -15,10 | 384 | -5,90 | ||||
| 2025-08-14 | 13F | UBS Group AG | 213.642 | -18,47 | 6.757 | -9,48 | ||||
| 2025-08-01 | 13F | Liberty Wealth Management Llc | 7.733 | -94,61 | 245 | 1.642,86 | ||||
| 2025-07-09 | 13F | Massmutual Trust Co Fsb/adv | 209 | 7 | ||||||
| 2025-08-12 | 13F | Steward Partners Investment Advisory, Llc | 12.272 | 0,00 | 388 | 11,17 | ||||
| 2025-08-13 | 13F | Per Stirling Capital Management, LLC. | 22.945 | 726 | ||||||
| 2025-08-14 | 13F/A | Bank Julius Baer & Co. Ltd, Zurich | 3.550 | 13,02 | 112 | 10,89 | ||||
| 2025-08-13 | 13F | Continuum Advisory, LLC | 0 | -100,00 | 0 | |||||
| 2025-05-12 | 13F | Townsquare Capital Llc | 0 | -100,00 | 0 | |||||
| 2025-08-01 | 13F | Envestnet Asset Management Inc | 2.644.498 | 27,57 | 83.640 | 41,62 | ||||
| 2025-08-13 | 13F | Provida Pension Fund Administrator | 0 | -100,00 | 0 | -100,00 | ||||
| 2025-08-08 | 13F | Kingsview Wealth Management, LLC | 216.115 | 6.836 | ||||||
| 2025-08-07 | 13F | Addison Advisors LLC | 445 | 0,00 | 14 | 16,67 | ||||
| 2025-08-29 | 13F | Evolution Wealth Management Inc. | 87 | 3 | ||||||
| 2025-08-12 | 13F | Guerra Pan Advisors, Llc | 7.352 | 233 | ||||||
| 2025-07-31 | 13F | Strait & Sound Wealth Management LLC | 16.227 | 6,01 | 513 | 17,66 | ||||
| 2025-08-13 | 13F | Congress Wealth Management LLC / DE / | 849.120 | 0,66 | 26.858 | 11,76 | ||||
| 2025-08-14 | 13F | Stifel Financial Corp | 54.619 | 49,90 | 1.728 | 66,38 | ||||
| 2025-07-16 | 13F | Evergreen Private Wealth LLC | 90.942 | 2.876 | ||||||
| 2025-07-21 | 13F | Ascent Group, LLC | 18.417 | 583 | ||||||
| 2025-08-14 | 13F | Fmr Llc | 59.330 | 7,10 | 1.877 | 18,88 | ||||
| 2025-07-25 | 13F | Envestnet Portfolio Solutions, Inc. | 26.691 | -44,56 | 844 | -38,44 | ||||
| 2025-07-29 | 13F | Mattson Financial Services, LLC | 0 | -100,00 | 0 | |||||
| 2025-08-07 | 13F | Allworth Financial LP | 546 | 53,37 | 17 | 70,00 | ||||
| 2025-08-06 | 13F | Commonwealth Equity Services, Llc | 17.108 | -1,17 | 1 | |||||
| 2025-08-12 | 13F | Boreal Capital Management LLC | 3.775 | 119 | ||||||
| 2025-08-14 | 13F | Jane Street Group, Llc | 1.322.381 | 83,84 | 41.827 | 104,10 | ||||
| 2025-08-14 | 13F | Riggs Asset Managment Co. Inc. | 265.242 | 145,93 | 8.390 | 173,08 | ||||
| 2025-04-22 | 13F | Synergy Financial Management, LLC | 0 | -100,00 | 0 | |||||
| 2025-08-05 | 13F | Bank Of Montreal /can/ | 41.066 | -1,44 | 1.299 | 9,35 | ||||
| 2025-08-13 | 13F | Schroder Investment Management Group | 1.909.881 | 60.333 | ||||||
| 2025-08-14 | 13F | GWM Advisors LLC | 10.809 | 891,65 | 342 | 1.000,00 | ||||
| 2025-08-15 | 13F | Semmax Financial Advisors Inc. | 253 | 0,00 | 9 | 14,29 | ||||
| 2025-04-22 | 13F | Tower View Investment Management & Research LLC | 0 | -100,00 | 0 | |||||
| 2025-08-15 | 13F | Kestra Advisory Services, LLC | 15.821 | 41,89 | 500 | 57,73 | ||||
| 2025-07-31 | 13F | Hanlon Investment Management, Inc. | 15.942 | 504 | ||||||
| 2025-07-14 | 13F | Park Avenue Securities Llc | 64.063 | 3,18 | 2 | 100,00 | ||||
| 2025-07-16 | 13F | Essex Financial Services, Inc. | 0 | -100,00 | 0 | |||||
| 2025-08-06 | 13F | AE Wealth Management LLC | 8.655 | 24,55 | 274 | 38,58 | ||||
| 2025-07-14 | 13F | Opal Wealth Advisors, LLC | 1.424 | 45 | ||||||
| 2025-08-13 | 13F | Raab & Moskowitz Asset Management LLC | 10.856 | 343 | ||||||
| 2025-03-27 | NP | RLGAX - RiverFront Asset Allocation Growth & Income Investor Shares | 32.251 | -4,11 | 815 | 0,87 | ||||
| 2025-08-14 | 13F | Wells Fargo & Company/mn | 77.214 | -44,81 | 2.442 | -38,74 | ||||
| 2025-08-06 | 13F | Golden State Wealth Management, LLC | 168 | 2,44 | 5 | 25,00 | ||||
| 2025-08-11 | 13F | Annis Gardner Whiting Capital Advisors, LLC | 1.439 | 46 | ||||||
| 2025-05-13 | 13F | Clear Street Markets Llc | 0 | -100,00 | 0 | |||||
| 2025-08-13 | 13F | Russell Investments Group, Ltd. | 1.907 | 17,21 | 60 | 30,43 | ||||
| 2025-08-14 | 13F | Goldman Sachs Group Inc | 440.251 | -6,56 | 13.925 | 3,74 | ||||
| 2025-08-19 | 13F | Delos Wealth Advisors, LLC | 96 | 3 | ||||||
| 2025-08-01 | 13F | Ashton Thomas Private Wealth, LLC | 23.686 | -5,20 | 749 | 5,34 | ||||
| 2025-07-31 | 13F | Cambridge Investment Research Advisors, Inc. | 60.844 | 77,96 | 2 | |||||
| 2025-08-12 | 13F | RiverFront Investment Group, LLC | 2.360.087 | 29,10 | 74.650 | 43,34 | ||||
| 2025-09-12 | 13F/A | Valeo Financial Advisors, LLC | 6.685 | 211 | ||||||
| 2025-07-21 | 13F | Mirae Asset Global Investments Co., Ltd. | 0 | -100,00 | 0 | |||||
| 2025-08-06 | 13F | Pekin Hardy Strauss, Inc. | 6.635 | 210 | ||||||
| 2025-08-14 | 13F | Jane Street Group, Llc | Put | 20.300 | 642 | |||||
| 2025-07-23 | 13F | Godsey & Gibb Associates | 0 | -100,00 | 0 | |||||
| 2025-08-12 | 13F | MAI Capital Management | 826 | 0,00 | 26 | 13,04 | ||||
| 2025-08-14 | 13F | Uniplan Investment Counsel, Inc. | 568 | 24,56 | 18 | 30,77 | ||||
| 2025-08-12 | 13F | Running Point Capital Advisors, LLC | 839 | 27 | ||||||
| 2025-08-06 | 13F | Prospera Financial Services Inc | 122.684 | -11,23 | 3.880 | -1,45 | ||||
| 2025-08-14 | 13F | Jane Street Group, Llc | Call | 10.100 | 18,82 | 319 | 31,82 | |||
| 2025-08-15 | 13F | Provenance Wealth Advisors, LLC | 2.542 | 0,00 | 80 | 11,11 | ||||
| 2025-07-18 | 13F | Founders Capital Management | 84 | 0,00 | 3 | 0,00 | ||||
| 2025-08-08 | 13F | Creative Planning | 52.105 | 19,91 | 1.648 | 33,23 | ||||
| 2025-07-10 | 13F | Anderson Hoagland & Co | 75.428 | 93,67 | 2.386 | 147,41 | ||||
| 2025-08-14 | 13F | Wiley Bros.-aintree Capital, Llc | 7.128 | 225 | ||||||
| 2025-05-14 | 13F | Group One Trading, L.p. | 0 | -100,00 | 0 | -100,00 | ||||
| 2025-08-12 | 13F | O'shaughnessy Asset Management, Llc | 6.523 | 277,71 | 206 | 320,41 | ||||
| 2025-07-17 | 13F | HB Wealth Management, LLC | 13.292 | 0,00 | 420 | 11,11 | ||||
| 2025-08-08 | 13F | City Of London Investment Management Co Ltd | 7.280 | 230 | ||||||
| 2025-08-12 | 13F | Proequities, Inc. | 0 | 0 | ||||||
| 2025-08-14 | 13F/A | Rockefeller Capital Management L.P. | 19.308 | 4,32 | 611 | 15,75 | ||||
| 2025-07-24 | 13F | Us Bancorp \de\ | 1.169 | 4,94 | 37 | 16,13 | ||||
| 2025-08-14 | 13F/A | Barclays Plc | 79 | 0 | ||||||
| 2025-04-17 | 13F | Warther Private Wealth, LLC | 0 | -100,00 | 0 | -100,00 | ||||
| 2025-07-10 | 13F | Wealth Enhancement Advisory Services, Llc | 16.272 | 517 | ||||||
| 2025-07-08 | 13F | Webster Bank, N. A. | 1.071 | 0,00 | 34 | 10,00 | ||||
| 2025-08-14 | 13F | BTG Pactual Asset Management US LLC | Put | 0 | -100,00 | 0 | ||||
| 2025-08-14 | 13F | BTG Pactual Asset Management US LLC | 0 | -100,00 | 0 | |||||
| 2025-08-14 | 13F | Federation des caisses Desjardins du Quebec | 1.210 | -45,25 | 38 | -38,71 | ||||
| 2025-08-14 | 13F | Royal Bank Of Canada | 801.884 | 91,54 | 25.364 | 112,64 | ||||
| 2025-04-15 | 13F | Greenwood Capital Associates Llc | 0 | -100,00 | 0 | |||||
| 2025-07-28 | 13F | Td Asset Management Inc | 1.243.902 | 0,00 | 39.345 | 11,02 | ||||
| 2025-08-18 | 13F | Geneos Wealth Management Inc. | 21.467 | 0,00 | 679 | 11,13 | ||||
| 2025-08-14 | 13F | Harris Associates L P | 600 | 0,00 | 19 | 5,88 | ||||
| 2025-07-17 | 13F | Halbert Hargrove Global Advisors, Llc | 205 | 0,00 | 6 | 20,00 | ||||
| 2025-07-17 | 13F | Janney Montgomery Scott LLC | 333.737 | 90,25 | 11 | 150,00 | ||||
| 2025-08-05 | 13F | Huntington National Bank | 120 | 13,21 | ||||||
| 2025-07-21 | 13F | Ameritas Advisory Services, LLC | 140 | 4 | ||||||
| 2025-08-11 | 13F | Rothschild Investment Llc | 181 | 0,00 | 6 | 0,00 | ||||
| 2025-04-22 | 13F/A | NorthRock Partners, LLC | 0 | -100,00 | 0 | |||||
| 2025-07-29 | 13F | APCM Wealth Management for Individuals | 291.229 | 0,68 | 9.212 | 11,78 | ||||
| 2025-08-12 | 13F | Global Retirement Partners, LLC | 2.510 | 861,69 | 79 | 1.216,67 | ||||
| 2025-08-12 | 13F | Aviso Financial Inc. | 273 | 9 | ||||||
| 2025-08-13 | 13F | Northwestern Mutual Wealth Management Co | 3.050 | -41,03 | 96 | -34,69 | ||||
| 2025-07-03 | 13F | Garde Capital, Inc. | 1.680 | 0,00 | 53 | 12,77 | ||||
| 2025-08-13 | 13F | Northern Trust Corp | 9.511 | 301 | ||||||
| 2025-08-14 | 13F | Hrt Financial Lp | 0 | -100,00 | 0 | |||||
| 2025-08-14 | 13F | Tudor Investment Corp Et Al | 88.672 | 2.805 | ||||||
| 2025-08-05 | 13F | Carolinas Wealth Consulting Llc | 0 | -100,00 | 0 | -100,00 | ||||
| 2025-08-15 | 13F | Captrust Financial Advisors | 14.980 | -2,30 | 474 | 8,49 | ||||
| 2025-08-05 | 13F | Key FInancial Inc | 0 | -100,00 | 0 | |||||
| 2025-08-12 | 13F | Fairscale Capital, LLC | 348 | 11 | ||||||
| 2025-08-06 | 13F | Bensler, LLC | 672.430 | 21.269 | ||||||
| 2025-07-25 | 13F | Atria Wealth Solutions, Inc. | 9.270 | -61,82 | 293 | -57,60 | ||||
| 2025-07-28 | 13F | Harbour Investments, Inc. | 32.473 | 5.858,35 | 1.027 | 6.746,67 | ||||
| 2025-08-14 | 13F | Mariner, LLC | 19.350 | -13,01 | 612 | -3,32 | ||||
| 2025-08-18 | 13F/A | Kestra Investment Management, LLC | 6.400 | 202 | ||||||
| 2025-07-29 | 13F | Alaska Permanent Capital Management | 11.551 | -98,10 | 366 | -97,88 | ||||
| 2025-09-04 | 13F/A | Advisor Group Holdings, Inc. | 51.139 | 529,25 | 1.511 | 553,68 | ||||
| 2025-07-16 | 13F | ORG Wealth Partners, LLC | 88 | 0,00 | 3 | 0,00 | ||||
| 2025-08-11 | 13F | Aptus Capital Advisors, LLC | 1.613 | 44,02 | 51 | 64,52 | ||||
| 2025-08-14 | 13F | Citadel Advisors Llc | 562.616 | 17.796 | ||||||
| 2025-07-09 | 13F | Byrne Asset Management LLC | 347 | 0,00 | 11 | 11,11 | ||||
| 2025-08-14 | 13F | Citadel Advisors Llc | Put | 25.900 | 22,75 | 819 | 36,27 | |||
| 2025-08-14 | 13F | Mml Investors Services, Llc | 187.379 | 52,39 | 6 | 66,67 | ||||
| 2025-08-11 | 13F | Beaumont Capital Management, LLC | 36.878 | 1.166 | ||||||
| 2025-08-12 | 13F | Integrated Advisors Network LLC | 6.850 | 217 | ||||||
| 2025-07-24 | 13F | Blair William & Co/il | 8.288 | 2,83 | 262 | 14,41 | ||||
| 2025-08-15 | 13F | Morgan Stanley | 4.708.478 | 11,38 | 148.929 | 23,65 | ||||
| 2025-07-01 | 13F | Harbor Investment Advisory, Llc | 331 | 0,00 | 10 | 11,11 | ||||
| 2025-08-14 | 13F | Ameriprise Financial Inc | 71.164 | 199,27 | 2.251 | 213,81 | ||||
| 2025-07-21 | 13F | Fortis Capital Advisors, LLC | 10.516 | 5,16 | 333 | 16,90 | ||||
| 2025-08-14 | 13F | Citadel Advisors Llc | Call | 13.500 | 23,85 | 427 | 37,74 | |||
| 2025-08-14 | 13F | Arete Wealth Advisors, LLC | 22.841 | 1 | ||||||
| 2025-08-12 | 13F | LPL Financial LLC | 617.534 | 48,31 | 19.533 | 64,66 | ||||
| 2025-08-08 | 13F | Cetera Investment Advisers | 188.245 | 3,47 | 5.954 | 14,88 | ||||
| 2025-07-14 | 13F | GAMMA Investing LLC | 1.748 | 0,00 | 55 | 12,24 | ||||
| 2025-07-24 | 13F | IFP Advisors, Inc | 1.435 | 45 | ||||||
| 2025-08-15 | 13F | Equitable Holdings, Inc. | 37.965 | -6,23 | 1.201 | 4,08 | ||||
| 2025-08-14 | 13F | Circle Wealth Management, LLC | 0 | -100,00 | 0 | |||||
| 2025-08-13 | 13F | Fisher Asset Management, LLC | 35.345.109 | -7,76 | 1.117.966 | 2,40 | ||||
| 2025-08-08 | 13F | Tortoise Investment Management, LLC | 36 | 0,00 | 1 | 0,00 | ||||
| 2025-08-13 | 13F | Kayne Anderson Rudnick Investment Management Llc | 7.683 | 0,00 | 243 | 11,47 | ||||
| 2025-07-17 | 13F | Fifth Third Securities, Inc. | 53.094 | 1.679 | ||||||
| 2025-08-13 | 13F | Hsbc Holdings Plc | 50.894 | -23,41 | 1.610 | -15,00 | ||||
| 2025-07-08 | 13F | Nbc Securities, Inc. | 130 | 0 | ||||||
| 2025-07-29 | 13F | Koshinski Asset Management, Inc. | 9.442 | 26,42 | 299 | 40,57 | ||||
| 2025-08-13 | 13F | Banco de Sabadell, S.A | 61.897 | 42,03 | 2 | 0,00 | ||||
| 2025-08-06 | 13F | Adviser Investments LLC | 14.000 | 443 | ||||||
| 2025-08-06 | 13F | Csenge Advisory Group | 9.338 | 297 | ||||||
| 2025-08-08 | 13F/A | Ignite Planners, LLC | 9.068 | 288 | ||||||
| 2025-08-11 | 13F | HighTower Advisors, LLC | 77.984 | -28,48 | 2.467 | -20,61 | ||||
| 2025-08-12 | 13F | Calton & Associates, Inc. | 16.255 | -1,18 | 514 | 9,83 | ||||
| 2025-08-14 | 13F | Bank Of America Corp /de/ | 391.457 | 53,33 | 12.382 | 70,23 | ||||
| 2025-07-29 | 13F | JTC Employer Solutions Trusteee Ltd | 10.600 | 0,00 | 0 | |||||
| 2025-08-14 | 13F | Transamerica Financial Advisors, Inc. | 35.325 | 1,08 | 1.117 | |||||
| 2025-07-11 | 13F | Farther Finance Advisors, LLC | 7.107 | -54,94 | 225 | -50,33 | ||||
| 2025-08-06 | 13F | Wedbush Securities Inc | 9.549 | 0 | ||||||
| 2025-07-25 | 13F | Cwm, Llc | 1.441 | -30,08 | 0 | |||||
| 2025-08-13 | 13F | Jones Financial Companies Lllp | 33.234 | 143,49 | 1.050 | 166,92 | ||||
| 2025-07-28 | 13F | BRYN MAWR TRUST Co | 1.952 | 39,43 | 62 | 56,41 | ||||
| 2025-08-14 | 13F | Alaska Permanent Fund Corp | 0 | -100,00 | 0 | |||||
| 2025-08-29 | NP | GDMA - Gadsden Dynamic Multi-Asset ETF | 96.533 | 78,36 | 3.053 | 98,12 | ||||
| 2025-08-14 | 13F | Harmony Asset Management Llc | 26.009 | -5,22 | 823 | 5,25 | ||||
| 2025-08-11 | 13F | Empowered Funds, LLC | 97.689 | 80,49 | 3.090 | 100,45 | ||||
| 2025-08-13 | 13F | Baird Financial Group, Inc. | 44.359 | 2,20 | 1.403 | 13,51 | ||||
| 2025-07-23 | 13F | Friedenthal Financial | 3.963 | -3,03 | 125 | 7,76 | ||||
| 2025-08-04 | 13F | Pensionmark Financial Group, Llc | 24.300 | 20,34 | 769 | 33,57 | ||||
| 2025-07-29 | 13F | Wealthstream Advisors, Inc. | 7.616 | 241 | ||||||
| 2025-08-12 | 13F | Edmond De Rothschild Holding S.a. | 2.450 | 0,00 | 77 | 11,59 | ||||
| 2025-08-13 | 13F | Johnson Financial Group, Inc. | 698 | 22 | ||||||
| 2025-08-14 | 13F | Raymond James Financial Inc | 766.490 | 40,01 | 24.244 | 55,45 | ||||
| 2025-08-14 | 13F | Unisphere Establishment | 222.500 | -33,08 | 7.038 | -25,71 | ||||
| 2025-08-06 | 13F | SOUTH STATE Corp | 0 | -100,00 | 0 | |||||
| 2025-08-14 | 13F | 1607 Capital Partners, LLC | 485.884 | 15.369 | ||||||
| 2025-08-14 | 13F | Clark Capital Management Group, Inc. | 111.455 | -9,70 | 3.525 | 0,26 | ||||
| 2025-07-24 | 13F | Ronald Blue Trust, Inc. | 340 | 0,00 | 11 | 11,11 | ||||
| 2025-05-12 | 13F | C2P Capital Advisory Group, LLC d.b.a. Prosperity Capital Advisors | 0 | -100,00 | 0 | -100,00 | ||||
| 2025-07-22 | 13F | Belpointe Asset Management LLC | 10.516 | 5,16 | 333 | 16,90 | ||||
| 2025-08-11 | 13F | TD Waterhouse Canada Inc. | 8.198 | 278,84 | 258 | 322,95 | ||||
| 2025-08-06 | 13F | Savant Capital, LLC | 15.295 | 35,90 | 484 | 50,94 | ||||
| 2025-08-14 | 13F | Smartleaf Asset Management LLC | 18 | 0,00 | 1 | |||||
| 2025-08-08 | 13F | Pnc Financial Services Group, Inc. | 3.033 | 56,99 | 96 | 72,73 | ||||
| 2025-08-11 | 13F | Citigroup Inc | 1.397 | 0,00 | 44 | 12,82 | ||||
| 2025-08-01 | 13F | Bessemer Group Inc | 0 | -100,00 | 0 | |||||
| 2025-08-14 | 13F | Two Sigma Securities, Llc | 0 | -100,00 | 0 | |||||
| 2025-08-12 | 13F | CIBC Private Wealth Group, LLC | 751 | 5,63 | 24 | 35,29 | ||||
| 2025-08-11 | 13F | Principal Securities, Inc. | 1.076 | 321,96 | 34 | 580,00 | ||||
| 2025-04-28 | 13F | First Horizon Advisors, Inc. | 0 | -100,00 | 0 | |||||
| 2025-07-29 | NP | MVFG - Monarch Volume Factor Global Unconstrained Index ETF | 168.168 | 5.344 | ||||||
| 2025-08-01 | 13F | MorganRosel Wealth Management, LLC | 305 | 0,00 | 10 | 12,50 | ||||
| 2025-08-14 | 13F | Comerica Bank | 39.377 | -13,95 | 1.245 | -4,45 | ||||
| 2025-08-14 | 13F | Murphy & Mullick Capital Management Corp | 302 | 0,00 | 10 | 12,50 | ||||
| 2025-08-12 | 13F | 17 Capital Partners, Llc | 12.310 | 35,27 | 389 | 50,19 | ||||
| 2025-07-02 | 13F/A | Bank Of Nova Scotia | 0 | -100,00 | 0 | |||||
| 2025-08-13 | 13F | Twin Peaks Wealth Advisors, LLC | 270 | 9 | ||||||
| 2025-07-30 | 13F | Brookstone Capital Management | 6.590 | 208 | ||||||
| 2025-08-13 | 13F | GeoWealth Management, LLC | 14.545 | 37,61 | 460 | 52,82 | ||||
| 2025-08-14 | 13F | Philadelphia Financial Management of San Francisco, LLC | Put | 0 | -100,00 | 0 | ||||
| 2025-07-21 | 13F | Crews Bank & Trust | 140 | 4 | ||||||
| 2025-08-14 | 13F | Mercer Global Advisors Inc /adv | 10.987 | 3,48 | 348 | 14,90 | ||||
| 2025-08-19 | 13F | Newbridge Financial Services Group, Inc. | 160 | 0,00 | 5 | 25,00 | ||||
| 2025-08-04 | 13F | Atria Investments Llc | 7.416 | 235 | ||||||
| 2025-08-08 | 13F | Capital Investment Advisory Services, LLC | 1.591 | 16,30 | 50 | 31,58 | ||||
| 2025-05-15 | 13F | Glenmede Trust Co Na | 16.524 | 0,00 | 471 | 22,08 | ||||
| 2025-07-18 | 13F | Truist Financial Corp | 98.877 | 50,17 | 3.127 | 66,77 | ||||
| 2025-08-13 | 13F | Renaissance Technologies Llc | 110.000 | 52,97 | 3.479 | 69,87 | ||||
| 2025-08-13 | 13F | PineBridge Investments, L.P. | 9.548 | -91,40 | 302 | -90,45 | ||||
| 2025-08-14 | 13F | CIBC World Markets Inc. | 14.313 | -14,19 | 453 | -4,84 | ||||
| 2025-08-13 | 13F | bLong Financial, LLC | 485.074 | 72,28 | 15.343 | 91,27 | ||||
| 2025-08-04 | 13F | Integrity Alliance, Llc. | 6.975 | 221 | ||||||
| 2025-08-14 | 13F | Old Mission Capital Llc | 33.466 | 1.059 | ||||||
| 2025-08-14 | 13F | Qube Research & Technologies Ltd | 237.367 | 23.355,24 | 7.508 | 26.710,71 | ||||
| 2025-08-12 | 13F | SRS Capital Advisors, Inc. | 622 | 0,00 | 20 | 11,76 | ||||
| 2025-07-15 | 13F | Fifth Third Bancorp | 0 | -100,00 | 0 | |||||
| 2025-08-12 | 13F | Cumberland Partners Ltd | 127.435 | 3,66 | 4.031 | 15,08 | ||||
| 2025-08-14 | 13F | Susquehanna International Group, Llp | Call | 10.500 | 332 | |||||
| 2025-08-14 | 13F | Susquehanna International Group, Llp | Put | 32.800 | -2,67 | 1.037 | 8,02 | |||
| 2025-08-12 | 13F | Jpmorgan Chase & Co | 6.598.096 | -20,16 | 208.698 | -11,36 | ||||
| 2025-08-04 | 13F | Assetmark, Inc | 2.595.130 | 82.084 | ||||||
| 2025-08-18 | 13F | Wolverine Trading, Llc | Put | 13.900 | 49,46 | 439 | 63,81 | |||
| 2025-07-14 | 13F | Farmers & Merchants Investments Inc | 1.708 | 0,00 | 54 | 12,50 | ||||
| 2025-08-14 | 13F | Bnp Paribas Arbitrage, Sa | 0 | -100,00 | 0 | |||||
| 2025-07-18 | 13F | TruNorth Capital Management, LLC | 135 | 0,00 | 4 | 33,33 | ||||
| 2025-08-14 | 13F | Barometer Capital Management Inc. | 15.950 | -34,23 | 504 | -26,96 | ||||
| 2025-08-04 | 13F | Waterfront Wealth Inc. | 244.320 | 0,83 | 7.728 | 11,94 | ||||
| 2025-08-11 | 13F | Brown Brothers Harriman & Co | 16 | 0,00 | 1 | |||||
| 2025-07-23 | 13F | Viewpoint Capital Management LLC | 124.541 | -0,18 | 3.939 | 10,83 | ||||
| 2025-07-30 | 13F | Parcion Private Wealth LLC | 12.650 | 0,00 | 400 | 11,11 | ||||
| 2025-08-04 | 13F | Creative Financial Designs Inc /adv | 1.785 | 0,73 | 56 | 12,00 | ||||
| 2025-07-15 | 13F | FLP Wealth Management, LLC | 0 | -100,00 | 0 | |||||
| 2025-08-01 | 13F | Solstein Capital, LLC | 220 | 0,00 | 7 | 0,00 | ||||
| 2025-08-11 | 13F | Private Advisor Group, LLC | 12.336 | 17,63 | 390 | 30,87 | ||||
| 2025-08-13 | 13F | Azimuth Capital Investment Management LLC | 586.420 | 7,67 | 18.548 | 19,54 | ||||
| 2025-07-16 | 13F | Signaturefd, Llc | 102 | 70,00 | 3 | 200,00 | ||||
| 2025-08-12 | 13F | AlphaCore Capital LLC | 82 | -85,06 | 3 | -86,67 | ||||
| 2025-07-24 | 13F | Rice Partnership, LLC | 2.553 | 0,00 | 81 | 11,11 | ||||
| 2025-08-12 | 13F | Coldstream Capital Management Inc | 0 | -100,00 | 0 | |||||
| 2025-08-08 | 13F | Empower Advisory Group, LLC | 7.875 | 249 | ||||||
| 2025-07-31 | 13F | LJI Wealth Management, LLC | 9.005 | 0,00 | 285 | 10,94 | ||||
| 2025-08-13 | 13F | AMJ Financial Wealth Management | 8.134 | 257 |