Grundlæggende statistik
| Institutionelle ejere | 171 total, 171 long only, 0 short only, 0 long/short - change of -1,72% MRQ |
| Gennemsnitlig porteføljeallokering | 0.0684 % - change of -24,77% MRQ |
| Institutionelle aktier (lange) | 24.681.379 (ex 13D/G) - change of -0,36MM shares -1,45% MRQ |
| Institutionel værdi (lang) | $ 214.688 USD ($1000) |
Institutionelt ejerskab og aktionærer
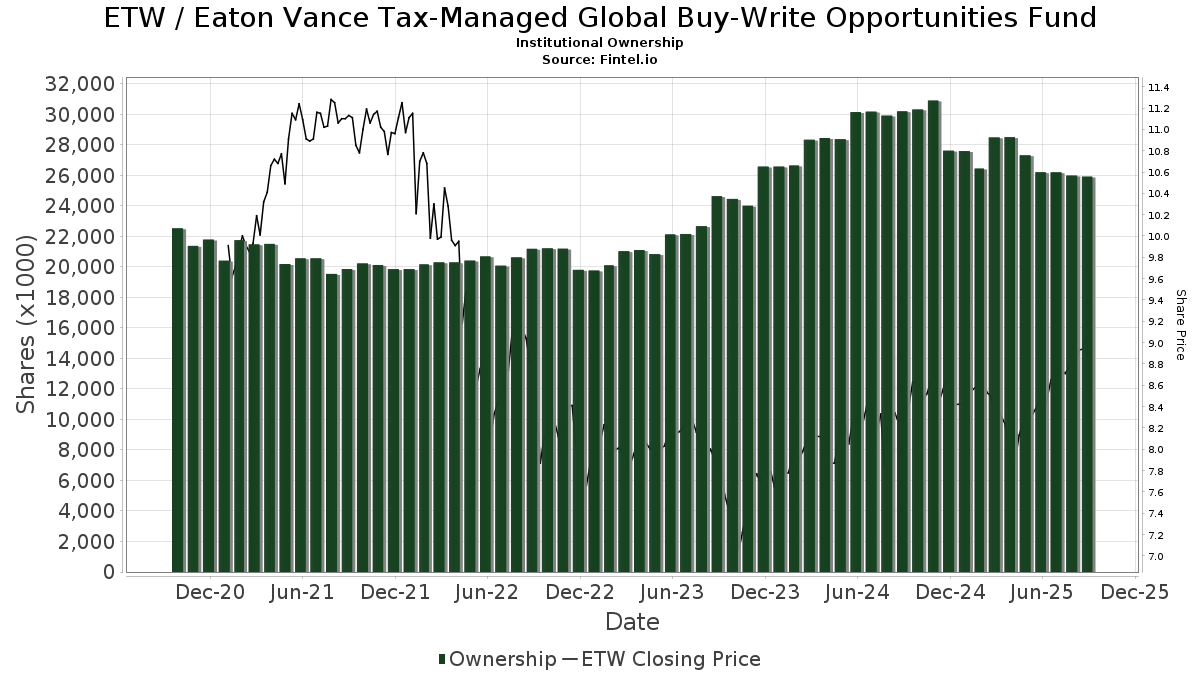
Eaton Vance Tax-Managed Global Buy-Write Opportunities Fund (US:ETW) har 171 institutionelle ejere og aktionærer, der har indsendt 13D/G- eller 13F-formularer til Securities Exchange Commission (SEC). Disse institutioner har i alt 24,681,379 aktier. Største aktionærer omfatter Guggenheim Capital Llc, Bank Of America Corp /de/, Morgan Stanley, Raymond James Financial Inc, Invesco Ltd., 1607 Capital Partners, LLC, Royal Bank Of Canada, Penserra Capital Management LLC, LPL Financial LLC, and Advisors Asset Management, Inc. .
Eaton Vance Tax-Managed Global Buy-Write Opportunities Fund (NYSE:ETW) institutionel ejerskabsstruktur viser aktuelle positioner i virksomheden efter institutioner og fonde, samt seneste ændringer i positionsstørrelse. Større aktionærer kan omfatte individuelle investorer, investeringsforeninger, hedgefonde eller institutioner. Skema 13D angiver, at investoren besidder (eller besidder) mere end 5 % af virksomheden og har til hensigt (eller har til hensigt at) aktivt at forfølge en ændring i forretningsstrategi. Skema 13G indikerer en passiv investering på over 5%.
The share price as of April 24, 2026 is 9,31 / share. Previously, on April 25, 2025, the share price was 8,04 / share. This represents an increase of 15,80% over that period.
Fondens stemningsscore
Fund Sentiment Score (fka Ownership Accumulation Score) finder de aktier, der bliver mest købt af fonde. Det er resultatet af en sofistikeret, multi-faktor kvantitativ model, der identificerer virksomheder med de højeste niveauer af institutionel akkumulering. Scoringsmodellen bruger en kombination af den samlede stigning i oplyste ejere, ændringerne i porteføljeallokeringer i disse ejere og andre målinger. Tallet går fra 0 til 100, hvor højere tal indikerer et højere niveau af akkumulering for sine jævnaldrende, og 50 er gennemsnittet.
Opdateringsfrekvens: Dagligt
Se Ownership Explorer, som giver en liste over højest rangerende virksomheder.
AI+ Ask Fintel’s AI assistant about Eaton Vance Tax-Managed Global Buy-Write Opportunities Fund.
Select a question to share a public post with an AI-crafted answer.
Thinking of good questions…
Institutionel Put/Call-forhold
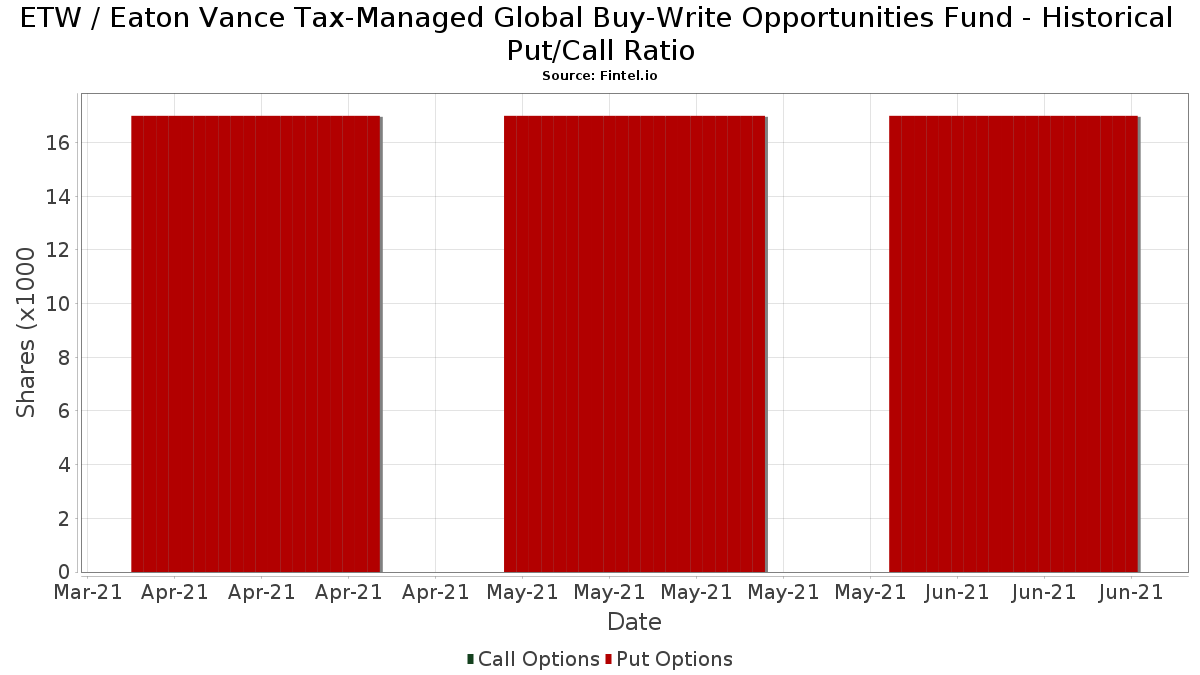
Ud over at indberette standardaktie- og gældsudstedelser skal institutter med mere end 100 mill. aktiver under forvaltning også oplyse deres put- og call-optionsbeholdninger. Da salgsoptioner generelt indikerer negativ stemning, og købsoptioner indikerer positiv stemning, kan vi få en fornemmelse af den overordnede institutionelle stemning ved at plotte forholdet mellem put og kald. Diagrammet til højre viser det historiske put/call-forhold for dette instrument.
Brug af Put/Call Ratio som en indikator for investorernes stemning overvinder en af de vigtigste mangler ved at bruge totalt institutionelt ejerskab, som er, at en betydelig mængde af aktiver under forvaltning investeres passivt for at spore indekser. Passivt forvaltede fonde køber typisk ikke optioner, så indikatoren for put/call-forholdet følger mere nøje følelsen af aktivt forvaltede fonde.
13F og NPORT arkivering
Detaljer om 13F-arkivering er gratis. Detaljer om NP-ansøgninger kræver et premium-medlemskab. Grønne rækker angiver nye positioner. Røde rækker angiver lukkede positioner. Klik på linket ikon for at se den fulde transaktionshistorik.
Opgrader
for at låse premium-data op og eksportere til Excel ![]() .
.
| Fil dato | Kilde | Investor | Type | Gennemsnitlig pris (Øst) |
Aktier | Δ Aktier (%) |
Rapporteret Værdi ($1000) |
Δ Værdi (%) |
Port Alloc (%) |
|
|---|---|---|---|---|---|---|---|---|---|---|
| 2026-01-26 | 13F | Cwm, Llc | 4.950 | 0 | ||||||
| 2026-02-19 | 13F | CI Private Wealth, LLC | 12.560 | 0,00 | 116 | 2,65 | ||||
| 2026-01-28 | 13F | Barrett & Company, Inc. | 6.600 | 193,33 | 62 | 210,00 | ||||
| 2026-04-22 | 13F | Detalus Advisors, LLC | 10.875 | 0,00 | 95 | -5,00 | ||||
| 2026-02-05 | 13F | Blue Water Asset Management | 11.017 | 102 | ||||||
| 2026-02-06 | 13F | Global Retirement Partners, LLC | 250 | 0,00 | 2 | 0,00 | ||||
| 2026-04-23 | 13F | Vista Investment Partners Ii, Llc | 19.103 | 0,00 | 168 | -5,11 | ||||
| 2026-02-05 | 13F | Gamco Investors, Inc. Et Al | 30.963 | 0,00 | 285 | 1,79 | ||||
| 2026-04-20 | 13F | Jfs Wealth Advisors, Llc | 0 | -100,00 | 0 | |||||
| 2026-02-13 | 13F | Aptus Capital Advisors, LLC | 10.407 | 0,10 | 96 | 1,06 | ||||
| 2026-04-08 | 13F | Wealth Enhancement Advisory Services, Llc | 70.993 | -17,43 | 634 | -21,07 | ||||
| 2026-02-06 | 13F | GPS Wealth Strategies Group, LLC | 0 | -100,00 | 0 | |||||
| 2026-02-10 | 13F | Rothschild Investment Llc | 26.881 | -3,76 | 248 | -1,98 | ||||
| 2026-02-17 | 13F | Bank Of America Corp /de/ | 2.205.576 | -3,89 | 20.335 | -2,08 | ||||
| 2026-02-06 | 13F | Pnc Financial Services Group, Inc. | 56.585 | -1,74 | 522 | 0,00 | ||||
| 2026-02-09 | 13F | Harbour Investments, Inc. | 19.271 | 25,07 | 178 | 27,34 | ||||
| 2026-02-13 | 13F | Citigroup Inc | 37.668 | 4,86 | 347 | 6,77 | ||||
| 2026-04-15 | 13F | City Holding Co | 2.250 | -50,00 | 20 | -53,66 | ||||
| 2026-02-12 | 13F | Summit Financial, LLC | 27.433 | -9,06 | 253 | -7,69 | ||||
| 2026-02-17 | 13F | Guardian Wealth Advisors, Llc / Nc | 10.407 | 0,10 | 96 | 1,06 | ||||
| 2026-04-15 | 13F | Cohen Klingenstein LLC | 114.690 | 0,00 | 1.007 | -4,82 | ||||
| 2026-02-02 | 13F | CENTRAL TRUST Co | 0 | -100,00 | 0 | |||||
| 2026-02-24 | 13F | Avory & Company, LLC | 45.682 | 0,00 | 421 | 1,94 | ||||
| 2025-11-07 | 13F | Ballast, Inc. | 0 | -100,00 | 0 | -100,00 | ||||
| 2026-02-11 | 13F | LPL Financial LLC | 789.358 | 8,83 | 7.278 | 10,88 | ||||
| 2026-02-10 | 13F | ESL Trust Services, LLC | 1.150 | 0,00 | 11 | 0,00 | ||||
| 2026-04-10 | 13F | Centurion Wealth Management LLC | 52.043 | 0,00 | 457 | -4,80 | ||||
| 2026-02-17 | 13F | Advisor Group Holdings, Inc. | 407.894 | 3,17 | 3.761 | 5,65 | ||||
| 2026-02-12 | 13F | Hrt Financial Lp | 16.795 | 0 | ||||||
| 2026-01-07 | 13F | Sagespring Wealth Partners, Llc | 14.255 | 30,73 | 131 | 33,67 | ||||
| 2026-04-10 | 13F | Franklin Street Advisors Inc /nc | 150.334 | 0,00 | 1.320 | -4,83 | ||||
| 2026-01-26 | 13F | Roman Butler Fullerton & Co | 212.904 | 6,77 | 1.971 | 9,26 | ||||
| 2026-04-17 | 13F | PMG Family Office LLC | 71.056 | 3,04 | 624 | -1,89 | ||||
| 2026-04-20 | 13F | RiverTree Advisors, LLC | 445.503 | 7,98 | 3.912 | 2,81 | ||||
| 2026-01-20 | 13F | Stratos Wealth Partners, LTD. | 39.429 | -9,29 | 364 | -7,63 | ||||
| 2026-02-19 | 13F | Atomi Financial Group, Inc. | 53.492 | 0,00 | 493 | 1,86 | ||||
| 2026-02-17 | 13F | Guggenheim Capital Llc | 2.296.545 | 8,54 | 21.174 | 10,57 | ||||
| 2025-11-03 | 13F | Summit Investment Advisory Services, LLC | 22.362 | 0,00 | 193 | 0,00 | ||||
| 2026-01-29 | 13F | D.a. Davidson & Co. | 82.831 | 8,44 | 764 | 10,42 | ||||
| 2026-02-13 | 13F | Pathstone Holdings, LLC | 527.575 | -41,11 | 4.864 | -40,00 | ||||
| 2026-01-16 | 13F | Genesis Financial Group, LLC | 43.381 | 400 | ||||||
| 2026-02-11 | 13F | Closed-End Fund Advisors, Inc. | 57.016 | 526 | ||||||
| 2026-02-17 | 13F | Regal Investment Advisors LLC | 17.250 | 0,00 | 159 | 1,92 | ||||
| 2026-01-26 | 13F | Shaker Financial Services, LLC | 237.332 | -23,95 | 2.188 | -22,52 | ||||
| 2026-04-17 | 13F | Worth Asset Management, LLC | 15.870 | 0,00 | 139 | -4,79 | ||||
| 2026-04-17 | 13F | Vermillion Wealth Management, Inc. | 747 | -72,81 | 7 | -76,00 | ||||
| 2026-02-13 | 13F | Wells Fargo & Company/mn | 293.744 | -7,33 | 2.708 | -5,58 | ||||
| 2026-02-17 | 13F | Creative Planning | 38.719 | 21,61 | 358 | 23,88 | ||||
| 2026-02-12 | 13F | Steward Partners Investment Advisory, Llc | 104.528 | 1,26 | 964 | 3,10 | ||||
| 2026-04-07 | 13F | CoreCap Advisors, LLC | 3.150 | -61,35 | 28 | -64,00 | ||||
| 2026-02-12 | 13F | Kovack Advisors, Inc. | 55.067 | 510 | ||||||
| 2026-01-29 | 13F | Sanctuary Advisors, LLC | 13.322 | 0,24 | 123 | 1,67 | ||||
| 2026-02-17 | 13F | one8zero8, LLC | 69.900 | -0,71 | 644 | 1,10 | ||||
| 2026-04-08 | 13F | David J Yvars Group | 31.030 | 2,03 | 272 | -2,86 | ||||
| 2026-02-12 | 13F | Penserra Capital Management LLC | 792.677 | 10,20 | 7 | 16,67 | ||||
| 2025-11-10 | 13F | Colonial Trust Advisors | 0 | -100,00 | 0 | -100,00 | ||||
| 2026-02-12 | 13F | Advisors Asset Management, Inc. | 774.116 | 7,99 | 7.137 | 10,02 | ||||
| 2026-01-13 | 13F | Mather Group, Llc. | 0 | -100,00 | 0 | |||||
| 2026-02-09 | 13F | Blue Bell Private Wealth Management, Llc | 35.400 | 127,11 | 326 | 131,21 | ||||
| 2026-02-17 | 13F | Abel Hall, LLC | 10.000 | 0,00 | 92 | 2,22 | ||||
| 2026-02-17 | 13F | 1607 Capital Partners, LLC | 1.452.913 | 262,29 | 13.396 | 269,11 | ||||
| 2025-11-12 | 13F | Buckingham Strategic Partners | 0 | -100,00 | 0 | |||||
| 2026-02-11 | 13F | Jpmorgan Chase & Co | 220 | 0,00 | 2 | 100,00 | ||||
| 2026-02-03 | 13F | International Assets Investment Management, Llc | 158.318 | -1,52 | 1.460 | 4,81 | ||||
| 2026-04-23 | 13F | Shikiar Asset Management Inc | 45.100 | 0,00 | 0 | |||||
| 2026-02-12 | 13F | CIBC Private Wealth Group, LLC | 11.758 | 2,19 | 108 | 3,85 | ||||
| 2026-04-17 | 13F | Certified Advisory Corp | 22.161 | -2,15 | 195 | -6,73 | ||||
| 2026-02-13 | 13F | Arkadios Wealth Advisors | 97.703 | -1,05 | 901 | 0,78 | ||||
| 2026-02-10 | 13F | WCG Wealth Advisors LLC | 70.177 | 0,00 | 647 | 1,89 | ||||
| 2026-02-13 | 13F | Sofos Investments, Inc. | 1.495 | 0,00 | 14 | 0,00 | ||||
| 2026-02-13 | 13F | Mariner, LLC | 27.249 | -2,95 | 251 | -1,18 | ||||
| 2026-02-13 | 13F | Parkside Financial Bank & Trust | 4.500 | 0,00 | 41 | 2,50 | ||||
| 2026-02-17 | 13F | Susquehanna International Group, Llp | 22.565 | 112,22 | 208 | 116,67 | ||||
| 2026-01-27 | 13F | Busey Wealth Management | 11.113 | 0,00 | 102 | 2,00 | ||||
| 2026-02-17 | 13F | TCG Advisory Services, LLC | 19.275 | 0,00 | 178 | 1,72 | ||||
| 2026-02-13 | 13F | Change Path, LLC | 30.783 | -23,01 | 284 | -21,61 | ||||
| 2026-02-11 | 13F | Parallel Advisors, LLC | 1.139 | 2,15 | 11 | 0,00 | ||||
| 2026-04-10 | 13F | Winebrenner Capital Management Llc | 0 | -100,00 | 0 | |||||
| 2026-02-13 | 13F | Stifel Financial Corp | 126.877 | -1,05 | 1.170 | 0,78 | ||||
| 2026-02-13 | 13F | Morgan Stanley | 1.933.376 | 2,92 | 17.826 | 4,85 | ||||
| 2026-02-17 | 13F | Cape Investment Advisory, Inc. | 400 | 4 | ||||||
| 2025-11-04 | 13F | L.m. Kohn & Company | 0 | -100,00 | 0 | -100,00 | ||||
| 2026-01-21 | 13F | Flagship Harbor Advisors, Llc | 7.990 | 74 | ||||||
| 2026-02-17 | 13F | Private Advisor Group, LLC | 115.556 | 0,18 | 1.065 | 2,11 | ||||
| 2026-02-13 | 13F | Resources Investment Advisors, LLC. | 0 | -100,00 | 0 | |||||
| 2026-02-18 | 13F | GWM Advisors LLC | 70.022 | 1,13 | 646 | 3,04 | ||||
| 2026-02-17 | 13F | Royal Bank Of Canada | 950.732 | 1,60 | 8.765 | 3,51 | ||||
| 2026-01-28 | 13F | Joseph P. Lucia & Associates, LLC | 52.790 | -5,47 | 487 | -3,76 | ||||
| 2026-01-15 | 13F | Bernard Wealth Management Corp. | 205 | 0,00 | 2 | 0,00 | ||||
| 2026-02-12 | 13F | Commonwealth Equity Services, Llc | 79.275 | 39,83 | 731 | |||||
| 2026-02-13 | 13F | Jacobi Capital Management LLC | 28.344 | -6,01 | 261 | -4,04 | ||||
| 2026-02-13 | 13F | Centaurus Financial, Inc. | 48.022 | 5,54 | 0 | |||||
| 2026-02-17 | 13F | Cresset Asset Management, LLC | 537.519 | -0,96 | 4.956 | 0,90 | ||||
| 2026-02-09 | 13F | Strategic Financial Concepts, LLC | 0 | -100,00 | 0 | -100,00 | ||||
| 2026-02-13 | 13F | Landscape Capital Management, L.l.c. | 18.612 | 172 | ||||||
| 2026-02-17 | 13F | Ameriflex Group, Inc. | 525 | -50,00 | 5 | -55,56 | ||||
| 2025-11-14 | 13F | Citadel Advisors Llc | 0 | -100,00 | 0 | -100,00 | ||||
| 2026-02-17 | 13F | Advisory Services Network, LLC | 0 | -100,00 | 0 | -100,00 | ||||
| 2026-04-24 | 13F | Investment Management Trust, LLC | 20.150 | 177 | ||||||
| 2026-01-09 | 13F | Capital CS Group, LLC | 21.250 | 1,99 | 196 | 3,72 | ||||
| 2026-02-13 | 13F | Integrated Wealth Concepts LLC | 10.502 | -7,24 | 97 | -5,88 | ||||
| 2026-02-13 | 13F | Commerce Bank | 18.115 | 0,00 | 167 | 2,45 | ||||
| 2026-01-20 | 13F | Investment Planning Advisors, Inc. | 0 | -100,00 | 0 | |||||
| 2026-02-13 | 13F | Kilter Group LLC | 1.564 | 2,22 | 14 | 7,69 | ||||
| 2026-02-17 | 13F | Raymond James Financial Inc | 1.595.778 | 4,63 | 14.713 | 6,60 | ||||
| 2026-04-22 | 13F | Janney Montgomery Scott LLC | 24.127 | 3,32 | 0 | |||||
| 2026-02-04 | 13F | Tsfg, Llc | 1.154 | 2,21 | 0 | |||||
| 2026-04-23 | 13F | Oppenheimer & Co Inc | 49.662 | -1,19 | 436 | -5,83 | ||||
| 2026-01-29 | 13F | UBS Group AG | 478.291 | -7,44 | 4.410 | -5,71 | ||||
| 2026-02-02 | 13F | Wolverine Asset Management Llc | 259.302 | 685,19 | 2.391 | 702,01 | ||||
| 2026-02-13 | 13F | SRS Capital Advisors, Inc. | 2.000 | 0,00 | 18 | 0,00 | ||||
| 2026-02-11 | 13F | Alteri Wealth LLC | 55.885 | -3,31 | 515 | -1,53 | ||||
| 2026-04-22 | 13F | Fearless Solutions, LLC dba Best Invest | 13.526 | 0,00 | 119 | -4,84 | ||||
| 2026-04-24 | 13F | Medallion Wealth Advisors, LLC | 56.719 | 0,73 | 498 | -4,24 | ||||
| 2026-02-17 | 13F | National Asset Management, Inc. | 46.635 | 0,12 | 430 | 1,90 | ||||
| 2026-01-29 | 13F | Camelot Portfolios, LLC | 45.400 | 0,00 | 419 | 1,95 | ||||
| 2026-02-06 | 13F | VSM Wealth Advisory, LLC | 0 | -100,00 | 0 | |||||
| 2026-01-08 | 13F | Integrated Capital Management, Inc. | 46.097 | 27,41 | 425 | 29,97 | ||||
| 2026-02-05 | 13F | Cambridge Investment Research Advisors, Inc. | 180.884 | -2,92 | 2 | 0,00 | ||||
| 2026-01-14 | 13F | Quad-Cities Investment Group, LLC | 0 | -100,00 | 0 | -100,00 | ||||
| 2026-04-20 | 13F | Sowell Financial Services LLC | 17.881 | 2,19 | 157 | -3,11 | ||||
| 2026-04-14 | 13F | Nbc Securities, Inc. | 14.269 | 0,00 | 125 | -4,58 | ||||
| 2026-04-22 | 13F | Youngs Advisory Group, Inc. | 50.600 | 0,00 | 444 | -4,72 | ||||
| 2026-04-13 | 13F | Cyndeo Wealth Partners, LLC | 17.000 | 0,00 | 149 | -4,49 | ||||
| 2026-04-07 | 13F | Park Avenue Securities Llc | 207.661 | 3,65 | 2 | 0,00 | ||||
| 2026-02-17 | 13F | Wiley Bros.-aintree Capital, Llc | 11.198 | 3,69 | 103 | 6,19 | ||||
| 2026-02-19 | 13F | TMB Capital Partners, LLC | 12.110 | 112 | ||||||
| 2026-02-13 | 13F | Karpus Management, Inc. | 0 | -100,00 | 0 | |||||
| 2026-02-13 | 13F | MAI Capital Management | 9.127 | 2,19 | 84 | 5,00 | ||||
| 2026-04-21 | 13F | Claro Advisors LLC | 30.472 | -2,53 | 268 | -7,29 | ||||
| 2026-04-07 | 13F | Farther Finance Advisors, LLC | 407 | 0,00 | 4 | 0,00 | ||||
| 2026-02-17 | 13F | Two Sigma Investments, Lp | 146.819 | -46,89 | 1.354 | -45,90 | ||||
| 2026-02-10 | 13F/A | LVZ Advisors, Inc. | 15.490 | 0,00 | 143 | 1,43 | ||||
| 2026-02-14 | 13F | Rockefeller Capital Management L.P. | 291.291 | 6,94 | 2.686 | 8,92 | ||||
| 2026-02-17 | 13F | Mercer Global Advisors Inc /adv | 74.202 | 684 | ||||||
| 2025-10-28 | 13F | Sharp Financial Services, LLC | 0 | -100,00 | 0 | -100,00 | ||||
| 2026-02-11 | 13F | Franklin Resources Inc | 260.849 | 1,76 | 2.405 | 3,71 | ||||
| 2026-04-23 | 13F | Harbor Investment Advisory, Llc | 1.925 | 0,00 | 17 | -5,88 | ||||
| 2026-04-20 | 13F | Heritage Wealth Management, Inc. | 22.360 | -22,60 | 196 | -26,32 | ||||
| 2026-02-13 | 13F | Kestra Advisory Services, LLC | 0 | -100,00 | 0 | |||||
| 2026-02-02 | 13F | Truist Financial Corp | 21.712 | -11,31 | 200 | -9,50 | ||||
| 2026-02-13 | 13F | Colony Group, LLC | 16.349 | 151 | ||||||
| 2026-01-26 | 13F | Private Trust Co Na | 5.500 | 0,00 | 51 | 2,04 | ||||
| 2026-02-09 | 13F | Kingsview Wealth Management, LLC | 11.359 | -5,44 | 105 | -3,70 | ||||
| 2026-02-17 | 13F | Modern Wealth Management, LLC | 18.853 | 0,26 | 174 | 1,76 | ||||
| 2026-02-17 | 13F | Cetera Investment Advisers | 150.290 | 3,13 | 1.386 | 5,08 | ||||
| 2026-04-21 | 13F | Decker Retirement Planning Inc. | 200 | 1.900,00 | 2 | |||||
| 2026-02-04 | 13F | Financial Alternatives, Inc | 12.466 | 0,00 | 115 | 1,79 | ||||
| 2026-02-19 | 13F | Invesco Ltd. | 1.590.547 | -4,40 | 14.665 | -2,60 | ||||
| 2026-04-15 | 13F | DAVENPORT & Co LLC | 15.020 | 0,00 | 132 | -5,07 | ||||
| 2026-01-26 | 13F | Whittier Trust Co Of Nevada Inc | 335 | 0,00 | 3 | 0,00 | ||||
| 2025-11-19 | 13F | Captrust Financial Advisors | 0 | -100,00 | 0 | -100,00 | ||||
| 2026-04-20 | 13F | Kestra Private Wealth Services, Llc | 26.190 | 0,61 | 230 | -4,58 | ||||
| 2026-02-17 | 13F | Tower Research Capital LLC (TRC) | 4 | 0 | ||||||
| 2026-02-04 | 13F | Ameritas Advisory Services, LLC | 10.690 | -5,41 | 99 | -3,92 | ||||
| 2026-01-13 | 13F | Dakota Wealth Management | 50.030 | -1,96 | 461 | 0,00 | ||||
| 2026-02-06 | 13F | HighTower Advisors, LLC | 55.672 | -8,48 | 513 | -6,73 | ||||
| 2025-10-27 | 13F | Ashton Thomas Securities, Llc | 0 | -100,00 | 0 | -100,00 | ||||
| 2026-02-13 | 13F | Saxon Interests, Inc. | 36.257 | -3,28 | 334 | -0,89 | ||||
| 2026-02-03 | 13F | Indivisible Partners | 69.232 | 638 | ||||||
| 2026-02-10 | 13F | Lido Advisors, LLC | 50.000 | 0,00 | 452 | 0,00 | ||||
| 2026-01-28 | 13F | Cornerstone Advisory, LLC | 20.053 | 0,66 | 185 | 2,22 | ||||
| 2026-01-06 | 13F | Tucker Asset Management Llc | 0 | -100,00 | 0 | |||||
| 2026-02-06 | 13F | CFO4Life Group, LLC | 14.534 | 2,19 | 134 | 4,69 | ||||
| 2026-02-04 | 13F | Atlantic Union Bankshares Corp | 500 | 5 | ||||||
| 2026-04-22 | 13F | Caldwell Trust Co | 720 | 0,00 | 6 | 0,00 | ||||
| 2025-11-12 | 13F | CIBC Bancorp USA Inc. | 11.506 | 104 | ||||||
| 2026-01-28 | 13F | Diversified Enterprises, LLC | 20.465 | 0,70 | 189 | 2,73 | ||||
| 2026-02-04 | 13F | Twin Lakes Capital Management, LLC | 39.129 | 2,19 | 361 | 4,05 | ||||
| 2026-02-13 | 13F | Mml Investors Services, Llc | 40.272 | 20,84 | 371 | 23,26 | ||||
| 2026-01-23 | 13F | Tyche Wealth Partners LLC | 11.464 | 0,00 | 106 | 1,94 | ||||
| 2026-02-10 | 13F/A | Northwestern Mutual Wealth Management Co | 32.322 | -3,29 | 298 | -1,32 | ||||
| 2026-02-17 | 13F | Jones Financial Companies Lllp | 0 | -100,00 | 0 | |||||
| 2026-02-09 | 13F | Keating Financial Advisory Services, Inc. | 2.162 | 20 | ||||||
| 2026-01-28 | 13F | West Michigan Advisors, Llc | 12.865 | 0,00 | 119 | 1,72 | ||||
| 2026-02-17 | 13F | IHT Wealth Management, LLC | 12.049 | 0,00 | 111 | 1,83 | ||||
| 2026-01-30 | 13F | Us Bancorp \de\ | 0 | -100,00 | 0 | |||||
| 2026-02-12 | 13F | Jane Street Group, Llc | 118.069 | 130,35 | 1.089 | 134,99 | ||||
| 2026-01-29 | 13F | Comerica Bank | 18.527 | -4,72 | 171 | -2,86 | ||||
| 2025-11-14 | 13F | Balyasny Asset Management Llc | 0 | -100,00 | 0 | -100,00 | ||||
| 2026-02-17 | 13F | Ameriprise Financial Inc | 465.480 | -0,17 | 4.292 | 1,56 | ||||
| 2026-02-13 | 13F | Hurley Capital, LLC | 0 | -100,00 | 0 | |||||
| 2025-11-04 | 13F | Guerra Advisors Inc | 420 | 4 | ||||||
| 2026-04-16 | 13F | Annex Advisory Services, LLC | 24.004 | 0,00 | 211 | -4,98 | ||||
| 2026-02-17 | 13F | Logan Stone Capital, LLC | 80.471 | 742 | ||||||
| 2026-02-10 | 13F | Envestnet Asset Management Inc | 260.341 | 18,87 | 2.400 | 21,09 | ||||
| 2026-02-17 | 13F | Saba Capital Management, L.P. | 438.995 | 2.821,57 | 4.048 | 2.897,78 | ||||
| 2026-01-29 | 13F | Calamos Advisors LLC | 118.103 | 85,95 | 1.089 | 89,55 | ||||
| 2026-01-15 | 13F | Allspring Global Investments Holdings, LLC | 17.284 | 0,00 | 159 | 1,92 | ||||
| 2026-01-20 | 13F | SOA Wealth Advisors, LLC. | 665 | 2,15 | 6 | 20,00 | ||||
| 2025-11-14 | 13F | Cnh Partners Llc | 0 | -100,00 | 0 | -100,00 | ||||
| 2026-02-05 | 13F | Allworth Financial LP | 60.797 | 0,61 | 561 | 2,56 | ||||
| 2026-03-03 | 13F | NWF Advisory Services Inc. | 13.600 | -59,52 | 125 | -58,88 | ||||
| 2026-02-11 | 13F | Cerity Partners LLC | 19.450 | 0,00 | 179 | 1,70 | ||||
| 2026-04-21 | 13F | Decision Investments, Inc | 21.530 | 0,19 | 189 | -4,55 | ||||
| 2026-04-22 | 13F | Pinnacle Bancorp, Inc. | 780 | 0,00 | 7 | -14,29 | ||||
| 2025-11-14 | 13F | Quantedge Capital Pte Ltd | 0 | -100,00 | 0 | -100,00 | ||||
| 2026-02-17 | 13F | Readystate Asset Management Lp | 82.764 | 763 | ||||||
| 2026-01-20 | 13F | Stratos Wealth Advisors, LLC | 23.000 | 0,00 | 212 | 1,92 |