Grundlæggende statistik
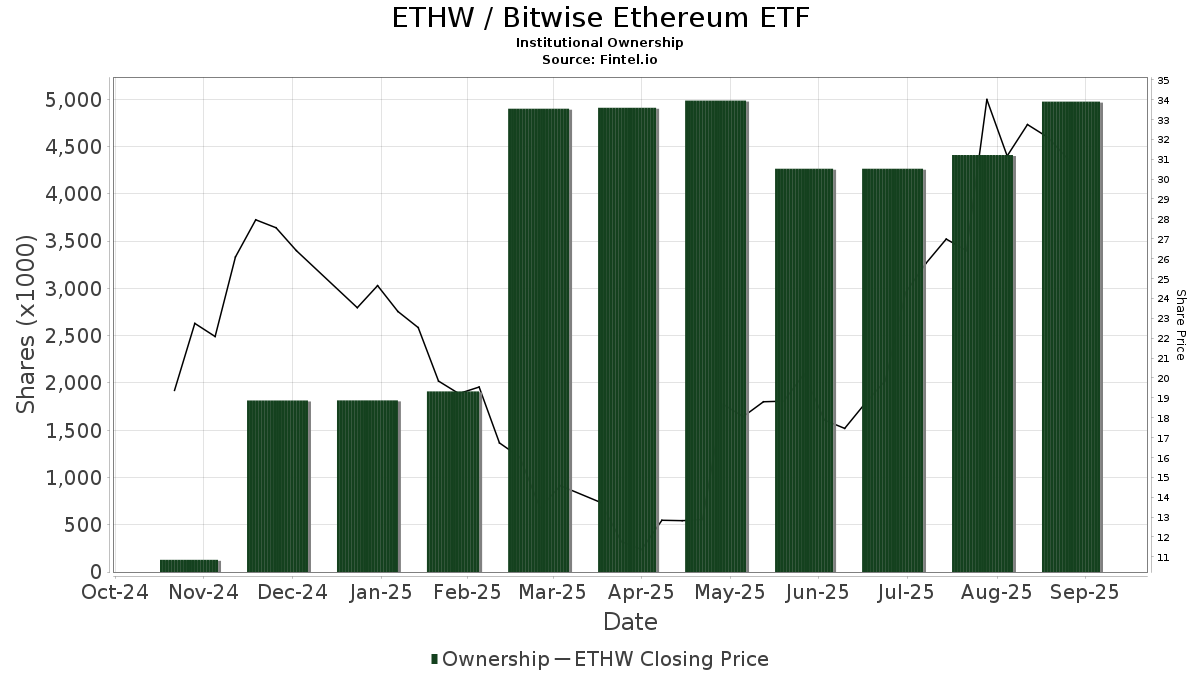
| Institutionelle ejere | 92 total, 90 long only, 0 short only, 2 long/short - change of 5,75% MRQ |
| Gennemsnitlig porteføljeallokering | 0.0691 % - change of -33,86% MRQ |
| Institutionelle aktier (lange) | 3.639.475 (ex 13D/G) - change of -0,47MM shares -11,54% MRQ |
| Institutionel værdi (lang) | $ 73.985 USD ($1000) |
Institutionelt ejerskab og aktionærer
Bitwise Ethereum ETF (US:ETHW) har 92 institutionelle ejere og aktionærer, der har indsendt 13D/G- eller 13F-formularer til Securities Exchange Commission (SEC). Disse institutioner har i alt 3,639,475 aktier. Største aktionærer omfatter Hbk Investments L P, Quadrature Capital Ltd, Jane Street Group, Llc, BEAM Asset Management, LLC, Wells Fargo & Company/mn, Clear Creek Financial Management, LLC, Colony Group, LLC, Millennium Management Llc, Betterment LLC, and Ieq Capital, Llc .
Bitwise Ethereum ETF (ARCA:ETHW) institutionel ejerskabsstruktur viser aktuelle positioner i virksomheden efter institutioner og fonde, samt seneste ændringer i positionsstørrelse. Større aktionærer kan omfatte individuelle investorer, investeringsforeninger, hedgefonde eller institutioner. Skema 13D angiver, at investoren besidder (eller besidder) mere end 5 % af virksomheden og har til hensigt (eller har til hensigt at) aktivt at forfølge en ændring i forretningsstrategi. Skema 13G indikerer en passiv investering på over 5%.
The share price as of March 31, 2026 is 15,00 / share. Previously, on April 1, 2025, the share price was 13,69 / share. This represents an increase of 9,57% over that period.
Fondens stemningsscore
Fund Sentiment Score (fka Ownership Accumulation Score) finder de aktier, der bliver mest købt af fonde. Det er resultatet af en sofistikeret, multi-faktor kvantitativ model, der identificerer virksomheder med de højeste niveauer af institutionel akkumulering. Scoringsmodellen bruger en kombination af den samlede stigning i oplyste ejere, ændringerne i porteføljeallokeringer i disse ejere og andre målinger. Tallet går fra 0 til 100, hvor højere tal indikerer et højere niveau af akkumulering for sine jævnaldrende, og 50 er gennemsnittet.
Opdateringsfrekvens: Dagligt
Se Ownership Explorer, som giver en liste over højest rangerende virksomheder.
AI+ Ask Fintel’s AI assistant about Bitwise Ethereum ETF.
Select a question to share a public post with an AI-crafted answer.
Thinking of good questions…
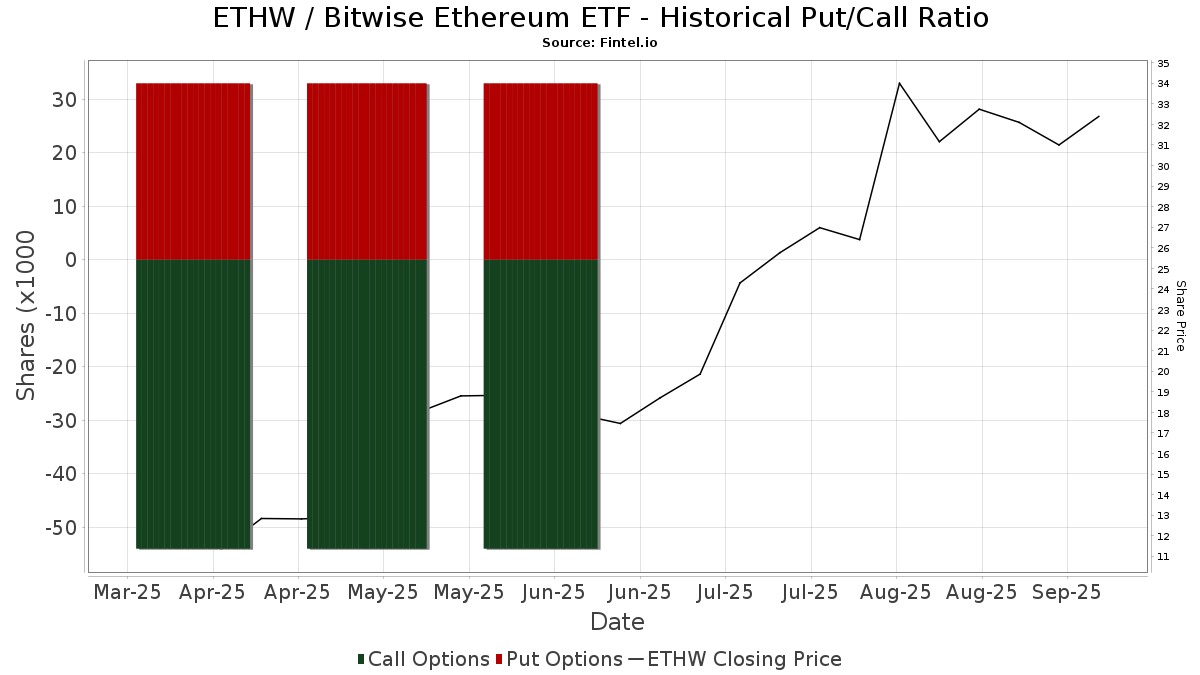
Institutionel Put/Call-forhold
Ud over at indberette standardaktie- og gældsudstedelser skal institutter med mere end 100 mill. aktiver under forvaltning også oplyse deres put- og call-optionsbeholdninger. Da salgsoptioner generelt indikerer negativ stemning, og købsoptioner indikerer positiv stemning, kan vi få en fornemmelse af den overordnede institutionelle stemning ved at plotte forholdet mellem put og kald. Diagrammet til højre viser det historiske put/call-forhold for dette instrument.
Brug af Put/Call Ratio som en indikator for investorernes stemning overvinder en af de vigtigste mangler ved at bruge totalt institutionelt ejerskab, som er, at en betydelig mængde af aktiver under forvaltning investeres passivt for at spore indekser. Passivt forvaltede fonde køber typisk ikke optioner, så indikatoren for put/call-forholdet følger mere nøje følelsen af aktivt forvaltede fonde.
13F og NPORT arkivering
Detaljer om 13F-arkivering er gratis. Detaljer om NP-ansøgninger kræver et premium-medlemskab. Grønne rækker angiver nye positioner. Røde rækker angiver lukkede positioner. Klik på linket ikon for at se den fulde transaktionshistorik.
Opgrader
for at låse premium-data op og eksportere til Excel ![]() .
.
| Fil dato | Kilde | Investor | Type | Gennemsnitlig pris (Øst) |
Aktier | Δ Aktier (%) |
Rapporteret Værdi ($1000) |
Δ Værdi (%) |
Port Alloc (%) |
|
|---|---|---|---|---|---|---|---|---|---|---|
| 2026-01-06 | 13F | Unique Wealth, Llc | 51.897 | 47,99 | 1.104 | 5,55 | ||||
| 2026-02-10 | 13F | Envestnet Asset Management Inc | 17.313 | 5,86 | 368 | -24,44 | ||||
| 2026-02-13 | 13F | Ieq Capital, Llc | 105.927 | 25,27 | 2.253 | -10,63 | ||||
| 2026-02-17 | 13F | Susquehanna International Group, Llp | Put | 15.200 | -52,94 | 323 | -66,46 | |||
| 2026-02-17 | 13F | Susquehanna International Group, Llp | Call | 91.300 | 7,16 | 1.942 | -23,58 | |||
| 2026-02-13 | 13F | Sofos Investments, Inc. | 0 | -100,00 | 0 | |||||
| 2026-02-13 | 13F | Colony Group, LLC | 145.485 | 3.094 | ||||||
| 2026-01-21 | 13F | Future Financial Wealth Managment LLC | 0 | -100,00 | 0 | |||||
| 2026-01-30 | 13F | Exencial Wealth Advisors, Llc | 0 | -100,00 | 0 | |||||
| 2026-02-10 | 13F | Meitav Dash Investments Ltd | 50.490 | 12,04 | 1.074 | -20,10 | ||||
| 2026-02-17 | 13F | Jump Financial, LLC | 0 | -100,00 | 0 | |||||
| 2026-02-05 | 13F | Atria Investments Llc | 32.453 | 36,21 | 690 | -2,82 | ||||
| 2026-02-13 | 13F | MAI Capital Management | 2.133 | 0,00 | 45 | -28,57 | ||||
| 2026-02-13 | 13F | Change Path, LLC | 15.886 | 27,66 | 338 | -9,16 | ||||
| 2026-02-12 | 13F | Betterment LLC | 124.386 | 0,60 | 3 | -33,33 | ||||
| 2026-02-12 | 13F | Summit Financial, LLC | 0 | -100,00 | 0 | |||||
| 2026-02-17 | 13F | Hbk Investments L P | 833.682 | 0,00 | 17.732 | -28,67 | ||||
| 2026-02-05 | 13F | Beese Fulmer Investment Management, Inc. | 0 | -100,00 | 0 | |||||
| 2026-02-12 | 13F | JPL Wealth Management, LLC | 0 | -100,00 | 0 | |||||
| 2026-02-12 | 13F | Moneta Group Investment Advisors Llc | 21.612 | 77,66 | 460 | 26,80 | ||||
| 2026-02-10 | 13F | Exit Wealth Advisors, LLC. | 0 | -100,00 | 0 | |||||
| 2026-02-17 | 13F | DV Trading LLC | 554 | 12 | ||||||
| 2026-01-14 | 13F | Q Fund Management (Hong Kong) Ltd | 35.000 | 0,00 | 744 | -28,67 | ||||
| 2026-01-23 | 13F | Twelve Points Wealth Management LLC | 17.420 | 152,46 | 383 | 86,34 | ||||
| 2026-02-23 | 13F | Beaird Harris Wealth Management, LLC | 1.067 | 0,00 | 23 | -29,03 | ||||
| 2026-02-10 | 13F | Fielder Capital Group LLC | 18.617 | 0,00 | 396 | -28,83 | ||||
| 2026-02-27 | 13F/A | Pantera Capital Partners LP | 0 | -100,00 | 0 | |||||
| 2026-02-13 | 13F | Kestra Advisory Services, LLC | 5.374 | 114 | ||||||
| 2026-02-06 | 13F | Daviman Financial, LLC | 13.001 | 277 | ||||||
| 2026-02-10 | 13F | Spectrum Planning & Advisory Services Inc. | 11.367 | 0,00 | 242 | -28,70 | ||||
| 2026-01-27 | 13F | Institute for Wealth Management, LLC. | 12.724 | 271 | ||||||
| 2026-01-28 | 13F | Quaker Wealth Management, LLC | 925 | -91,10 | 20 | -93,85 | ||||
| 2026-02-03 | 13F | Brandywine Oak Private Wealth Llc | 27.223 | -4,04 | 579 | -31,48 | ||||
| 2026-01-29 | 13F | Sanctuary Advisors, LLC | 23.797 | 8,56 | 506 | -22,51 | ||||
| 2026-01-23 | 13F | Brown Miller Wealth Management, LLC | 21.069 | 448 | ||||||
| 2026-02-13 | 13F | Arete Wealth Advisors, LLC | 24.223 | -6,63 | 1 | |||||
| 2026-02-17 | 13F | Citadel Advisors Llc | Call | 85.500 | -29,80 | 1.819 | -49,94 | |||
| 2026-01-07 | 13F | CWA Asset Management Group, LLC | 56.763 | 1.207 | ||||||
| 2026-02-05 | 13F | Cambridge Investment Research Advisors, Inc. | 13.712 | 13,94 | 0 | |||||
| 2026-02-12 | 13F | Hollencrest Capital Management | 508 | 150,25 | 11 | 66,67 | ||||
| 2026-02-06 | 13F | Larson Financial Group LLC | 300 | 15,38 | 6 | -14,29 | ||||
| 2026-01-08 | 13F | Wealth Enhancement Advisory Services, Llc | 18.309 | 32,27 | 425 | -4,28 | ||||
| 2026-01-23 | 13F | Farther Finance Advisors, LLC | 433 | 8,25 | 9 | -18,18 | ||||
| 2025-11-14 | 13F | Northwestern Mutual Wealth Management Co | 0 | -100,00 | 0 | -100,00 | ||||
| 2025-11-14 | 13F | Wolverine Trading, Llc | 10.624 | 319 | ||||||
| 2026-02-05 | 13F | Soltis Investment Advisors LLC | 77.236 | 27,79 | 1.643 | -8,88 | ||||
| 2025-11-14 | 13F | Wolverine Trading, Llc | Call | 32.300 | 971 | |||||
| 2026-01-22 | 13F | Columbia Advisory Partners Llc | 11.067 | 235 | ||||||
| 2026-02-13 | 13F | SRS Capital Advisors, Inc. | 12.607 | 2.670,77 | 268 | 1.961,54 | ||||
| 2026-02-10 | 13F | Rothschild Investment Llc | 9.000 | 0,00 | 191 | -28,73 | ||||
| 2026-02-12 | 13F | Brinker Capital Investments, LLC | 25.517 | -5,58 | 543 | -32,67 | ||||
| 2026-02-13 | 13F | Morgan Stanley | 260 | 6 | ||||||
| 2026-02-17 | 13F | Schonfeld Strategic Advisors LLC | 0 | -100,00 | 0 | |||||
| 2026-02-17 | 13F | Citadel Advisors Llc | Put | 17.900 | -10,50 | 381 | -36,24 | |||
| 2026-02-17 | 13F | Citadel Advisors Llc | 65.374 | 8,09 | 1.391 | -22,91 | ||||
| 2026-01-23 | 13F | Clear Creek Financial Management, LLC | 148.540 | 30,07 | 3.159 | -7,22 | ||||
| 2025-11-14 | 13F | Old Mission Capital Llc | 0 | -100,00 | 0 | -100,00 | ||||
| 2025-11-14 | 13F | Elequin Capital Lp | 0 | -100,00 | 0 | -100,00 | ||||
| 2026-02-05 | 13F | Mason & Associates Inc | 0 | -100,00 | 0 | |||||
| 2026-02-13 | 13F | Mml Investors Services, Llc | 16.622 | 4,96 | 354 | -25,21 | ||||
| 2026-02-17 | 13F | Claro Advisors LLC | 62.648 | 0,19 | 1.333 | -28,54 | ||||
| 2026-01-12 | 13F | Abound Wealth Management | 200 | 4 | ||||||
| 2026-02-12 | 13F | Renaissance Technologies Llc | 87.100 | 1.853 | ||||||
| 2026-02-17 | 13F | Tower Research Capital LLC (TRC) | 0 | -100,00 | 0 | |||||
| 2026-02-04 | 13F | Concentrum Wealth Management | 20.440 | 435 | ||||||
| 2026-02-12 | 13F | ROSS\JOHNSON & Associates LLC | 1.500 | 0,00 | 32 | -29,55 | ||||
| 2026-01-20 | 13F | Thurston, Springer, Miller, Herd & Titak, Inc. | 420 | 9 | ||||||
| 2026-02-17 | 13F | Rpo Llc | 0 | -100,00 | 0 | |||||
| 2026-02-23 | 13F | Virtu Financial LLC | 0 | -100,00 | 0 | |||||
| 2025-11-14 | 13F | Raymond James Financial Inc | 0 | -100,00 | 0 | -100,00 | ||||
| 2026-02-17 | 13F | Advisor Group Holdings, Inc. | 3.272 | -10,77 | 70 | -36,70 | ||||
| 2026-01-23 | 13F | Optima Capital Llc | 27.383 | 90,29 | 582 | 35,66 | ||||
| 2026-02-06 | 13F | EverSource Wealth Advisors, LLC | 1.194 | 541,94 | 25 | 400,00 | ||||
| 2026-01-12 | 13F | Wiser Wealth Management, Inc | 60.413 | 22,72 | 1.285 | -12,47 | ||||
| 2026-02-17 | 13F | Bank Of America Corp /de/ | 0 | -100,00 | 0 | |||||
| 2026-02-10 | 13F | a16z Perennial Management, L.P. | 22.197 | 0,00 | 472 | -28,59 | ||||
| 2026-01-23 | 13F | U.S. Capital Wealth Advisors, LLC | 78.264 | 9,82 | 1.665 | -21,69 | ||||
| 2026-02-12 | 13F | Beacon Capital Management, Inc. | 55 | -79,85 | 1 | -87,50 | ||||
| 2026-02-17 | 13F | Millennium Management Llc | 143.949 | 0,00 | 3.062 | -28,68 | ||||
| 2025-11-14 | 13F | ParaFi Capital LP | 0 | -100,00 | 0 | -100,00 | ||||
| 2026-02-03 | 13F | McIlrath & Eck, LLC | 510 | 0,00 | 11 | -33,33 | ||||
| 2026-02-11 | 13F | Parallel Advisors, LLC | 778 | 17 | ||||||
| 2026-02-12 | 13F | Jane Street Group, Llc | Call | 216.600 | -1,19 | 4.607 | -29,51 | |||
| 2026-01-15 | 13F | Brookstone Capital Management | 15.550 | 19,32 | 331 | -14,95 | ||||
| 2025-12-29 | 13F | Cape Investment Advisory, Inc. | 0 | -100,00 | 0 | -100,00 | ||||
| 2026-02-06 | 13F | Evoke Wealth, Llc | 0 | -100,00 | 0 | |||||
| 2026-02-17 | 13F | Susquehanna International Group, Llp | 0 | -100,00 | 0 | |||||
| 2026-02-13 | 13F | Magnolia Capital Advisors Llc | 33.349 | 6,83 | 709 | -23,76 | ||||
| 2026-02-17 | 13F | Wealth Watch Advisors, INC | 232 | -96,41 | 5 | -97,92 | ||||
| 2026-01-26 | 13F | Cwm, Llc | 2.806 | 166,73 | 0 | |||||
| 2026-02-06 | 13F | HighTower Advisors, LLC | 12.158 | 31,45 | 259 | -6,18 | ||||
| 2026-02-17 | 13F | Quadrature Capital Ltd | 318.127 | 6.767 | ||||||
| 2026-01-29 | 13F | UMA Financial Services, Inc. | 475 | 0,00 | 10 | -28,57 | ||||
| 2026-01-26 | 13F | Consolidated Portfolio Review Corp | 0 | -100,00 | 0 | |||||
| 2026-01-28 | 13F | Geneos Wealth Management Inc. | 876 | 0,00 | 19 | -30,77 | ||||
| 2026-02-11 | 13F | Simplex Trading, Llc | 19.683 | -69,75 | 419 | 41.700,00 | ||||
| 2025-11-13 | 13F | Private Advisor Group, LLC | 0 | -100,00 | 0 | -100,00 | ||||
| 2026-02-11 | 13F | Group One Trading, L.p. | 108 | 2 | ||||||
| 2026-01-15 | 13F | Highline Wealth Partners Llc | 38.083 | 5,93 | 810 | -24,44 | ||||
| 2026-01-27 | 13F | Belpointe Asset Management LLC | 21.266 | -0,11 | 452 | -28,71 | ||||
| 2026-01-15 | 13F | OxenFree Capital LLC | 14.148 | 0,16 | 301 | -34,35 | ||||
| 2026-01-26 | 13F | Roman Butler Fullerton & Co | 13.813 | 38,60 | 290 | 4,32 | ||||
| 2026-02-17 | 13F | Hunting Hill Global Capital, LLC | 0 | -100,00 | 0 | |||||
| 2026-02-06 | 13F | IFP Advisors, Inc | 578 | 425,45 | 12 | 300,00 | ||||
| 2026-02-06 | 13F | Pnc Financial Services Group, Inc. | 455 | 0,00 | 10 | -30,77 | ||||
| 2026-02-09 | 13F | MRP Capital Investments, LLC | 6.145 | 131 | ||||||
| 2026-01-15 | 13F | Capital Advisors Inc/ok | 10.375 | 0,00 | 221 | -28,80 | ||||
| 2026-02-13 | 13F | Wells Fargo & Company/mn | 186.813 | 373.526,00 | 3.974 | 397.200,00 | ||||
| 2026-03-31 | 13F | Sankala Group LLC | 1.712 | -34,13 | 24 | -31,43 | ||||
| 2026-02-12 | 13F | Steward Partners Investment Advisory, Llc | 49.827 | -25,36 | 1.060 | -46,78 | ||||
| 2026-02-04 | 13F | BEAM Asset Management, LLC | 195.417 | 6,67 | 4.157 | -23,91 | ||||
| 2026-02-13 | 13F | Visionary Wealth Advisors | 10.535 | -4,46 | 224 | -31,71 | ||||
| 2026-02-12 | 13F | Ankerstar Wealth, LLC | 9.161 | 195 | ||||||
| 2026-02-11 | 13F | Jpmorgan Chase & Co | 1.942 | 41 | ||||||
| 2026-01-29 | 13F | IMC-Chicago, LLC | 0 | -100,00 | 0 | |||||
| 2026-01-30 | 13F | Us Bancorp \de\ | 461 | 10 | ||||||
| 2026-02-09 | 13F | Clearwater Capital Advisors, LLC | 19.406 | 33,34 | 413 | -5,07 | ||||
| 2026-02-17 | 13F | Cresset Asset Management, LLC | 16.284 | 66,86 | 346 | 18,90 | ||||
| 2026-01-21 | 13F | Sound Income Strategies, LLC | 1.358 | 32 | ||||||
| 2026-02-10 | 13F | Private Wealth Asset Management, LLC | 1.500 | 0,00 | 32 | -29,55 | ||||
| 2026-02-12 | 13F | Keel Point, LLC | 20.618 | -16,89 | 439 | -40,73 | ||||
| 2026-01-16 | 13F | Perigon Wealth Management, LLC | 23.656 | 0,00 | 503 | -28,65 | ||||
| 2026-01-23 | 13F | Shore Point Advisors, LLC | 0 | -100,00 | 0 | |||||
| 2026-01-15 | 13F | Lodestone Wealth Management LLC | 1.738 | 37 |