Grundlæggende statistik
| Institutionelle ejere | 94 total, 94 long only, 0 short only, 0 long/short - change of 2,15% MRQ |
| Gennemsnitlig porteføljeallokering | 0.0927 % - change of -1,91% MRQ |
| Institutionelle aktier (lange) | 8.169.593 (ex 13D/G) - change of 0,60MM shares 7,95% MRQ |
| Institutionel værdi (lang) | $ 90.684 USD ($1000) |
Institutionelt ejerskab og aktionærer
Eaton Vance Senior Floating-Rate Trust (US:EFR) har 94 institutionelle ejere og aktionærer, der har indsendt 13D/G- eller 13F-formularer til Securities Exchange Commission (SEC). Disse institutioner har i alt 8,169,593 aktier. Største aktionærer omfatter Morgan Stanley, Bank Of America Corp /de/, Guggenheim Capital Llc, Invesco Ltd., Advisors Asset Management, Inc., Polar Asset Management Partners Inc., Wells Fargo & Company/mn, Ameriprise Financial Inc, White Pine Capital Llc, and Cambridge Investment Research Advisors, Inc. .
Eaton Vance Senior Floating-Rate Trust (NYSE:EFR) institutionel ejerskabsstruktur viser aktuelle positioner i virksomheden efter institutioner og fonde, samt seneste ændringer i positionsstørrelse. Større aktionærer kan omfatte individuelle investorer, investeringsforeninger, hedgefonde eller institutioner. Skema 13D angiver, at investoren besidder (eller besidder) mere end 5 % af virksomheden og har til hensigt (eller har til hensigt at) aktivt at forfølge en ændring i forretningsstrategi. Skema 13G indikerer en passiv investering på over 5%.
The share price as of September 11, 2025 is 11,63 / share. Previously, on September 12, 2024, the share price was 12,74 / share. This represents a decline of 8,75% over that period.

Fondens stemningsscore
Fund Sentiment Score (fka Ownership Accumulation Score) finder de aktier, der bliver mest købt af fonde. Det er resultatet af en sofistikeret, multi-faktor kvantitativ model, der identificerer virksomheder med de højeste niveauer af institutionel akkumulering. Scoringsmodellen bruger en kombination af den samlede stigning i oplyste ejere, ændringerne i porteføljeallokeringer i disse ejere og andre målinger. Tallet går fra 0 til 100, hvor højere tal indikerer et højere niveau af akkumulering for sine jævnaldrende, og 50 er gennemsnittet.
Opdateringsfrekvens: Dagligt
Se Ownership Explorer, som giver en liste over højest rangerende virksomheder.
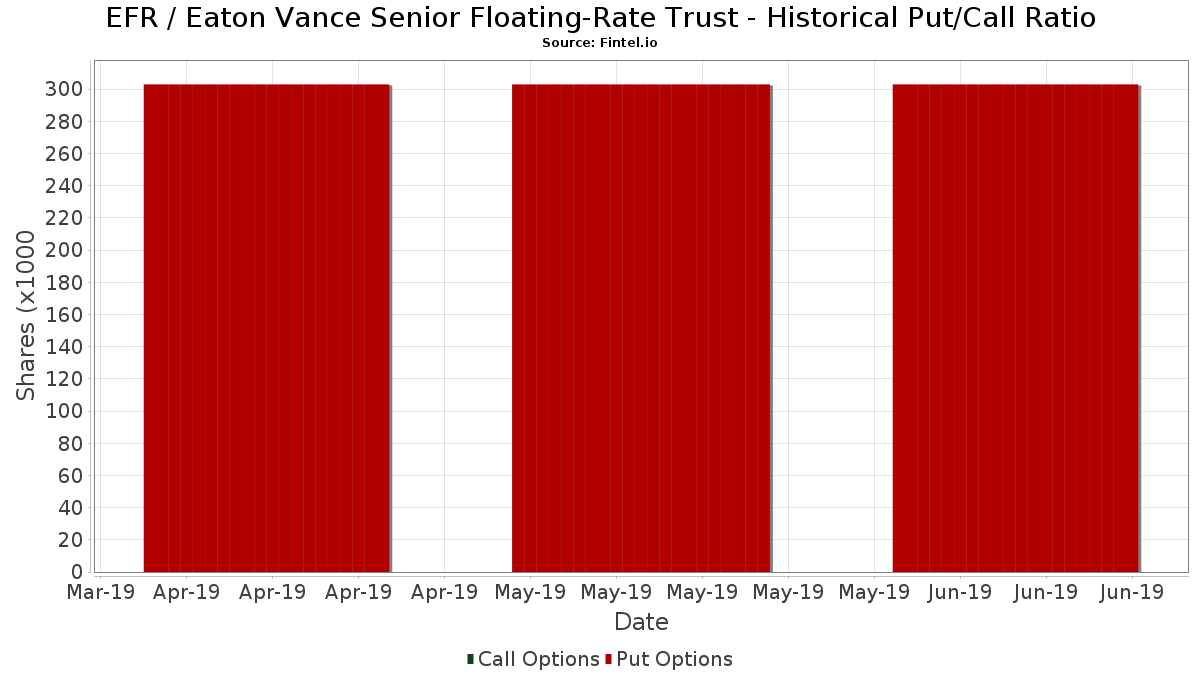
Institutionel Put/Call-forhold
Ud over at indberette standardaktie- og gældsudstedelser skal institutter med mere end 100 mill. aktiver under forvaltning også oplyse deres put- og call-optionsbeholdninger. Da salgsoptioner generelt indikerer negativ stemning, og købsoptioner indikerer positiv stemning, kan vi få en fornemmelse af den overordnede institutionelle stemning ved at plotte forholdet mellem put og kald. Diagrammet til højre viser det historiske put/call-forhold for dette instrument.
Brug af Put/Call Ratio som en indikator for investorernes stemning overvinder en af de vigtigste mangler ved at bruge totalt institutionelt ejerskab, som er, at en betydelig mængde af aktiver under forvaltning investeres passivt for at spore indekser. Passivt forvaltede fonde køber typisk ikke optioner, så indikatoren for put/call-forholdet følger mere nøje følelsen af aktivt forvaltede fonde.
13F og NPORT arkivering
Detaljer om 13F-arkivering er gratis. Detaljer om NP-ansøgninger kræver et premium-medlemskab. Grønne rækker angiver nye positioner. Røde rækker angiver lukkede positioner. Klik på linket ikon for at se den fulde transaktionshistorik.
Opgrader
for at låse premium-data op og eksportere til Excel ![]() .
.
| Fil dato | Kilde | Investor | Type | Gennemsnitlig pris (Øst) |
Aktier | Δ Aktier (%) |
Rapporteret Værdi ($1000) |
Δ Værdi (%) |
Port Alloc (%) |
|
|---|---|---|---|---|---|---|---|---|---|---|
| 2025-09-04 | 13F/A | Advisor Group Holdings, Inc. | 37.966 | 38,12 | 460 | 36,90 | ||||
| 2025-07-29 | 13F | Salomon & Ludwin, LLC | 1.600 | 0,00 | 20 | 0,00 | ||||
| 2025-07-21 | 13F | Future Financial Wealth Managment LLC | 800 | 0,00 | 10 | 0,00 | ||||
| 2025-07-21 | 13F | Barrett & Company, Inc. | 2.000 | 0,00 | 24 | 0,00 | ||||
| 2025-08-14 | 13F | Comerica Bank | 5.500 | 83,33 | 67 | 83,33 | ||||
| 2025-07-10 | 13F | Piscataqua Savings Bank | 1.586 | 0,00 | 19 | 0,00 | ||||
| 2025-08-06 | 13F | Atlantic Union Bankshares Corp | 20.500 | 248 | ||||||
| 2025-08-07 | 13F | Altman Advisors, Inc. | 55.924 | 5,23 | 554 | 8,43 | ||||
| 2025-08-13 | 13F | Baird Financial Group, Inc. | 126.878 | 1.538 | ||||||
| 2025-08-14 | 13F | Beaird Harris Wealth Management, LLC | 34.919 | 43,76 | 423 | 42,42 | ||||
| 2025-04-30 | 13F | Stratos Wealth Partners, LTD. | 0 | -100,00 | 0 | |||||
| 2025-06-12 | 13F/A | Deutsche Bank Ag\ | 0 | -100,00 | 0 | |||||
| 2025-08-13 | 13F | Virtus Investment Advisers, Inc. | 65.479 | -14,92 | 794 | -15,82 | ||||
| 2025-08-06 | 13F | Commonwealth Equity Services, Llc | 11.309 | 0,48 | 0 | |||||
| 2025-05-14 | 13F | Orion Portfolio Solutions, LLC | 12.189 | 0,00 | 156 | 0,00 | ||||
| 2025-08-06 | 13F | Prospera Financial Services Inc | 18.739 | 7,28 | 227 | 6,57 | ||||
| 2025-08-11 | 13F | Private Advisor Group, LLC | 18.285 | 0,00 | 222 | -0,90 | ||||
| 2025-08-01 | 13F | Brinker Capital Investments, LLC | 0 | -100,00 | 0 | -100,00 | ||||
| 2025-07-09 | 13F | Sandy Cove Advisors, LLC | 26.248 | 0,12 | 318 | -0,93 | ||||
| 2025-07-31 | 13F | Cambridge Investment Research Advisors, Inc. | 320.881 | -30,41 | 4 | -40,00 | ||||
| 2025-08-14 | 13F | Polar Asset Management Partners Inc. | 423.654 | 5.135 | ||||||
| 2025-08-14 | 13F | Wells Fargo & Company/mn | 421.663 | -7,98 | 5.111 | -8,96 | ||||
| 2025-08-07 | 13F | WESCAP Management Group, Inc. | 24.303 | -35,36 | 295 | -36,09 | ||||
| 2025-07-21 | 13F | AEGON USA Investment Management, LLC | 14.765 | 179 | ||||||
| 2025-08-08 | 13F | Kane Investment Management, Inc. | 0 | -100,00 | 0 | |||||
| 2025-08-13 | 13F | Guggenheim Capital Llc | 547.365 | -14,54 | 6.634 | -15,45 | ||||
| 2025-07-25 | 13F | Cwm, Llc | 155 | 2,65 | 0 | |||||
| 2025-05-05 | 13F | Carnegie Lake Advisors LLC | 0 | -100,00 | 0 | |||||
| 2025-05-13 | 13F | SFI Advisors, LLC | 0 | -100,00 | 0 | |||||
| 2025-06-25 | NP | VPC - Virtus Private Credit Strategy ETF | 70.300 | 7,41 | 839 | -3,79 | ||||
| 2025-07-10 | 13F | Wealth Enhancement Advisory Services, Llc | 14.831 | 0,00 | 180 | -0,55 | ||||
| 2025-07-14 | 13F | GAMMA Investing LLC | 63 | 1 | ||||||
| 2025-08-14 | 13F | Colony Group, LLC | 14.533 | 1,88 | 176 | 1,15 | ||||
| 2025-08-13 | 13F | Invesco Ltd. | 534.797 | 26,65 | 6.482 | 25,31 | ||||
| 2025-08-14 | 13F | Balyasny Asset Management Llc | 10.508 | 127 | ||||||
| 2025-08-08 | 13F | Larson Financial Group LLC | 86 | 2,38 | 1 | 0,00 | ||||
| 2025-08-12 | 13F | Proequities, Inc. | 0 | 0 | ||||||
| 2025-08-06 | 13F | Adviser Investments LLC | 56.925 | -7,10 | 690 | -8,13 | ||||
| 2025-08-14 | 13F | Ameriprise Financial Inc | 392.383 | -3,05 | 4.756 | -4,08 | ||||
| 2025-08-05 | 13F | GPS Wealth Strategies Group, LLC | 550 | 0,00 | 7 | 0,00 | ||||
| 2025-08-11 | 13F | Shufro Rose & Co Llc | 25.700 | -3,75 | 315 | -3,98 | ||||
| 2025-08-06 | 13F | Ethos Financial Group, LLC | 245.137 | 1,39 | 2.971 | 0,34 | ||||
| 2025-08-14 | 13F | Cardiff Park Advisors, Llc | 19.883 | 0,00 | 241 | -1,23 | ||||
| 2025-08-14 | 13F | Stifel Financial Corp | 11.194 | -4,10 | 136 | -4,93 | ||||
| 2025-08-04 | 13F | Wolverine Asset Management Llc | 77.840 | 216,63 | 943 | 213,29 | ||||
| 2025-08-05 | 13F | Sigma Planning Corp | 14.295 | 0,68 | 173 | 0,00 | ||||
| 2025-08-27 | NP | RYMSX - Guggenheim Multi-Hedge Strategies Fund Class P | 155 | 2 | ||||||
| 2025-08-15 | 13F | Tower Research Capital LLC (TRC) | 1 | -85,71 | 0 | |||||
| 2025-08-13 | 13F | Northwestern Mutual Wealth Management Co | 181.169 | 4,93 | 2.196 | 3,78 | ||||
| 2025-05-14 | 13F | Virtus ETF Advisers LLC | 0 | -100,00 | 0 | |||||
| 2025-08-14 | 13F | Royal Bank Of Canada | 21.243 | 4,94 | 257 | 3,63 | ||||
| 2025-08-13 | 13F | Garner Asset Management Corp | 57.672 | -10,22 | 699 | -11,20 | ||||
| 2025-05-12 | 13F | Sandy Spring Bank | 20.500 | 0,00 | 251 | -4,20 | ||||
| 2025-07-29 | 13F | Koshinski Asset Management, Inc. | 0 | -100,00 | 0 | |||||
| 2025-08-12 | 13F | Advisors Asset Management, Inc. | 526.438 | 5,78 | 6.380 | 4,66 | ||||
| 2025-07-31 | 13F | Oppenheimer & Co Inc | 30.143 | 8,17 | 365 | 7,04 | ||||
| 2025-08-14 | 13F | Synovus Financial Corp | 10.702 | 0,00 | 130 | -1,53 | ||||
| 2025-08-12 | 13F | Horizon Kinetics Asset Management Llc | 27.801 | 0,00 | 337 | -1,18 | ||||
| 2025-08-28 | NP | Cohen & Steers Closed-end Opportunity Fund, Inc. | 182.258 | 5,81 | 2.209 | 4,64 | ||||
| 2025-07-08 | 13F | Ballew Advisors, Inc | 30.148 | -16,15 | 367 | -11,17 | ||||
| 2025-08-27 | NP | RYDEX VARIABLE TRUST - Multi-Hedge Strategies Fund Variable Annuity | 260 | 3 | ||||||
| 2025-08-18 | 13F | Tactive Advisors, LLC | 0 | -100,00 | 0 | |||||
| 2025-08-07 | 13F | Montag A & Associates Inc | 4.929 | 0,00 | 60 | -1,67 | ||||
| 2025-08-07 | 13F | Allworth Financial LP | 1.600 | 0,00 | 19 | 5,56 | ||||
| 2025-08-12 | 13F | Steward Partners Investment Advisory, Llc | 8.450 | 3,05 | 102 | 2,00 | ||||
| 2025-08-08 | 13F | Avantax Advisory Services, Inc. | 16.696 | -44,19 | 202 | -44,81 | ||||
| 2025-07-29 | 13F | JTC Employer Solutions Trusteee Ltd | 7.000 | 0,00 | 0 | |||||
| 2025-08-05 | 13F | Dunhill Financial, LLC | 5.780 | -14,75 | 70 | -15,66 | ||||
| 2025-07-25 | 13F | Concurrent Investment Advisors, LLC | 14.917 | 0,00 | 181 | -1,10 | ||||
| 2025-07-08 | 13F | Nbc Securities, Inc. | 2.075 | -12,63 | 0 | |||||
| 2025-08-14 | 13F | Wiley Bros.-aintree Capital, Llc | 12.012 | -1,85 | 146 | -2,68 | ||||
| 2025-08-07 | 13F | Hennion & Walsh Asset Management, Inc. | 64.881 | -1,67 | 786 | -2,72 | ||||
| 2025-05-09 | 13F | CoreCap Advisors, LLC | 0 | -100,00 | 0 | |||||
| 2025-08-11 | 13F | Elequin Capital Lp | 0 | -100,00 | 0 | |||||
| 2025-08-12 | 13F | Financial Advocates Investment Management | 0 | -100,00 | 0 | |||||
| 2025-08-15 | 13F | Morgan Stanley | 903.652 | 42,60 | 10.952 | 41,08 | ||||
| 2025-08-05 | 13F | Verity Asset Management, Inc. | 125.230 | -0,55 | 1.518 | -1,62 | ||||
| 2025-07-21 | 13F | Ameriflex Group, Inc. | 0 | -100,00 | 0 | |||||
| 2025-04-18 | 13F | Edge Financial Advisors LLC | 0 | -100,00 | 0 | |||||
| 2025-07-21 | 13F | Ameritas Advisory Services, LLC | 749 | 9 | ||||||
| 2025-05-05 | 13F | Hollencrest Capital Management | 0 | -100,00 | 0 | -100,00 | ||||
| 2025-08-05 | 13F | Aviance Capital Partners, LLC | 10.937 | 0,00 | 133 | -0,75 | ||||
| 2025-07-22 | 13F | Fortitude Advisory Group L.L.C. | 18.613 | 0,00 | 226 | 5,63 | ||||
| 2025-08-13 | 13F | Collar Capital Management, LLC | 128.645 | 2,96 | 1.559 | 1,90 | ||||
| 2025-07-15 | 13F | Oregon Pacific Wealth Management, LLC | 27.841 | -2,99 | 337 | -3,99 | ||||
| 2025-07-29 | 13F | Oxbow Advisors, LLC | 11.600 | -23,18 | 141 | -23,91 | ||||
| 2025-07-28 | 13F | Harbour Investments, Inc. | 1.732 | 0,00 | 21 | -4,76 | ||||
| 2025-07-24 | 13F | Us Bancorp \de\ | 1.500 | 0,00 | 18 | 0,00 | ||||
| 2025-08-18 | 13F/A | National Bank Of Canada /fi/ | 2.619 | -27,63 | 32 | -29,55 | ||||
| 2025-08-13 | 13F/A | StoneX Group Inc. | 10.460 | 114 | ||||||
| 2025-05-15 | 13F | Citadel Advisors Llc | 0 | -100,00 | 0 | |||||
| 2025-07-17 | 13F/A | Capital Investment Advisors, LLC | 49.263 | -5,62 | 597 | -6,57 | ||||
| 2025-08-14 | 13F | Susquehanna International Group, Llp | 0 | -100,00 | 0 | |||||
| 2025-08-13 | 13F | Cerity Partners LLC | 0 | -100,00 | 0 | |||||
| 2025-08-08 | 13F | Marble Harbor Investment Counsel, LLC | 38.500 | -9,69 | 467 | -10,73 | ||||
| 2025-07-28 | NP | PCEF - Invesco CEF Income Composite ETF This fund is a listed as child fund of Invesco Ltd. and if that institution has disclosed ownership in this security, then these positions will not be double counted when calculating total shares and total value | 254.608 | 3,28 | 3.048 | -4,33 | ||||
| 2025-08-08 | 13F | Cetera Investment Advisers | 10.733 | 130 | ||||||
| 2025-08-14 | 13F | Raymond James Financial Inc | 52.793 | 12,45 | 640 | 11,13 | ||||
| 2025-08-14 | 13F | Advisor OS, LLC | 0 | -100,00 | 0 | |||||
| 2025-08-14 | 13F | Cohen & Steers, Inc. | 317.902 | 3,25 | 4 | 0,00 | ||||
| 2025-08-14 | 13F | IHT Wealth Management, LLC | 10.490 | 0,00 | 127 | -0,78 | ||||
| 2025-08-01 | 13F | Envestnet Asset Management Inc | 10.702 | 0,00 | 130 | -1,53 | ||||
| 2025-08-06 | 13F | Wedbush Securities Inc | 14.040 | -26,66 | 0 | |||||
| 2025-07-09 | 13F | Fiduciary Alliance LLC | 70.845 | 859 | ||||||
| 2025-08-12 | 13F | LPL Financial LLC | 107.521 | -37,84 | 1.303 | -38,48 | ||||
| 2025-07-30 | 13F | Cullen/frost Bankers, Inc. | 10.000 | 0,00 | 121 | -0,82 | ||||
| 2025-08-14 | 13F | Bank Of America Corp /de/ | 774.558 | -7,85 | 9.388 | -8,84 | ||||
| 2025-08-14 | 13F | UBS Group AG | 52.900 | -2,79 | 641 | -3,75 | ||||
| 2025-08-05 | 13F | Huntington National Bank | 0 | |||||||
| 2025-08-12 | 13F | White Pine Capital Llc | 340.910 | -0,40 | 4.132 | -1,48 | ||||
| 2025-08-07 | 13F | Readystate Asset Management Lp | 55.411 | 109,91 | 672 | 107,74 | ||||
| 2025-08-15 | 13F | CI Private Wealth, LLC | 12.361 | -8,38 | 150 | -9,70 | ||||
| 2025-08-12 | 13F | MAI Capital Management | 25.726 | 1,47 | 312 | 0,32 | ||||
| 2025-04-16 | 13F | Union Bancaire Privee, UBP SA | 0 | -100,00 | 0 | |||||
| 2025-08-05 | 13F | Shaker Financial Services, LLC | 36.766 | 446 | ||||||
| 2025-08-08 | 13F | Calamos Advisors LLC | 26.031 | 315 | ||||||
| 2025-08-12 | 13F | J.w. Cole Advisors, Inc. | 0 | -100,00 | 0 |