ECBK - ECB Bancorp, Inc. Aktie - Aktiekurs, institutionelt ejerskab, aktionærer (NasdaqCM)

ECB Bancorp, Inc.
US ˙ NasdaqCM ˙ US26828M1062

Grundlæggende statistik
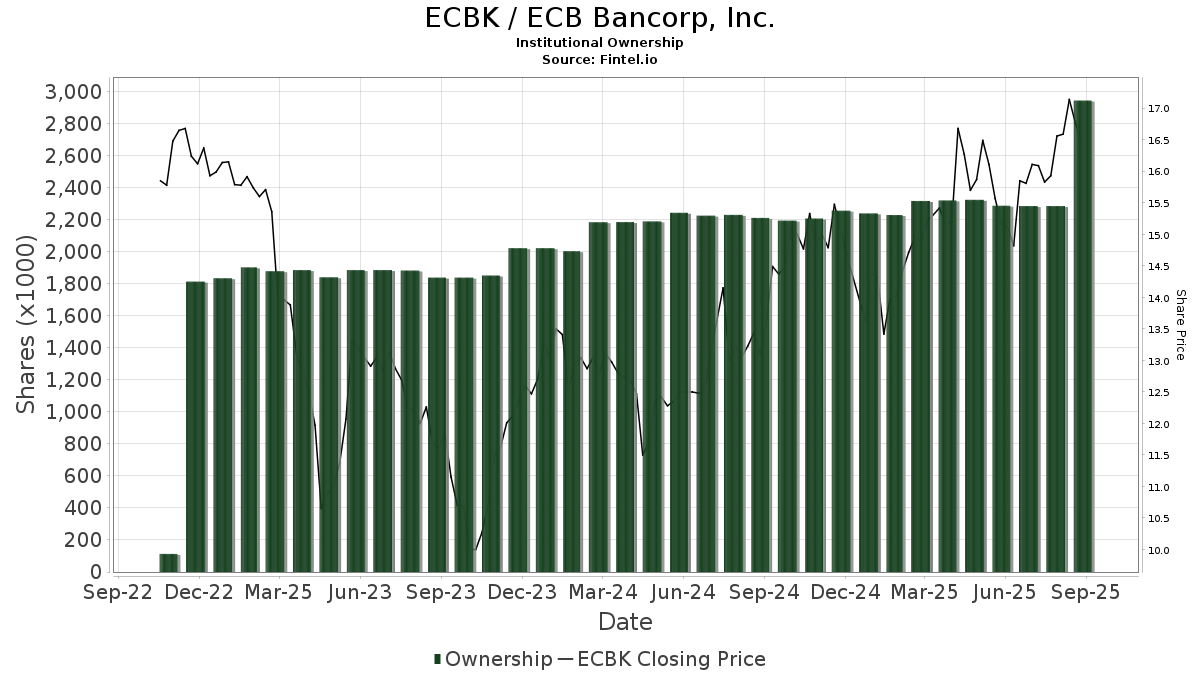
Institutionelle ejere 62 total, 62 long only, 0 short only, 0 long/short - change of -34,74% MRQ
Gennemsnitlig porteføljeallokering 0.0990 % - change of 298,67% MRQ
Deler fremragende shares (source: Capital IQ)
Institutionelle aktier (lange) 2.693.305 - 30,63% (ex 13D/G) - change of -0,15MM shares -5,38% MRQ
Institutionel værdi (lang) $ 46.762 USD ($1000)
Institutionelt ejerskab og aktionærer

ECB Bancorp, Inc. (US:ECBK) har 62 institutionelle ejere og aktionærer, der har indsendt 13D/G- eller 13F-formularer til Securities Exchange Commission (SEC). Disse institutioner har i alt 2,693,305 aktier. Største aktionærer omfatter Alliancebernstein L.p., Vanguard Group Inc, BlackRock, Inc., Geode Capital Management, Llc, Sachetta, LLC, Renaissance Technologies Llc, State Street Corp, FSSNX - Fidelity Small Cap Index Fund, Northern Trust Corp, and Oppenheimer & Close, LLC .

ECB Bancorp, Inc. (NasdaqCM:ECBK) institutionel ejerskabsstruktur viser aktuelle positioner i virksomheden efter institutioner og fonde, samt seneste ændringer i positionsstørrelse. Større aktionærer kan omfatte individuelle investorer, investeringsforeninger, hedgefonde eller institutioner. Skema 13D angiver, at investoren besidder (eller besidder) mere end 5 % af virksomheden og har til hensigt (eller har til hensigt at) aktivt at forfølge en ændring i forretningsstrategi. Skema 13G indikerer en passiv investering på over 5%.

The share price as of March 13, 2026 is 16,62 / share. Previously, on March 17, 2025, the share price was 15,08 / share. This represents an increase of 10,21% over that period.

ECBK / ECB Bancorp, Inc. Institutional Ownership
Fondens stemningsscore

Fund Sentiment Score (fka Ownership Accumulation Score) finder de aktier, der bliver mest købt af fonde. Det er resultatet af en sofistikeret, multi-faktor kvantitativ model, der identificerer virksomheder med de højeste niveauer af institutionel akkumulering. Scoringsmodellen bruger en kombination af den samlede stigning i oplyste ejere, ændringerne i porteføljeallokeringer i disse ejere og andre målinger. Tallet går fra 0 til 100, hvor højere tal indikerer et højere niveau af akkumulering for sine jævnaldrende, og 50 er gennemsnittet.

Opdateringsfrekvens: Dagligt

Se Ownership Explorer, som giver en liste over højest rangerende virksomheder.

AI+ Ask Fintel’s AI assistant about ECB Bancorp, Inc..

Select a question to share a public post with an AI-crafted answer.

Thinking of good questions…
Institutionel Put/Call-forhold

Ud over at indberette standardaktie- og gældsudstedelser skal institutter med mere end 100 mill. aktiver under forvaltning også oplyse deres put- og call-optionsbeholdninger. Da salgsoptioner generelt indikerer negativ stemning, og købsoptioner indikerer positiv stemning, kan vi få en fornemmelse af den overordnede institutionelle stemning ved at plotte forholdet mellem put og kald. Diagrammet til højre viser det historiske put/call-forhold for dette instrument.

Brug af Put/Call Ratio som en indikator for investorernes stemning overvinder en af de vigtigste mangler ved at bruge totalt institutionelt ejerskab, som er, at en betydelig mængde af aktiver under forvaltning investeres passivt for at spore indekser. Passivt forvaltede fonde køber typisk ikke optioner, så indikatoren for put/call-forholdet følger mere nøje følelsen af aktivt forvaltede fonde.

ECBK / ECB Bancorp, Inc. Historical Put/Call Ratio
13F og NPORT arkivering

Detaljer om 13F-arkivering er gratis. Detaljer om NP-ansøgninger kræver et premium-medlemskab. Grønne rækker angiver nye positioner. Røde rækker angiver lukkede positioner. Klik på linket ikon for at se den fulde transaktionshistorik.

Opgrader for at låse premium-data op og eksportere til Excel .

Fil dato Kilde Investor Type Gennemsnitlig pris
(Øst)
Aktier Δ Aktier
(%)
Rapporteret
Værdi
($1000)
Δ Værdi
(%)
Port Alloc
(%)
2026-02-10 13F Bnp Paribas Arbitrage, Sa 2.276 35,48 40 50,00
2025-09-17 NP NATIONWIDE MUTUAL FUNDS - Nationwide Fundamental All Cap Equity Portfolio Class R6 979 15
2026-02-13 13F Charles Schwab Investment Management Inc 23.780 0,00 414 9,55
2025-09-26 NP FSSNX - Fidelity Small Cap Index Fund This fund is a listed as child fund of Fmr Llc and if that institution has disclosed ownership in this security, then these positions will not be double counted when calculating total shares and total value 74.359 1.158
2026-02-06 13F IFP Advisors, Inc 11 37,50 0
2026-02-17 13F California State Teachers Retirement System 459 -4,57 8 0,00
2026-02-12 13F BlackRock, Inc. 399.869 4,43 6.954 14,43
2026-02-13 13F Wells Fargo & Company/mn 8.949 40,51 156 53,47
2026-02-05 13F Amalgamated Bank 236 -10,27 0
2026-01-26 13F Cwm, Llc 282 -11,04 0
2025-11-13 13F Deutsche Bank Ag\ 0 -100,00 0
2025-09-26 NP USMIX - Extended Market Index Fund 816 1,87 13 -7,69
2026-02-17 13F Bank Of America Corp /de/ 6.764 43,95 118 58,11
2026-02-17 13F Northern Trust Corp 62.268 -8,54 1.083 0,19
2026-02-11 13F Ameritas Investment Partners, Inc. 786 14
2026-02-11 13F Jpmorgan Chase & Co 4.041 -31,49 70 -24,73
2026-02-03 13F Grimes & Company, Inc. 20.000 0,00 348 9,46
2026-02-13 13F SRS Capital Advisors, Inc. 0 -100,00 0
2025-09-26 NP UAPIX - Ultrasmall-cap Profund Investor Class 85 1
2026-02-13 13F Morgan Stanley 46.336 10,20 806 20,69
2025-09-24 NP SWSSX - Schwab Small-Cap Index Fund This fund is a listed as child fund of Charles Schwab Investment Management Inc and if that institution has disclosed ownership in this security, then these positions will not be double counted when calculating total shares and total value 19.368 302
2026-02-17 13F Royal Bank Of Canada 1.046 358,77 18 350,00
2025-09-17 NP GMRAX - Nationwide Small Cap Index Fund Class A 562 9
2026-02-13 13F Maltese Capital Management Llc 45.500 0,00 791 9,56
2026-02-10 13F Goldman Sachs Group Inc 20.723 99,34 360 119,51
2026-01-29 13F Vanguard Group Inc 477.311 -2,83 8.300 6,48
2026-02-13 13F State Street Corp 75.292 0,28 1.309 9,91
2026-02-06 13F EverSource Wealth Advisors, LLC 17 30,77 0
2026-02-17 13F Tower Research Capital LLC (TRC) 610 -26,06 11 -23,08
2025-09-26 NP SLPIX - Small-cap Profund Investor Class 7 0
2026-01-08 13F True Wealth Design, LLC 0 -100,00 0
2026-02-13 13F Police & Firemen's Retirement System of New Jersey 1.843 0,00 32 10,34
2026-02-06 13F HighTower Advisors, LLC 43.000 22,86 748 34,59
2026-02-10 13F Bank of New York Mellon Corp 18.398 -2,22 320 7,05
2026-02-13 13F Rhumbline Advisers 9.983 -13,57 174 -5,46
2026-02-13 13F Mariner, LLC 11.559 -7,07 201 1,52
2026-02-17 13F Raffles Associates Lp 14.253 -11,70 248 -3,52
2026-02-17 13F MIRAE ASSET GLOBAL ETFS HOLDINGS Ltd. 3.527 -1,48 61 8,93
2026-02-10 13F Oppenheimer & Close, LLC 61.007 0,00 1.061 9,50
2026-02-13 13F Citigroup Inc 170 93,18 3 100,00
2026-01-30 13F American Capital Advisory, LLC 100 0,00 2 0,00
2025-09-24 NP SWTSX - Schwab Total Stock Market Index Fund This fund is a listed as child fund of Charles Schwab Investment Management Inc and if that institution has disclosed ownership in this security, then these positions will not be double counted when calculating total shares and total value 4.412 0,00 69 -4,23
2026-01-29 13F Stilwell Value LLC 20.000 0,00 348 9,46
2026-01-23 13F Farther Finance Advisors, LLC 5.000 87
2026-01-29 13F UBS Group AG 8.050 -24,15 140 -17,26
2026-02-09 13F Minerva Advisors LLC 49.940 0,00 868 9,60
2026-02-17 13F Covalent Partners LLC 33.000 574
2026-02-13 13F Barclays Plc 11.921 9,92 207 20,35
2026-02-06 13F Covestor Ltd 121 15,24 0
2026-02-17 13F Russell Investments Group, Ltd. 1.236 22,86 21 40,00
2026-02-12 13F Renaissance Technologies Llc 92.400 -2,12 1.607 7,21
2026-02-02 13F Sachetta, LLC 118.853 0,00 2.067 9,54
2026-02-17 13F Alliancebernstein L.p. 798.265 -0,61 13.882 8,90
2025-09-24 NP PJARX - SmallCap Value Fund II R-3 454 7
2025-11-14 13F Susquehanna International Group, Llp 0 -100,00 0 -100,00
2026-02-09 13F Legal & General Group Plc 695 0,00 12 9,09
2025-09-29 NP SUNAMERICA SERIES TRUST - SA Small Cap Index Portfolio Class 1 875 14
2026-02-06 13F Pnc Financial Services Group, Inc. 24 0
2026-02-17 13F Fmr Llc 455 15.066,67 8
2025-11-14 13F Raymond James Financial Inc 0 -100,00 0
2026-02-13 13F MAI Capital Management 2 0
2025-09-29 NP RSSL - Global X Russell 2000 ETF 3.835 60
2026-02-13 13F Sterling Capital Management LLC 433 -17,52 8 -12,50
2026-02-05 13F Allworth Financial LP 1 -66,67 0
2025-09-26 NP TISBX - TIAA-CREF Small-Cap Blend Index Fund Institutional Class 9.947 155
2026-02-09 13F Geode Capital Management, Llc 170.735 -0,66 2.970 8,87
2026-02-12 13F New York State Common Retirement Fund 4.218 0,00 73 10,61
Fintel data has been cited in the following publications:
Daily Mail Fox Business Business Insider Wall Street Journal The Washington Post Bloomberg Financial Times Globe and Mail
NASDAQ.com Reuters The Guardian Associated Press FactCheck.org Snopes Politifact
Federal Register The Intercept Forbes Fortune Magazine TheStreet Time Magazine Canadian Broadcasting Corporation International Business Times
Cambridge University Press Investopedia MarketWatch NY Daily News Entrepreneur Newsweek Barron's El Economista