Grundlæggende statistik
| Institutionelle ejere | 153 total, 153 long only, 0 short only, 0 long/short - change of -8,93% MRQ |
| Gennemsnitlig porteføljeallokering | 0.0245 % - change of -83,45% MRQ |
| Institutionelle aktier (lange) | 30.962.670 (ex 13D/G) - change of -0,17MM shares -0,55% MRQ |
| Institutionel værdi (lang) | $ 277.838 USD ($1000) |
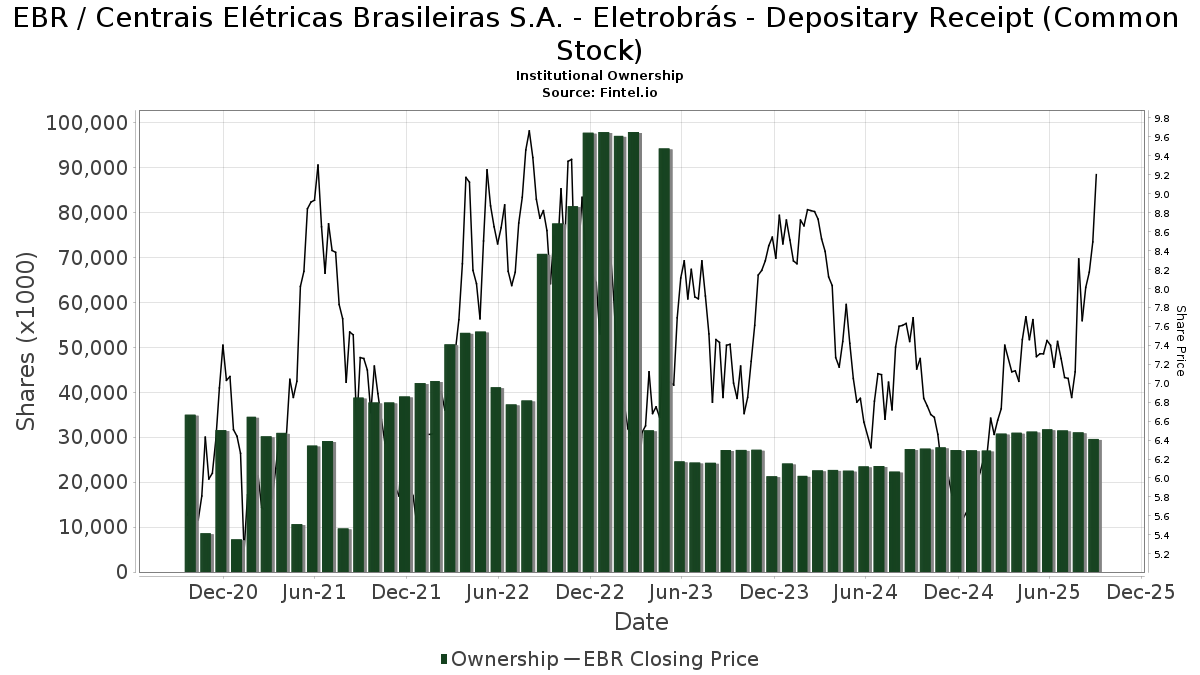
Institutionelt ejerskab og aktionærer
Centrais Elétricas Brasileiras S.A. - Eletrobrás - Depositary Receipt (Common Stock) (US:EBR) har 153 institutionelle ejere og aktionærer, der har indsendt 13D/G- eller 13F-formularer til Securities Exchange Commission (SEC). Disse institutioner har i alt 30,962,670 aktier. Største aktionærer omfatter State Street Corp, BlackRock, Inc., American Century Companies Inc, UBS Group AG, Fideuram - Intesa Sanpaolo Private Banking S.p.a., Vanguard Group Inc, Morgan Stanley, Marshall Wace, Llp, Point72 Asset Management, L.P., and Delaware Management Holdings, Inc. .
Centrais Elétricas Brasileiras S.A. - Eletrobrás - Depositary Receipt (Common Stock) (NYSE:EBR) institutionel ejerskabsstruktur viser aktuelle positioner i virksomheden efter institutioner og fonde, samt seneste ændringer i positionsstørrelse. Større aktionærer kan omfatte individuelle investorer, investeringsforeninger, hedgefonde eller institutioner. Skema 13D angiver, at investoren besidder (eller besidder) mere end 5 % af virksomheden og har til hensigt (eller har til hensigt at) aktivt at forfølge en ændring i forretningsstrategi. Skema 13G indikerer en passiv investering på over 5%.
The share price as of November 7, 2025 is 11,03 / share. Previously, on April 7, 2025, the share price was 6,86 / share. This represents an increase of 60,79% over that period.
Fondens stemningsscore
Fund Sentiment Score (fka Ownership Accumulation Score) finder de aktier, der bliver mest købt af fonde. Det er resultatet af en sofistikeret, multi-faktor kvantitativ model, der identificerer virksomheder med de højeste niveauer af institutionel akkumulering. Scoringsmodellen bruger en kombination af den samlede stigning i oplyste ejere, ændringerne i porteføljeallokeringer i disse ejere og andre målinger. Tallet går fra 0 til 100, hvor højere tal indikerer et højere niveau af akkumulering for sine jævnaldrende, og 50 er gennemsnittet.
Opdateringsfrekvens: Dagligt
Se Ownership Explorer, som giver en liste over højest rangerende virksomheder.
AI+ Ask Fintel’s AI assistant about Centrais Elétricas Brasileiras S.A. - Eletrobrás - Depositary Receipt (Common Stock).
Select a question to share a public post with an AI-crafted answer.
Thinking of good questions…
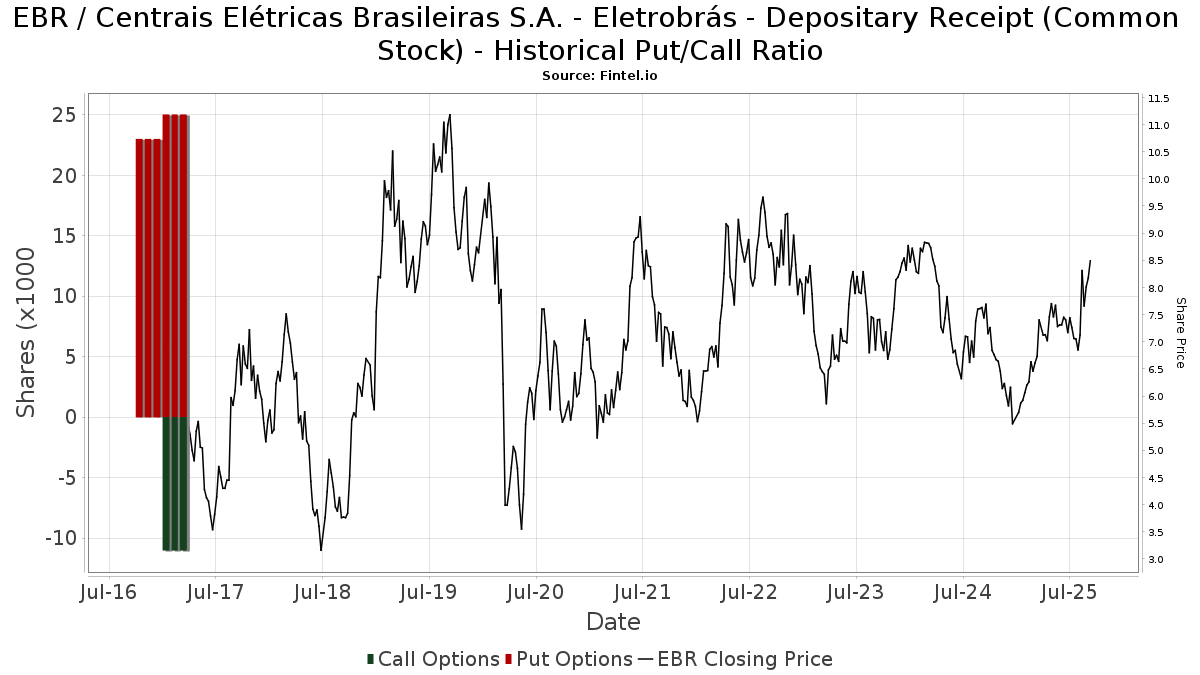
Institutionel Put/Call-forhold
Ud over at indberette standardaktie- og gældsudstedelser skal institutter med mere end 100 mill. aktiver under forvaltning også oplyse deres put- og call-optionsbeholdninger. Da salgsoptioner generelt indikerer negativ stemning, og købsoptioner indikerer positiv stemning, kan vi få en fornemmelse af den overordnede institutionelle stemning ved at plotte forholdet mellem put og kald. Diagrammet til højre viser det historiske put/call-forhold for dette instrument.
Brug af Put/Call Ratio som en indikator for investorernes stemning overvinder en af de vigtigste mangler ved at bruge totalt institutionelt ejerskab, som er, at en betydelig mængde af aktiver under forvaltning investeres passivt for at spore indekser. Passivt forvaltede fonde køber typisk ikke optioner, så indikatoren for put/call-forholdet følger mere nøje følelsen af aktivt forvaltede fonde.
13F og NPORT arkivering
Detaljer om 13F-arkivering er gratis. Detaljer om NP-ansøgninger kræver et premium-medlemskab. Grønne rækker angiver nye positioner. Røde rækker angiver lukkede positioner. Klik på linket ikon for at se den fulde transaktionshistorik.
Opgrader
for at låse premium-data op og eksportere til Excel ![]() .
.
| Fil dato | Kilde | Investor | Type | Gennemsnitlig pris (Øst) |
Aktier | Δ Aktier (%) |
Rapporteret Værdi ($1000) |
Δ Værdi (%) |
Port Alloc (%) |
|
|---|---|---|---|---|---|---|---|---|---|---|
| 2026-02-12 | 13F | Brown Brothers Harriman & Co | 1.247 | 11 | ||||||
| 2026-02-10 | 13F | Goldman Sachs Group Inc | 533.791 | -49,30 | 4.890 | -53,18 | ||||
| 2026-02-10 | 13F | Envestnet Asset Management Inc | 10.673 | -3,83 | 98 | -11,82 | ||||
| 2026-02-13 | 13F | Parkside Financial Bank & Trust | 178 | 0,00 | 2 | 0,00 | ||||
| 2026-02-13 | 13F | Marshall Wace, Llp | 1.047.682 | 9.597 | ||||||
| 2026-02-12 | 13F | Jane Street Group, Llc | 444.191 | 282,14 | 4.069 | 252,82 | ||||
| 2026-02-13 | 13F | American Century Companies Inc | 1.526.818 | 19,88 | 13.986 | 10,69 | ||||
| 2026-02-23 | 13F | Vinland Capital Management Gestora de Recursos LTDA. | 0 | -100,00 | 0 | -100,00 | ||||
| 2026-01-23 | 13F | Lester Murray Antman dba SimplyRich | 70.179 | 0,00 | 1 | |||||
| 2026-02-17 | 13F | Engineers Gate Manager LP | 151.899 | 26,46 | 1.391 | 16,79 | ||||
| 2025-11-21 | 13F | Bell Investment Advisors, Inc | 0 | -100,00 | 0 | |||||
| 2026-02-17 | 13F | Trexquant Investment LP | 0 | -100,00 | 0 | |||||
| 2026-02-17 | 13F | Optiver Holding B.V. | 93.875 | 23,70 | 860 | 14,23 | ||||
| 2026-02-12 | 13F | BlackRock, Inc. | 3.231.650 | 5,43 | 29.602 | -2,65 | ||||
| 2026-02-13 | 13F | Neuberger Berman Group LLC | 25.921 | 3,74 | 237 | -4,05 | ||||
| 2025-11-13 | 13F | EntryPoint Capital, LLC | 0 | -100,00 | 0 | |||||
| 2025-11-07 | 13F | Sierra Ocean, Llc | 0 | -100,00 | 0 | |||||
| 2025-11-14 | 13F | Aigen Investment Management, Lp | 0 | -100,00 | 0 | |||||
| 2026-02-17 | 13F | Quantinno Capital Management LP | 147.248 | 13,23 | 1.349 | 4,50 | ||||
| 2026-01-08 | 13F | True Wealth Design, LLC | 82 | 51,85 | 1 | |||||
| 2026-01-20 | 13F | Signaturefd, Llc | 9.907 | 22,90 | 91 | 13,92 | ||||
| 2026-02-17 | 13F | Balyasny Asset Management Llc | 0 | -100,00 | 0 | |||||
| 2026-01-30 | 13F | Us Bancorp \de\ | 14.857 | 7,78 | 136 | 0,00 | ||||
| 2026-02-17 | 13F | Millennium Management Llc | 928.264 | 218,96 | 8.503 | 194,59 | ||||
| 2026-02-23 | 13F | Virtu Financial LLC | 13.369 | 0 | ||||||
| 2026-01-14 | 13F | Spire Wealth Management | 469 | -81,47 | 4 | -84,00 | ||||
| 2026-02-06 | 13F | EverSource Wealth Advisors, LLC | 2.801 | 52,15 | 26 | 38,89 | ||||
| 2026-02-13 | 13F | Wells Fargo & Company/mn | 7.539 | 753.800,00 | 69 | |||||
| 2026-02-10 | 13F | Quantbot Technologies LP | 1.557 | -98,62 | 14 | -98,75 | ||||
| 2026-02-13 | 13F | Bridgefront Capital, LLC | 11.911 | 109 | ||||||
| 2026-02-17 | 13F | Guggenheim Capital Llc | 111.874 | -0,70 | 1.025 | -8,33 | ||||
| 2026-01-28 | 13F | CAPROCK Group, Inc. | 11.626 | 106 | ||||||
| 2026-02-17 | 13F | Two Sigma Investments, Lp | 181.202 | -6,02 | 1.660 | -13,23 | ||||
| 2026-01-15 | 13F | Nisa Investment Advisors, Llc | 750 | 7 | ||||||
| 2026-01-14 | 13F | Jfs Wealth Advisors, Llc | 246 | 0,00 | 2 | 0,00 | ||||
| 2026-01-23 | 13F | Baillie Gifford & Co | 264 | 2 | ||||||
| 2025-11-14 | 13F | Brevan Howard Capital Management LP | 0 | -100,00 | 0 | |||||
| 2026-02-13 | 13F | Smartleaf Asset Management LLC | 522 | 449,47 | 5 | |||||
| 2026-02-19 | 13F | CI Private Wealth, LLC | 61.113 | 0,14 | 560 | -7,60 | ||||
| 2026-01-12 | 13F | Abound Wealth Management | 34 | -74,63 | 0 | -100,00 | ||||
| 2026-02-17 | 13F | Aquatic Capital Management LLC | 0 | -100,00 | 0 | |||||
| 2026-02-17 | 13F | MIRAE ASSET GLOBAL ETFS HOLDINGS Ltd. | 36.262 | 13,43 | 332 | 4,73 | ||||
| 2026-02-10 | 13F | Eurizon Capital SGR S.p.A. | 26.620 | 244 | ||||||
| 2025-11-13 | 13F | Empowered Funds, LLC | 0 | -100,00 | 0 | |||||
| 2026-02-12 | 13F | Federation des caisses Desjardins du Quebec | 342 | 0,00 | 3 | 0,00 | ||||
| 2026-02-13 | 13F | Pathstone Holdings, LLC | 16.801 | 13,35 | 154 | 4,08 | ||||
| 2026-02-17 | 13F | Ameriprise Financial Inc | 39.574 | 2,26 | 362 | -5,48 | ||||
| 2025-11-04 | 13F | High Note Wealth, LLC | 0 | -100,00 | 0 | |||||
| 2026-01-26 | 13F | Mirae Asset Global Investments Co., Ltd. | 49.610 | 3,45 | 454 | -4,42 | ||||
| 2026-02-06 | 13F | Profund Advisors Llc | 45.405 | 10,64 | 416 | 1,97 | ||||
| 2026-02-11 | 13F | Jpmorgan Chase & Co | 7.663 | 42,57 | 70 | 32,08 | ||||
| 2026-02-13 | 13F | Cullen Capital Management, LLC | 330.217 | 3.025 | ||||||
| 2026-02-10 | 13F | Connor, Clark & Lunn Investment Management Ltd. | 737.604 | 472,22 | 6.756 | 428,64 | ||||
| 2026-02-17 | 13F | Fmr Llc | 81.497 | 3,11 | 747 | -4,85 | ||||
| 2026-02-09 | 13F | Key FInancial Inc | 1.010 | 0,00 | 9 | -10,00 | ||||
| 2026-02-17 | 13F | Public Employees Retirement System Of Ohio | 63.803 | 1.301,65 | 584 | 1.197,78 | ||||
| 2025-10-31 | 13F | Drive Wealth Management, Llc | 0 | -100,00 | 0 | -100,00 | ||||
| 2026-01-05 | 13F | GAMMA Investing LLC | 5.804 | -0,22 | 53 | -7,02 | ||||
| 2026-02-09 | 13F | Hantz Financial Services, Inc. | 46.070 | 39,48 | 0 | |||||
| 2026-02-17 | 13F | Two Sigma Advisers, Lp | 11.700 | 107 | ||||||
| 2026-01-29 | 13F | UBS Group AG | 1.519.878 | -12,03 | 13.922 | -18,77 | ||||
| 2026-02-17 | 13F | Royal Bank Of Canada | 2.204 | 37,32 | 21 | 31,25 | ||||
| 2026-01-29 | 13F | Deltec Asset Management Llc | 163.500 | 12,37 | 1.498 | 3,74 | ||||
| 2026-02-12 | 13F | Skopos Labs, Inc. | 77.034 | 399,86 | 690 | 521,62 | ||||
| 2026-02-10 | 13F | Acadian Asset Management Llc | 0 | -100,00 | 0 | |||||
| 2026-02-12 | 13F | Quadrant Capital Group Llc | 7.627 | 0,00 | 70 | -8,00 | ||||
| 2026-02-17 | 13F | Delaware Management Holdings, Inc. | 989.541 | 9.064 | ||||||
| 2026-02-13 | 13F | Citigroup Inc | 107.961 | 268,98 | 989 | 240,69 | ||||
| 2026-02-10 | 13F/A | Northwestern Mutual Wealth Management Co | 2.332 | 0,00 | 21 | -8,70 | ||||
| 2026-02-17 | 13F | Virtus Investment Advisers, Inc. | 18.373 | 168 | ||||||
| 2026-01-23 | 13F | Sumitomo Mitsui Trust Holdings, Inc. | 72.300 | 0,00 | 662 | -7,67 | ||||
| 2026-02-13 | 13F | GQG Partners LLC | 20.874 | 13,22 | 191 | 4,95 | ||||
| 2026-02-17 | 13F | XTX Topco Ltd | 0 | -100,00 | 0 | |||||
| 2026-01-23 | 13F | Farther Finance Advisors, LLC | 4.891 | 299,59 | 45 | 266,67 | ||||
| 2026-02-11 | 13F | Vise Technologies, Inc. | 14.247 | -3,40 | 130 | -10,96 | ||||
| 2026-02-13 | 13F | Macquarie Group Ltd | 0 | -100,00 | 0 | |||||
| 2026-03-03 | 13F/A | Caitong International Asset Management Co., Ltd | 105 | 1 | ||||||
| 2026-02-13 | 13F | State Street Corp | 3.876.869 | 1,96 | 35.512 | -5,85 | ||||
| 2025-10-30 | 13F | Twin Peaks Wealth Advisors, LLC | 0 | -100,00 | 0 | |||||
| 2026-02-13 | 13F | Focused Alpha, Llc | 27.077 | 248 | ||||||
| 2026-02-17 | 13F | Schonfeld Strategic Advisors LLC | 72.460 | -34,25 | 664 | -39,34 | ||||
| 2026-02-12 | 13F | Wealthspire Advisors, LLC | 0 | -100,00 | 0 | |||||
| 2026-02-03 | 13F | Crossmark Global Holdings, Inc. | 117.140 | -15,17 | 1.073 | -21,62 | ||||
| 2026-02-17 | 13F | Advisor Group Holdings, Inc. | 27.517 | 4,80 | 252 | -3,08 | ||||
| 2026-02-14 | 13F | Rockefeller Capital Management L.P. | 45 | 0,00 | 0 | |||||
| 2026-02-17 | 13F | Aqr Capital Management Llc | 43.146 | 11,09 | 395 | 2,60 | ||||
| 2026-02-17 | 13F | Creative Planning | 66.292 | 4,28 | 607 | -3,65 | ||||
| 2026-01-28 | 13F | Kapitalo Investimentos Ltda | 75.855 | -58,89 | 695 | -62,08 | ||||
| 2026-02-18 | 13F | Vident Advisory, LLC | 94.037 | -12,46 | 861 | -19,15 | ||||
| 2026-02-17 | 13F | Amundi | 418.588 | -18,37 | 3.834 | -24,32 | ||||
| 2025-11-14 | 13F | Raymond James Financial Inc | 0 | -100,00 | 0 | -100,00 | ||||
| 2026-02-10 | 13F | Natixis Advisors, L.p. | 49.082 | 5,18 | 0 | |||||
| 2026-02-12 | 13F | North of South Capital LLP | 84.977 | -80,67 | 778 | -82,16 | ||||
| 2026-02-13 | 13F | Rhumbline Advisers | 17.163 | -1,81 | 157 | -9,25 | ||||
| 2026-01-14 | 13F | InTrack Investment Management Inc | 112.146 | -12,41 | 1.027 | -19,13 | ||||
| 2026-02-11 | 13F | Ramirez Asset Management, Inc. | 400.825 | -7,03 | 3.672 | -14,17 | ||||
| 2026-02-11 | 13F | Metis Global Partners, LLC | 59.721 | -9,38 | 547 | -16,23 | ||||
| 2026-02-06 | 13F | Pnc Financial Services Group, Inc. | 16.151 | 3,59 | 148 | -4,55 | ||||
| 2026-02-09 | 13F/A | Fideuram - Intesa Sanpaolo Private Banking S.p.a. | 1.378.359 | 12.626 | ||||||
| 2026-02-17 | 13F | Susquehanna International Group, Llp | 35.625 | 145,62 | 326 | 127,97 | ||||
| 2026-02-11 | 13F | Deutsche Bank Ag\ | 3.891 | 19,54 | 36 | 9,38 | ||||
| 2026-02-11 | 13F | Parallel Advisors, LLC | 2.401 | 44,81 | 22 | 37,50 | ||||
| 2026-02-13 | 13F | NLB Skladi, upravljanje premozenja, d.o.o. | 40.000 | 366 | ||||||
| 2026-02-13 | 13F | SPX Equities Gestao de Recursos Ltda | 1.285 | -99,73 | 12 | -99,77 | ||||
| 2026-02-17 | 13F | Shelton Capital Management | 27.547 | 20,53 | 252 | 11,50 | ||||
| 2026-02-12 | 13F | Principal Securities, Inc. | 0 | -100,00 | 0 | |||||
| 2026-02-12 | 13F/A | Pinebridge Investments Llc | 226.446 | 2.074 | ||||||
| 2026-02-13 | 13F | Centiva Capital, LP | 26.336 | 241 | ||||||
| 2026-02-17 | 13F | Hillhouse Capital Advisors, Ltd. | 96.600 | 885 | ||||||
| 2025-11-20 | 13F | First Affirmative Financial Network | 50.859 | 3,48 | 505 | 38,08 | ||||
| 2026-01-14 | 13F | Eagle Rock Investment Company, Llc | 18.610 | 170 | ||||||
| 2026-02-10 | 13F | Bnp Paribas Arbitrage, Sa | 113.984 | 194,23 | 1.044 | 171,88 | ||||
| 2026-02-13 | 13F | Stifel Financial Corp | 33.593 | 0,02 | 308 | -7,81 | ||||
| 2025-11-10 | 13F | MAI Capital Management | 0 | -100,00 | 0 | |||||
| 2026-02-11 | 13F | West Family Investments, Inc. | 13.312 | 0,00 | 122 | -8,33 | ||||
| 2026-01-22 | 13F | Financial Consulate, Inc | 48 | 0 | ||||||
| 2026-02-12 | 13F | Barometer Capital Management Inc. | 0 | -100,00 | 0 | |||||
| 2026-02-13 | 13F | Van Eck Associates Corp | 400.271 | -3,09 | 4 | -25,00 | ||||
| 2026-02-13 | 13F | Ubs Asset Management Americas Inc | 205 | 2 | ||||||
| 2026-02-17 | 13F | Northern Trust Corp | 880.995 | 0,29 | 8.070 | -7,40 | ||||
| 2025-11-07 | 13F | Gsa Capital Partners Llp | 0 | -100,00 | 0 | |||||
| 2025-11-14 | 13F | Point72 (DIFC) Ltd | 1.800 | 18 | ||||||
| 2026-02-13 | 13F | Ieq Capital, Llc | 31.952 | 0,37 | 293 | -7,30 | ||||
| 2026-01-21 | 13F | Yousif Capital Management, Llc | 15.288 | 0,00 | 147 | -3,31 | ||||
| 2026-02-13 | 13F | Mariner, LLC | 69.672 | 4,24 | 638 | -3,77 | ||||
| 2026-02-17 | 13F | Jones Financial Companies Lllp | 60 | 1 | ||||||
| 2025-10-23 | 13F | SG Americas Securities, LLC | 0 | -100,00 | 0 | |||||
| 2026-02-13 | 13F | VPR Management LLC | 100.104 | 0,00 | 917 | -7,75 | ||||
| 2025-11-14 | 13F | PineBridge Investments, L.P. | 273.117 | -9,41 | 2.709 | 20,94 | ||||
| 2026-02-13 | 13F | Squarepoint Ops LLC | 0 | -100,00 | 0 | |||||
| 2026-02-06 | 13F | IFP Advisors, Inc | 146 | 0,00 | 1 | 0,00 | ||||
| 2025-11-14 | 13F | Larson Financial Group LLC | 0 | -100,00 | 0 | |||||
| 2026-01-29 | 13F | Vanguard Group Inc | 1.321.891 | 0,00 | 12.109 | -7,66 | ||||
| 2026-02-12 | 13F | Hrt Financial Lp | 0 | -100,00 | 0 | |||||
| 2026-02-06 | 13F | Global Retirement Partners, LLC | 5.569 | -93,82 | 51 | -94,29 | ||||
| 2025-11-12 | 13F | NewSquare Capital LLC | 0 | -100,00 | 0 | |||||
| 2026-01-26 | 13F | Cwm, Llc | 4.955 | 15,72 | 0 | |||||
| 2026-01-29 | 13F | Sanctuary Advisors, LLC | 17.119 | -80,73 | 157 | -82,29 | ||||
| 2026-02-12 | 13F | Triumph Capital Management | 400 | 4 | ||||||
| 2026-02-05 | 13F | HighMark Wealth Management LLC | 0 | -100,00 | 0 | |||||
| 2026-02-02 | 13F | Principal Financial Group Inc | 87.755 | 8,98 | 804 | 0,63 | ||||
| 2026-02-17 | 13F | Citadel Advisors Llc | 863.251 | 121,97 | 7.907 | 105,00 | ||||
| 2026-02-12 | 13F | Advisors Asset Management, Inc. | 13.859 | 53,68 | 127 | 41,57 | ||||
| 2026-02-12 | 13F | Dimensional Fund Advisors Lp | 402.909 | 4,54 | 3.691 | -3,48 | ||||
| 2026-02-13 | 13F | National Bank Of Canada /fi/ | 292.952 | 2.681 | ||||||
| 2026-02-17 | 13F | Two Sigma Securities, Llc | 14.099 | -14,43 | 129 | -20,86 | ||||
| 2026-02-13 | 13F | SRS Capital Advisors, Inc. | 609 | 6 | ||||||
| 2026-02-17 | 13F | Ancora Advisors, LLC | 46 | 0 | ||||||
| 2026-02-05 | 13F | Thrivent Financial For Lutherans | 60.840 | 1 | ||||||
| 2026-02-17 | 13F | Russell Investments Group, Ltd. | 118.990 | 0,46 | 1.090 | -7,24 | ||||
| 2026-02-02 | 13F | Fifth Third Bancorp | 90 | 0,00 | 1 | |||||
| 2026-02-17 | 13F | Laird Norton Trust Company, Llc | 26.316 | 241 | ||||||
| 2026-02-03 | 13F | SBI Securities Co., Ltd. | 705 | 1,00 | 6 | 0,00 | ||||
| 2026-02-09 | 13F | Huntington National Bank | 1 | 0,00 | 0 | |||||
| 2026-02-13 | 13F | First Trust Advisors Lp | 28.822 | 55,27 | 264 | 43,48 | ||||
| 2026-03-26 | 13F | Leonteq Securities AG | 0 | -100,00 | 0 | |||||
| 2026-01-23 | 13F | Assetmark, Inc | 271 | -4,58 | 2 | 0,00 | ||||
| 2026-02-03 | 13F | Sequoia Financial Advisors, LLC | 17.852 | 0,13 | 164 | -7,39 | ||||
| 2026-02-12 | 13F | Renaissance Technologies Llc | 127.440 | -47,92 | 1.167 | -51,92 | ||||
| 2026-02-17 | 13F | Point72 Asset Management, L.P. | 1.016.033 | 77,75 | 9.307 | 64,13 | ||||
| 2025-10-22 | 13F | D.a. Davidson & Co. | 0 | -100,00 | 0 | -100,00 | ||||
| 2025-11-14 | 13F | Cubist Systematic Strategies, LLC | 472.079 | 273,21 | 4.683 | 398,72 | ||||
| 2026-02-12 | 13F | Bank Of Montreal /can/ | 4.624 | 42 | ||||||
| 2025-11-14 | 13F | Point72 Asia (Singapore) Pte. Ltd. | 2.272 | 23 | ||||||
| 2026-02-11 | 13F | O'shaughnessy Asset Management, Llc | 123.710 | 28,38 | 1.133 | 18,64 | ||||
| 2026-02-13 | 13F | Morgan Stanley | 1.080.828 | -0,21 | 9.900 | -7,86 | ||||
| 2026-02-19 | 13F | Invesco Ltd. | 178.278 | 130,66 | 1.633 | 113,19 | ||||
| 2026-01-15 | 13F | Highline Wealth Partners Llc | 781 | 0,00 | 7 | 0,00 | ||||
| 2026-02-11 | 13F | LPL Financial LLC | 126.344 | 38,94 | 1.157 | 28,27 | ||||
| 2026-01-16 | 13F | Ronald Blue Trust, Inc. | 10.372 | -5,61 | 95 | -12,04 | ||||
| 2026-02-05 | 13F | Allworth Financial LP | 569 | 31,11 | 5 | 25,00 | ||||
| 2026-02-17 | 13F | Tower Research Capital LLC (TRC) | 200 | -85,19 | 2 | -92,31 | ||||
| 2026-02-13 | 13F | Itau Unibanco Holding S.A. | 0 | -100,00 | 0 | |||||
| 2026-02-17 | 13F | Bank Of America Corp /de/ | 63.488 | 25,15 | 582 | 15,51 | ||||
| 2026-02-18 | 13F | Mackenzie Financial Corp | 223.417 | 102,78 | 2.045 | 87,18 | ||||
| 2025-11-14 | 13F | Wetherby Asset Management Inc | 10.209 | 101 | ||||||
| 2026-02-06 | 13F | HighTower Advisors, LLC | 178.849 | 1,76 | 1.638 | -6,02 | ||||
| 2026-02-11 | 13F | Janney Montgomery Scott LLC | 45.008 | 0 | ||||||
| 2026-02-13 | 13F | Pinnacle Wealth Planning Services, Inc. | 1.231 | 11 | ||||||
| 2026-02-17 | 13F | Cetera Investment Advisers | 24.697 | 226 | ||||||
| 2026-02-19 | 13F | Atomi Financial Group, Inc. | 62.260 | 17,12 | 570 | 8,16 | ||||
| 2026-02-13 | 13F | Barclays Plc | 0 | -100,00 | 0 | |||||
| 2026-02-12 | 13F | Barings Llc | 723.802 | 7,33 | 6.630 | -0,88 | ||||
| 2026-03-06 | 13F | Hsbc Holdings Plc | 646.376 | 7,12 | 5.921 | -1,09 | ||||
| 2026-02-06 | 13F | New Millennium Group LLC | 14.317 | 108,10 | 131 | 92,65 | ||||
| 2025-11-04 | 13F | Frank, Rimerman Advisors LLC | 0 | -100,00 | 0 |