Grundlæggende statistik
| Institutionelle aktier (lange) | 13.361.832 - 42,52% (ex 13D/G) - change of -1,05MM shares -7,08% MRQ |
| Institutionel værdi (lang) | $ 245.691 USD ($1000) |
Institutionelt ejerskab og aktionærer
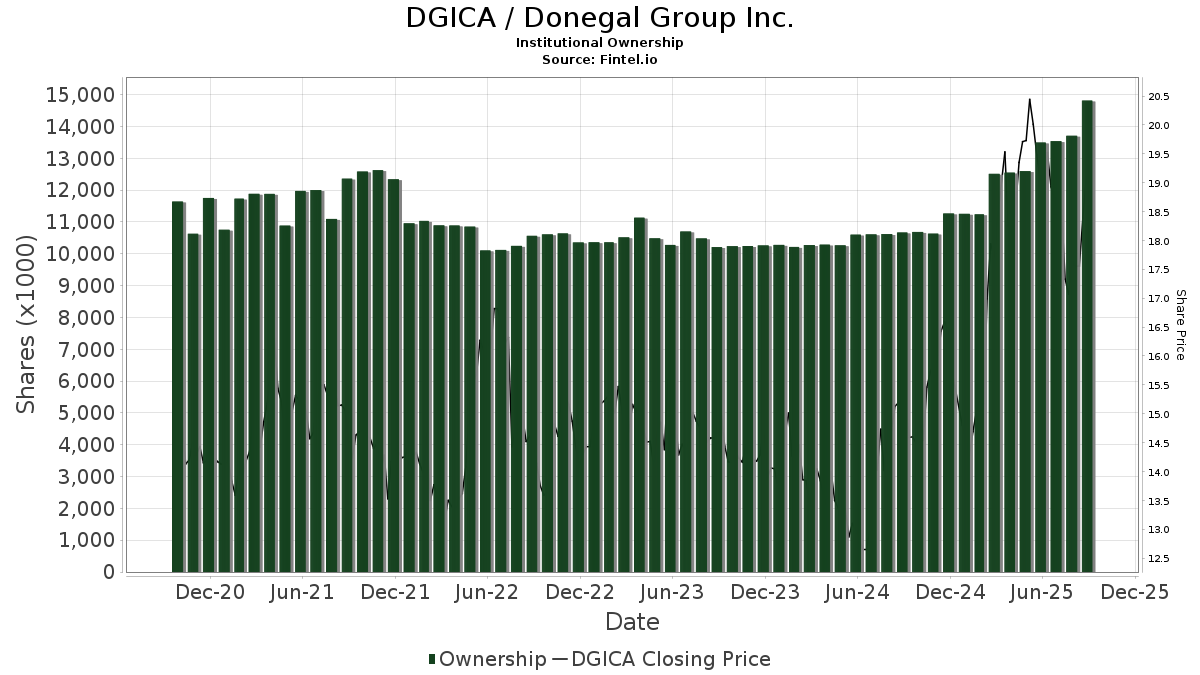
Donegal Group Inc. (US:DGICA) har 172 institutionelle ejere og aktionærer, der har indsendt 13D/G- eller 13F-formularer til Securities Exchange Commission (SEC). Disse institutioner har i alt 13,361,832 aktier. Største aktionærer omfatter BlackRock, Inc., Dimensional Fund Advisors Lp, Vanguard Group Inc, Geode Capital Management, Llc, Old Republic International Corp, State Street Corp, Renaissance Technologies Llc, Connor, Clark & Lunn Investment Management Ltd., American Century Companies Inc, and ProShare Advisors LLC .
Donegal Group Inc. (NasdaqGS:DGICA) institutionel ejerskabsstruktur viser aktuelle positioner i virksomheden efter institutioner og fonde, samt seneste ændringer i positionsstørrelse. Større aktionærer kan omfatte individuelle investorer, investeringsforeninger, hedgefonde eller institutioner. Skema 13D angiver, at investoren besidder (eller besidder) mere end 5 % af virksomheden og har til hensigt (eller har til hensigt at) aktivt at forfølge en ændring i forretningsstrategi. Skema 13G indikerer en passiv investering på over 5%.
The share price as of March 25, 2026 is 17,02 / share. Previously, on March 27, 2025, the share price was 19,16 / share. This represents a decline of 11,17% over that period.
Fondens stemningsscore
Fund Sentiment Score (fka Ownership Accumulation Score) finder de aktier, der bliver mest købt af fonde. Det er resultatet af en sofistikeret, multi-faktor kvantitativ model, der identificerer virksomheder med de højeste niveauer af institutionel akkumulering. Scoringsmodellen bruger en kombination af den samlede stigning i oplyste ejere, ændringerne i porteføljeallokeringer i disse ejere og andre målinger. Tallet går fra 0 til 100, hvor højere tal indikerer et højere niveau af akkumulering for sine jævnaldrende, og 50 er gennemsnittet.
Opdateringsfrekvens: Dagligt
Se Ownership Explorer, som giver en liste over højest rangerende virksomheder.
AI+ Ask Fintel’s AI assistant about Donegal Group Inc..
Select a question to share a public post with an AI-crafted answer.
Thinking of good questions…
Institutionel Put/Call-forhold
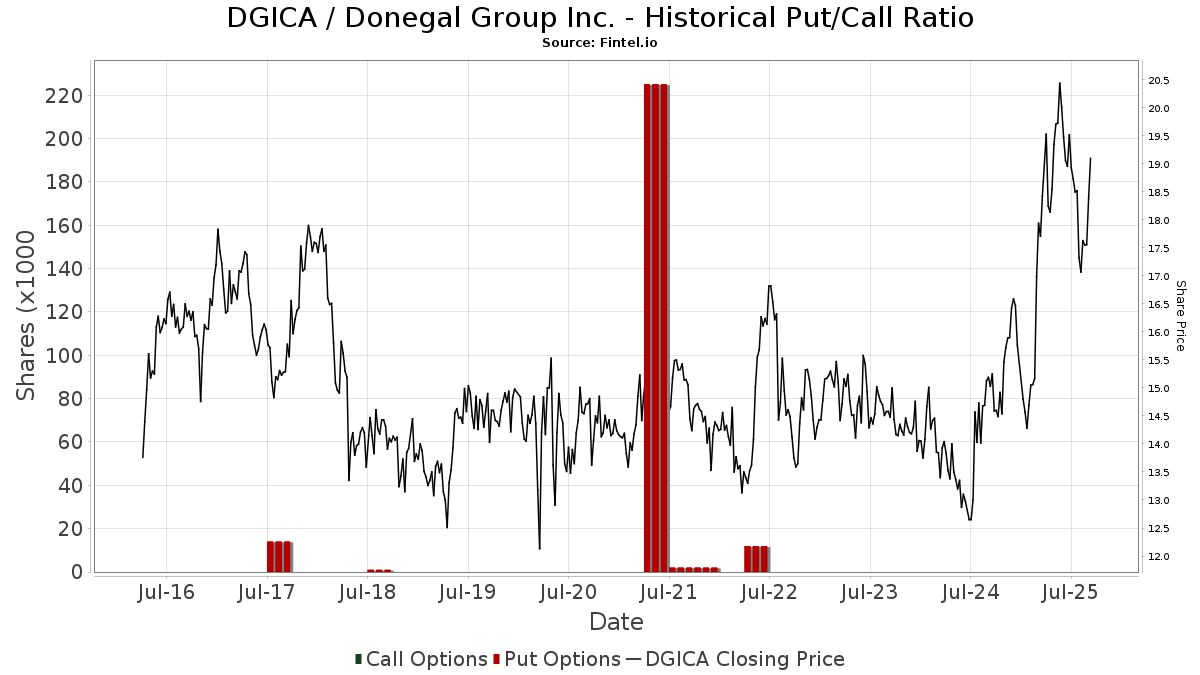
Ud over at indberette standardaktie- og gældsudstedelser skal institutter med mere end 100 mill. aktiver under forvaltning også oplyse deres put- og call-optionsbeholdninger. Da salgsoptioner generelt indikerer negativ stemning, og købsoptioner indikerer positiv stemning, kan vi få en fornemmelse af den overordnede institutionelle stemning ved at plotte forholdet mellem put og kald. Diagrammet til højre viser det historiske put/call-forhold for dette instrument.
Brug af Put/Call Ratio som en indikator for investorernes stemning overvinder en af de vigtigste mangler ved at bruge totalt institutionelt ejerskab, som er, at en betydelig mængde af aktiver under forvaltning investeres passivt for at spore indekser. Passivt forvaltede fonde køber typisk ikke optioner, så indikatoren for put/call-forholdet følger mere nøje følelsen af aktivt forvaltede fonde.
13D/G-arkivering
Vi præsenterer 13D/G ansøgninger separat fra 13F ansøgninger på grund af den forskellige behandling af SEC. 13D/G-ansøgninger kan indgives af grupper af investorer (med én ledende), hvorimod 13F-ansøgninger ikke kan. Dette resulterer i situationer, hvor en investor kan indsende en 13D/G, der rapporterer én værdi for de samlede aktier (der repræsenterer alle de aktier, der ejes af investorgruppen), men derefter indsender en 13F, der rapporterer en anden værdi for de samlede aktier (der udelukkende repræsenterer deres egne) ejendomsret). Det betyder, at aktieejerskab af 13D/G-arkiver og 13F-arkiveringer ofte ikke er direkte sammenlignelige, så vi præsenterer dem separat.
Bemærk: Fra den 16. maj 2021 viser vi ikke længere ejere, der ikke har indsendt en 13D/G inden for det seneste år. Tidligere viste vi den fulde historie af 13D/G-arkiver. Generelt skal enheder, der er forpligtet til at indgive 13D/G-ansøgninger, indgive mindst årligt, før de indsender en afsluttende ansøgning. Dog forlader fonde nogle gange positioner uden at indsende en afsluttende ansøgning (dvs. de afvikler), så visning af den fulde historie resulterede nogle gange i forvirring om det nuværende ejerskab. For at undgå forvirring viser vi nu kun 'aktuelle' ejere - det vil sige - ejere, der har anmeldt inden for det seneste år.
Upgrade to unlock premium data.
| Fil dato | Form | Investor | Forrige Aktier |
Seneste Aktier |
Δ Aktier (Procent) |
Ejendomsret (Procent) |
Δ Ejerskab (Procent) |
|
|---|---|---|---|---|---|---|---|---|
| 2026-01-21 | DIMENSIONAL FUND ADVISORS LP | 1,825,664 | 1,729,921 | -5.24 | 5.60 | -15.15 | ||
| 2025-04-28 | BlackRock, Inc. | 1,565,052 | 1,294,194 | -17.31 | 4.30 | -24.56 |
13F og NPORT arkivering
Detaljer om 13F-arkivering er gratis. Detaljer om NP-ansøgninger kræver et premium-medlemskab. Grønne rækker angiver nye positioner. Røde rækker angiver lukkede positioner. Klik på linket ikon for at se den fulde transaktionshistorik.
Opgrader
for at låse premium-data op og eksportere til Excel ![]() .
.
| Fil dato | Kilde | Investor | Type | Gennemsnitlig pris (Øst) |
Aktier | Δ Aktier (%) |
Rapporteret Værdi ($1000) |
Δ Værdi (%) |
Port Alloc (%) |
|
|---|---|---|---|---|---|---|---|---|---|---|
| 2026-02-09 | 13F | Royce & Associates Lp | 169.853 | 579,41 | 3.394 | 601,03 | ||||
| 2025-09-29 | NP | PRFZ - Invesco FTSE RAFI US 1500 Small-Mid ETF This fund is a listed as child fund of Invesco Ltd. and if that institution has disclosed ownership in this security, then these positions will not be double counted when calculating total shares and total value | 22.497 | -12,21 | 386 | -22,22 | ||||
| 2026-02-06 | 13F | ProShare Advisors LLC | 308.778 | -7,14 | 6.169 | -4,31 | ||||
| 2026-02-10 | 13F | Savant Capital, LLC | 10.900 | 5,06 | 218 | 7,96 | ||||
| 2026-02-06 | 13F | Covestor Ltd | 77 | -30,00 | 0 | |||||
| 2026-02-13 | 13F | Mml Investors Services, Llc | 69.106 | 28,41 | 1.381 | 32,31 | ||||
| 2025-11-13 | 13F | Jump Financial, LLC | 0 | -100,00 | 0 | |||||
| 2026-02-13 | 13F | First Trust Advisors Lp | 53.451 | 3,52 | 1.068 | 6,59 | ||||
| 2026-02-02 | 13F | Cornerstone Planning Group LLC | 36 | 1 | ||||||
| 2026-02-13 | 13F | American Century Companies Inc | 312.220 | 28,17 | 6.238 | 32,08 | ||||
| 2026-01-29 | 13F | Vanguard Group Inc | 1.023.155 | 1,48 | 20.443 | 4,57 | ||||
| 2026-02-13 | 13F | Pinnacle Wealth Planning Services, Inc. | 362 | 7 | ||||||
| 2026-02-11 | 13F | Simplex Trading, Llc | Call | 0 | -100,00 | 0 | ||||
| 2026-02-17 | 13F | Price T Rowe Associates Inc /md/ | 10.144 | 0 | ||||||
| 2025-09-26 | NP | TISBX - TIAA-CREF Small-Cap Blend Index Fund Institutional Class | 19.550 | 0,00 | 335 | -11,38 | ||||
| 2025-09-29 | NP | SUNAMERICA SERIES TRUST - SA Small Cap Index Portfolio Class 1 | 1.780 | -0,45 | 31 | -11,76 | ||||
| 2026-01-29 | 13F | UBS Group AG | 51.741 | -31,47 | 1.034 | -29,44 | ||||
| 2026-02-13 | 13F | Police & Firemen's Retirement System of New Jersey | 4.881 | 0,00 | 98 | 3,19 | ||||
| 2026-01-21 | 13F | Capital Advisors, Ltd. LLC | 991 | 316,39 | 0 | |||||
| 2025-09-26 | NP | TASVX - PGIM QMA SMALL-CAP VALUE FUND Class Z | 17.600 | 302 | ||||||
| 2026-02-17 | 13F | Tower Research Capital LLC (TRC) | 1.191 | -27,82 | 24 | -25,81 | ||||
| 2026-01-12 | 13F | Salem Investment Counselors Inc | 0 | -100,00 | 0 | |||||
| 2026-02-10 | 13F | Rothschild Investment Llc | 89 | 8,54 | 2 | 0,00 | ||||
| 2026-02-05 | 13F | Allworth Financial LP | 3.239 | 1,92 | 65 | 4,92 | ||||
| 2026-02-13 | 13F | Arrowstreet Capital, Limited Partnership | 195.623 | 10,13 | 3.909 | 13,47 | ||||
| 2026-02-09 | 13F | Old Republic International Corp | 425.500 | 0,00 | 9 | 0,00 | ||||
| 2026-02-17 | 13F | Trexquant Investment LP | 16.485 | -45,76 | 329 | -44,14 | ||||
| 2026-02-13 | 13F | Prudential Financial Inc | 0 | -100,00 | 0 | |||||
| 2026-02-17 | 13F | Ameriprise Financial Inc | 32.077 | -58,05 | 641 | -56,82 | ||||
| 2026-01-30 | 13F | Caldwell Securities, Inc | 212.303 | -4,95 | 4.242 | -2,06 | ||||
| 2025-11-13 | 13F | Norges Bank | 0 | -100,00 | 0 | |||||
| 2026-02-06 | 13F | Sierra Summit Advisors Llc | 0 | -100,00 | 0 | |||||
| 2025-11-14 | 13F | D. E. Shaw & Co., Inc. | 0 | -100,00 | 0 | |||||
| 2026-02-17 | 13F | Susquehanna Portfolio Strategies, LLC | 17.413 | 0,00 | 348 | 2,97 | ||||
| 2026-01-05 | 13F | GAMMA Investing LLC | 997 | 18,69 | 20 | 18,75 | ||||
| 2026-02-10 | 13F | Hazlett, Burt & Watson, Inc. | 12.936 | 18,29 | 0 | |||||
| 2026-02-12 | 13F | BlackRock, Inc. | 2.011.957 | 1,86 | 40.199 | 4,96 | ||||
| 2025-09-26 | NP | FLXSX - Fidelity Flex Small Cap Index Fund This fund is a listed as child fund of Fmr Llc and if that institution has disclosed ownership in this security, then these positions will not be double counted when calculating total shares and total value | 3.676 | 22,41 | 63 | 8,62 | ||||
| 2026-02-06 | 13F | Pnc Financial Services Group, Inc. | 101 | 9,78 | 2 | 100,00 | ||||
| 2026-02-17 | 13F | Ancora Advisors, LLC | 14.900 | 0,00 | 298 | 3,13 | ||||
| 2026-01-23 | 13F | Avion Wealth | 108 | 0,00 | 0 | |||||
| 2026-02-17 | 13F | Public Employees Retirement System Of Ohio | 12.215 | 0,00 | 244 | 3,39 | ||||
| 2026-02-13 | 13F | Stifel Financial Corp | 0 | -100,00 | 0 | |||||
| 2025-09-26 | NP | PFM - Invesco Dividend Achievers ETF | 880 | 7,45 | 15 | 0,00 | ||||
| 2026-02-06 | 13F | IFP Advisors, Inc | 3.768 | 1.377,65 | 75 | 1.775,00 | ||||
| 2026-02-17 | 13F | Russell Investments Group, Ltd. | 4.284 | -16,20 | 86 | -14,14 | ||||
| 2026-02-17 | 13F | Two Sigma Advisers, Lp | 41.200 | -2,83 | 823 | 0,12 | ||||
| 2026-02-10 | 13F | Root Financial Partners, LLC | 46 | 0,00 | 1 | |||||
| 2025-09-26 | NP | AVFIX - American Beacon Small Cap Value Fund Institutional Class | 38.920 | -2,99 | 667 | -14,05 | ||||
| 2026-02-17 | 13F | Royal Bank Of Canada | 3.731 | -49,12 | 74 | -47,89 | ||||
| 2026-02-17 | 13F | PDT Partners, LLC | 12.461 | -44,52 | 249 | -42,99 | ||||
| 2026-02-02 | 13F | Pinnacle Wealth Management Advisory Group, LLC | 20.400 | 408 | ||||||
| 2026-01-28 | 13F | Philo Smith Capital Corp | 5.192 | 0,00 | 104 | 3,00 | ||||
| 2026-02-17 | 13F | Qube Research & Technologies Ltd | 125.149 | -5,80 | 2.500 | -2,91 | ||||
| 2025-11-14 | 13F | Engineers Gate Manager LP | 0 | -100,00 | 0 | |||||
| 2026-02-11 | 13F | Empowered Funds, LLC | 90.606 | 0,00 | 1.810 | 3,08 | ||||
| 2026-02-17 | 13F | Alliancebernstein L.p. | 23.444 | 0,00 | 468 | 3,08 | ||||
| 2026-01-15 | 13F | Fortitude Family Office, LLC | 27 | 0,00 | 1 | |||||
| 2025-09-26 | NP | FZROX - Fidelity ZERO Total Market Index Fund This fund is a listed as child fund of Fmr Llc and if that institution has disclosed ownership in this security, then these positions will not be double counted when calculating total shares and total value | 7.185 | 0,00 | 123 | -11,51 | ||||
| 2025-11-07 | 13F | Gsa Capital Partners Llp | 0 | -100,00 | 0 | |||||
| 2025-11-14 | 13F | Tudor Investment Corp Et Al | 0 | -100,00 | 0 | |||||
| 2026-01-30 | 13F | New York State Teachers Retirement System | 200 | 0,00 | 0 | |||||
| 2026-02-11 | 13F | CSM Advisors, LLC | 179.160 | 0,15 | 4 | 0,00 | ||||
| 2026-02-12 | 13F | Logan Capital Management Inc | 223.703 | 0,00 | 4.470 | 3,04 | ||||
| 2026-02-13 | 13F | Barclays Plc | 68.872 | 12,38 | 1.376 | 15,82 | ||||
| 2026-02-11 | 13F | Ameritas Investment Partners, Inc. | 1.516 | 30 | ||||||
| 2026-01-15 | 13F | Nisa Investment Advisors, Llc | 7 | 0,00 | 0 | |||||
| 2026-02-13 | 13F | Citigroup Inc | 11.149 | -24,07 | 223 | -21,83 | ||||
| 2025-11-14 | 13F | Point72 Asia (Singapore) Pte. Ltd. | 0 | -100,00 | 0 | |||||
| 2025-09-29 | NP | CFSLX - Column Small Cap Fund | 797 | 14 | ||||||
| 2026-02-13 | 13F | Kennedy Capital Management, Inc. | 203.625 | -0,63 | 4.068 | 2,39 | ||||
| 2025-11-14 | 13F | Brevan Howard Capital Management LP | 0 | -100,00 | 0 | |||||
| 2026-02-10 | 13F | State of Wyoming | 25.406 | 91,60 | 508 | 97,28 | ||||
| 2025-11-14 | 13F | Jane Street Group, Llc | 0 | -100,00 | 0 | |||||
| 2026-01-08 | 13F | Wealth Enhancement Advisory Services, Llc | 21.160 | 18,48 | 415 | 18,23 | ||||
| 2026-01-28 | 13F | Klp Kapitalforvaltning As | 3.700 | 32,14 | 74 | 35,19 | ||||
| 2026-02-06 | 13F | Global Retirement Partners, LLC | 340 | 7 | ||||||
| 2026-02-09 | 13F | Geode Capital Management, Llc | 534.703 | 2,27 | 10.685 | 5,39 | ||||
| 2026-02-12 | 13F | Campbell & CO Investment Adviser LLC | 45.865 | 24,38 | 916 | 28,29 | ||||
| 2026-02-17 | 13F | Bank Of America Corp /de/ | 71.577 | 30,22 | 1.430 | 34,27 | ||||
| 2026-02-12 | 13F | Renaissance Technologies Llc | 371.211 | 1,59 | 7.417 | 4,67 | ||||
| 2026-02-17 | 13F | State Of Wisconsin Investment Board | 23.021 | 104,52 | 460 | 110,55 | ||||
| 2025-11-14 | 13F | Verition Fund Management LLC | 0 | -100,00 | 0 | |||||
| 2025-09-29 | NP | RSSL - Global X Russell 2000 ETF | 8.455 | -9,74 | 145 | -19,89 | ||||
| 2026-01-30 | 13F | Us Bancorp \de\ | 15.216 | 6.944,44 | 304 | 7.500,00 | ||||
| 2025-11-24 | 13F | CIBC Private Wealth Group, LLC | 0 | -100,00 | 0 | |||||
| 2025-11-12 | 13F | Ameriflex Group, Inc. | 0 | -100,00 | 0 | |||||
| 2026-01-20 | 13F | Signaturefd, Llc | 809 | -5,16 | 16 | 0,00 | ||||
| 2025-09-26 | NP | USMIX - Extended Market Index Fund | 1.768 | -5,05 | 30 | -16,67 | ||||
| 2026-02-11 | 13F | Jpmorgan Chase & Co | 23.171 | 2,02 | 463 | 5,00 | ||||
| 2026-02-12 | 13F | Dimensional Fund Advisors Lp | 1.729.921 | -1,00 | 34.564 | 2,01 | ||||
| 2026-02-11 | 13F | Group One Trading, L.p. | 100 | 2 | ||||||
| 2026-01-23 | 13F | Assetmark, Inc | 236 | 0,00 | 5 | 0,00 | ||||
| 2025-09-29 | NP | PKW - Invesco BuyBack Achievers ETF This fund is a listed as child fund of Invesco Ltd. and if that institution has disclosed ownership in this security, then these positions will not be double counted when calculating total shares and total value | 13.280 | 54,53 | 228 | 36,75 | ||||
| 2026-02-13 | 13F | Mariner, LLC | 14.874 | 9,92 | 297 | 13,36 | ||||
| 2025-11-14 | 13F | Citadel Advisors Llc | 0 | -100,00 | 0 | |||||
| 2026-02-11 | 13F | Franklin Resources Inc | 0 | -100,00 | 0 | -100,00 | ||||
| 2026-02-06 | 13F | EverSource Wealth Advisors, LLC | 1.178 | -64,59 | 24 | -64,06 | ||||
| 2026-02-17 | 13F | Quantinno Capital Management LP | 62.196 | 75,67 | 1.243 | 81,05 | ||||
| 2026-02-10 | 13F | Bank of New York Mellon Corp | 157.541 | 25,30 | 3.148 | 29,13 | ||||
| 2026-02-17 | 13F | XTX Topco Ltd | 0 | -100,00 | 0 | |||||
| 2026-02-02 | 13F | Strs Ohio | 28.300 | 3,66 | 565 | 6,81 | ||||
| 2026-02-17 | 13F | Advisor Group Holdings, Inc. | 3.197 | -19,02 | 64 | -16,00 | ||||
| 2026-02-03 | 13F | SBI Securities Co., Ltd. | 19 | 0,00 | 0 | |||||
| 2025-10-22 | 13F | Commonwealth Equity Services, Llc | 0 | -100,00 | 0 | |||||
| 2025-09-26 | NP | FSSNX - Fidelity Small Cap Index Fund This fund is a listed as child fund of Fmr Llc and if that institution has disclosed ownership in this security, then these positions will not be double counted when calculating total shares and total value | 167.067 | 4,67 | 2.865 | -7,22 | ||||
| 2026-02-13 | 13F | State Street Corp | 391.729 | 0,85 | 7.827 | 3,92 | ||||
| 2026-02-17 | 13F | Cannell Capital Llc | 82.939 | 26,75 | 1.657 | 30,68 | ||||
| 2026-02-13 | 13F | Ieq Capital, Llc | 22.895 | -7,09 | 457 | -4,19 | ||||
| 2026-02-13 | 13F | Sterling Capital Management LLC | 17.179 | -1,01 | 343 | 2,08 | ||||
| 2025-09-29 | NP | KCXIX - Knights of Columbus U.S. All Cap Index Fund I Shares | 73 | 19,67 | 1 | 0,00 | ||||
| 2025-09-26 | NP | UAPIX - Ultrasmall-cap Profund Investor Class | 181 | 13,12 | 3 | 0,00 | ||||
| 2026-02-12 | 13F | Integrated Quantitative Investments LLC | 0 | -100,00 | 0 | |||||
| 2026-02-06 | 13F | Bare Financial Services, Inc | 29 | 0,00 | 1 | |||||
| 2026-02-13 | 13F | Wells Fargo & Company/mn | 224.018 | 1,88 | 4.476 | 4,97 | ||||
| 2026-02-13 | 13F | Martingale Asset Management L P | 29.854 | -0,88 | 596 | 2,23 | ||||
| 2026-01-28 | 13F | Universal- Beteiligungs- und Servicegesellschaft mbH | 16.807 | 0,57 | 336 | 3,40 | ||||
| 2026-01-08 | 13F | True Wealth Design, LLC | 83 | 3,75 | 2 | 0,00 | ||||
| 2026-01-28 | 13F | Teacher Retirement System Of Texas | 192.437 | -7,89 | 3.845 | -5,09 | ||||
| 2026-02-17 | 13F | MIRAE ASSET GLOBAL ETFS HOLDINGS Ltd. | 7.784 | 3,15 | 156 | 6,16 | ||||
| 2026-02-09 | 13F | Minerva Advisors LLC | 46.490 | 0,00 | 929 | 3,00 | ||||
| 2026-02-12 | 13F | Nuveen, LLC | 20.503 | 0,00 | 410 | 3,02 | ||||
| 2026-02-13 | 13F | Segall Bryant & Hamill, Llc | 0 | -100,00 | 0 | |||||
| 2026-02-13 | 13F | Kilter Group LLC | 6 | 0 | ||||||
| 2026-03-06 | 13F | Hsbc Holdings Plc | 35.570 | 26,31 | 710 | 30,51 | ||||
| 2026-02-12 | 13F | Brinker Capital Investments, LLC | 14.062 | -0,60 | 281 | 2,19 | ||||
| 2025-11-04 | 13F | UMA Financial Services, Inc. | 0 | -100,00 | 0 | |||||
| 2026-02-12 | 13F | New York State Common Retirement Fund | 4.766 | 0,00 | 95 | 3,26 | ||||
| 2026-02-13 | 13F | Jacobs Levy Equity Management, Inc | 131.591 | -2,82 | 2.629 | 0,15 | ||||
| 2026-01-23 | 13F | State of Alaska, Department of Revenue | 1.359 | 0,00 | 0 | |||||
| 2026-02-17 | 13F | California State Teachers Retirement System | 15.403 | -0,55 | 308 | 2,33 | ||||
| 2026-01-14 | 13F | TrueMark Investments, LLC | 14.552 | 291 | ||||||
| 2026-02-17 | 13F | Aqr Capital Management Llc | 200.029 | -1,48 | 3.997 | 1,52 | ||||
| 2026-01-16 | 13F | Crewe Advisors LLC | 180 | 0,00 | 4 | 0,00 | ||||
| 2026-02-13 | 13F | Smartleaf Asset Management LLC | 2.747 | 576,60 | 55 | 685,71 | ||||
| 2026-02-11 | 13F | Hughes Financial Services, LLC | 2 | 0 | ||||||
| 2026-02-17 | 13F | Northern Trust Corp | 155.383 | -7,70 | 3.105 | -4,90 | ||||
| 2026-02-12 | 13F | Quadrant Capital Group Llc | 769 | 58,23 | 15 | 66,67 | ||||
| 2026-02-13 | 13F | Great West Life Assurance Co /can/ | 3.733 | 31,58 | 0 | |||||
| 2026-01-20 | 13F | Ascent Group, LLC | 13.958 | -4,85 | 279 | -2,11 | ||||
| 2026-01-15 | 13F | Trust Co | 37 | 1 | ||||||
| 2026-01-16 | 13F | Ronald Blue Trust, Inc. | 74 | 0,00 | 1 | 0,00 | ||||
| 2026-02-09 | 13F | Legal & General Group Plc | 11.522 | -23,26 | 230 | -20,96 | ||||
| 2026-02-17 | 13F | Aquatic Capital Management LLC | 726 | 1,68 | 15 | 7,69 | ||||
| 2026-02-11 | 13F | Parallel Advisors, LLC | 469 | 2,63 | 9 | 12,50 | ||||
| 2026-02-17 | 13F | Raymond James Financial Inc | 39.495 | 147,77 | 789 | 155,34 | ||||
| 2026-02-12 | 13F | Swiss National Bank | 33.500 | 6,01 | 669 | 9,31 | ||||
| 2026-02-09 | 13F | Hartland & Co., LLC | 0 | -100,00 | 0 | |||||
| 2026-02-03 | 13F | Navellier & Associates Inc | 18.498 | -53,14 | 370 | -51,76 | ||||
| 2026-02-13 | 13F | Charles Schwab Investment Management Inc | 170.348 | 1,96 | 3.404 | 5,06 | ||||
| 2026-02-13 | 13F | Ubs Asset Management Americas Inc | 47.344 | 4,45 | 946 | 7,63 | ||||
| 2025-11-14 | 13F | EAM Investors, LLC | 0 | -100,00 | 0 | |||||
| 2026-02-05 | 13F | Amalgamated Bank | 528 | 2,52 | 0 | |||||
| 2026-02-13 | 13F | SRS Capital Advisors, Inc. | 362 | -93,67 | 7 | -93,64 | ||||
| 2026-02-11 | 13F | Deutsche Bank Ag\ | 14.357 | 0,00 | 287 | 2,88 | ||||
| 2026-01-26 | 13F | Cwm, Llc | 14.009 | 0,87 | 0 | |||||
| 2026-02-12 | 13F | Grey Fox Wealth Advisors, LLC | 0 | -100,00 | 0 | |||||
| 2026-02-13 | 13F | Virtus ETF Advisers LLC | 7.437 | 0,00 | 149 | 2,78 | ||||
| 2026-02-11 | 13F | Brandywine Global Investment Management, LLC | 55.900 | -3,45 | 1.117 | -0,53 | ||||
| 2026-02-12 | 13F | Philadelphia Trust Co | 247.650 | -0,75 | 5 | 0,00 | ||||
| 2026-01-23 | 13F | Farther Finance Advisors, LLC | 527 | 44,38 | 11 | 42,86 | ||||
| 2025-09-26 | NP | REBYX - U.S. Small Cap Equity Fund Class Y | 507 | -6,28 | 9 | -20,00 | ||||
| 2026-02-09 | 13F | Bleakley Financial Group, LLC | 11.262 | 0,78 | 225 | 4,17 | ||||
| 2026-02-10 | 13F | IAG Wealth Partners, LLC | 9.892 | 0,00 | 198 | 3,14 | ||||
| 2026-01-27 | 13F | Zurcher Kantonalbank (Zurich Cantonalbank) | 3.325 | 0,00 | 66 | 3,13 | ||||
| 2026-02-13 | 13F | Rhumbline Advisers | 22.939 | -16,34 | 458 | -13,75 | ||||
| 2026-02-17 | 13F | Creative Planning | 161.535 | 3,96 | 3.227 | 7,14 | ||||
| 2025-10-20 | 13F | HighMark Wealth Management LLC | 0 | -100,00 | 0 | -100,00 | ||||
| 2026-01-08 | 13F | Versant Capital Management, Inc | 3.210 | 6,68 | 64 | 10,34 | ||||
| 2026-02-05 | 13F | Pinnacle Associates Ltd | 47.706 | 0,00 | 953 | 3,03 | ||||
| 2025-10-31 | 13F | Y-Intercept (Hong Kong) Ltd | 0 | -100,00 | 0 | -100,00 | ||||
| 2025-09-26 | NP | ETTOX - E*TRADE No Fee Total Market Index Fund | 97 | 410,53 | 2 | |||||
| 2026-02-17 | 13F | Advisory Services Network, LLC | 0 | -100,00 | 0 | |||||
| 2026-02-17 | 13F | Mercer Global Advisors Inc /adv | 12.150 | 20,67 | 243 | 24,10 | ||||
| 2026-02-09 | 13F | Huntington National Bank | 60 | 0,00 | 1 | 0,00 | ||||
| 2026-01-16 | 13F | Empirical Financial Services, LLC d.b.a. Empirical Wealth Management | 25.363 | 507 | ||||||
| 2026-02-10 | 13F | Acadian Asset Management Llc | 141.050 | -2,97 | 3 | 0,00 | ||||
| 2025-09-26 | NP | FZIPX - Fidelity ZERO Extended Market Index Fund This fund is a listed as child fund of Fmr Llc and if that institution has disclosed ownership in this security, then these positions will not be double counted when calculating total shares and total value | 4.907 | 0,00 | 84 | -10,64 | ||||
| 2026-02-13 | 13F | MAI Capital Management | 59 | 1 | ||||||
| 2025-11-14 | 13F | Susquehanna International Group, Llp | 0 | -100,00 | 0 | |||||
| 2025-09-26 | NP | SLPIX - Small-cap Profund Investor Class | 15 | 0,00 | 0 | |||||
| 2026-02-06 | 13F | Larson Financial Group LLC | 1.156 | 1,14 | 23 | 4,55 | ||||
| 2026-02-12 | 13F | MetLife Investment Management, LLC | 8.681 | 0,00 | 173 | 2,98 | ||||
| 2026-02-17 | 13F | Two Sigma Investments, Lp | 161.121 | 5,70 | 3.219 | 8,93 | ||||
| 2026-01-09 | 13F | SG Americas Securities, LLC | 5.590 | 0 | ||||||
| 2026-02-13 | 13F | Morgan Stanley | 224.929 | -2,71 | 4.494 | 0,27 | ||||
| 2026-02-10 | 13F | Connor, Clark & Lunn Investment Management Ltd. | 363.272 | -5,50 | 7.258 | -2,62 | ||||
| 2026-02-11 | 13F | Los Angeles Capital Management Llc | 67.726 | 144,96 | 1.245 | 132,09 | ||||
| 2026-02-17 | 13F | Optiver Holding B.V. | 132 | -52,17 | 3 | -60,00 | ||||
| 2025-11-12 | 13F | Mitsubishi UFJ Kokusai Asset Management Co., Ltd. | 0 | -100,00 | 0 | -100,00 | ||||
| 2025-11-14 | 13F | Sherbrooke Park Advisers Llc | 0 | -100,00 | 0 | |||||
| 2026-02-11 | 13F | Group One Trading, L.p. | Call | 0 | -100,00 | 0 | -100,00 | |||
| 2026-02-10 | 13F | Goldman Sachs Group Inc | 236.124 | 117,32 | 4.718 | 123,98 | ||||
| 2026-02-17 | 13F | Fmr Llc | 3.218 | -38,54 | 64 | -36,63 | ||||
| 2026-01-07 | 13F | Massmutual Trust Co Fsb/adv | 474 | -7,24 | 9 | 0,00 | ||||
| 2026-02-09 | 13F | Fidelis Capital Partners, LLC | 10.217 | 204 | ||||||
| 2026-02-19 | 13F | Invesco Ltd. | 39.226 | -1,59 | 784 | 1,42 | ||||
| 2026-02-20 | 13F | Sunbelt Securities, Inc. | 6 | 0,00 | 0 | |||||
| 2026-02-02 | 13F | Danske Bank A/s | 200 | 0,00 | 4 | 0,00 | ||||
| 2026-01-13 | 13F | CoreCap Advisors, LLC | 7 | 0,00 | 0 | |||||
| 2025-11-14 | 13F | Cubist Systematic Strategies, LLC | 0 | -100,00 | 0 | |||||
| 2026-02-02 | 13F | Principal Financial Group Inc | 34.114 | 45,61 | 682 | 50,00 | ||||
| 2026-02-17 | 13F | Millennium Management Llc | 75.719 | -43,93 | 1.513 | -42,25 | ||||
| 2026-02-17 | 13F | Bridgeway Capital Management Inc | 136.781 | 0,00 | 2.733 | 3,02 | ||||
| 2026-02-09 | 13F | Quest Partners LLC | 21.315 | 2.344,38 | 426 | 2.556,25 | ||||
| 2026-02-10 | 13F | Bnp Paribas Arbitrage, Sa | 4.923 | 0,98 | 98 | 4,26 | ||||
| 2025-09-26 | NP | ISCV - iShares Morningstar Small-Cap Value ETF | 3.857 | 8,95 | 66 | 34,69 |