Grundlæggende statistik
| Institutionelle aktier (lange) | 17.178.529 - 49,86% (ex 13D/G) - change of -2,96MM shares -14,71% MRQ |
| Institutionel værdi (lang) | $ 170.370 USD ($1000) |
Institutionelt ejerskab og aktionærer
Delcath Systems, Inc. (US:DCTH) har 123 institutionelle ejere og aktionærer, der har indsendt 13D/G- eller 13F-formularer til Securities Exchange Commission (SEC). Disse institutioner har i alt 17,178,529 aktier. Største aktionærer omfatter Rosalind Advisors, Inc., BlackRock, Inc., Vanguard Group Inc, Geode Capital Management, Llc, State Street Corp, Goldman Sachs Group Inc, Divisadero Street Capital Management, LP, Propel Bio Management, LLC, Ikarian Capital, LLC, and ExodusPoint Capital Management, LP .
Delcath Systems, Inc. (NasdaqCM:DCTH) institutionel ejerskabsstruktur viser aktuelle positioner i virksomheden efter institutioner og fonde, samt seneste ændringer i positionsstørrelse. Større aktionærer kan omfatte individuelle investorer, investeringsforeninger, hedgefonde eller institutioner. Skema 13D angiver, at investoren besidder (eller besidder) mere end 5 % af virksomheden og har til hensigt (eller har til hensigt at) aktivt at forfølge en ændring i forretningsstrategi. Skema 13G indikerer en passiv investering på over 5%.
The share price as of April 24, 2026 is 10,84 / share. Previously, on April 28, 2025, the share price was 12,00 / share. This represents a decline of 9,67% over that period.

Fondens stemningsscore
Fund Sentiment Score (fka Ownership Accumulation Score) finder de aktier, der bliver mest købt af fonde. Det er resultatet af en sofistikeret, multi-faktor kvantitativ model, der identificerer virksomheder med de højeste niveauer af institutionel akkumulering. Scoringsmodellen bruger en kombination af den samlede stigning i oplyste ejere, ændringerne i porteføljeallokeringer i disse ejere og andre målinger. Tallet går fra 0 til 100, hvor højere tal indikerer et højere niveau af akkumulering for sine jævnaldrende, og 50 er gennemsnittet.
Opdateringsfrekvens: Dagligt
Se Ownership Explorer, som giver en liste over højest rangerende virksomheder.
AI+ Ask Fintel’s AI assistant about Delcath Systems, Inc..
Select a question to share a public post with an AI-crafted answer.
Thinking of good questions…
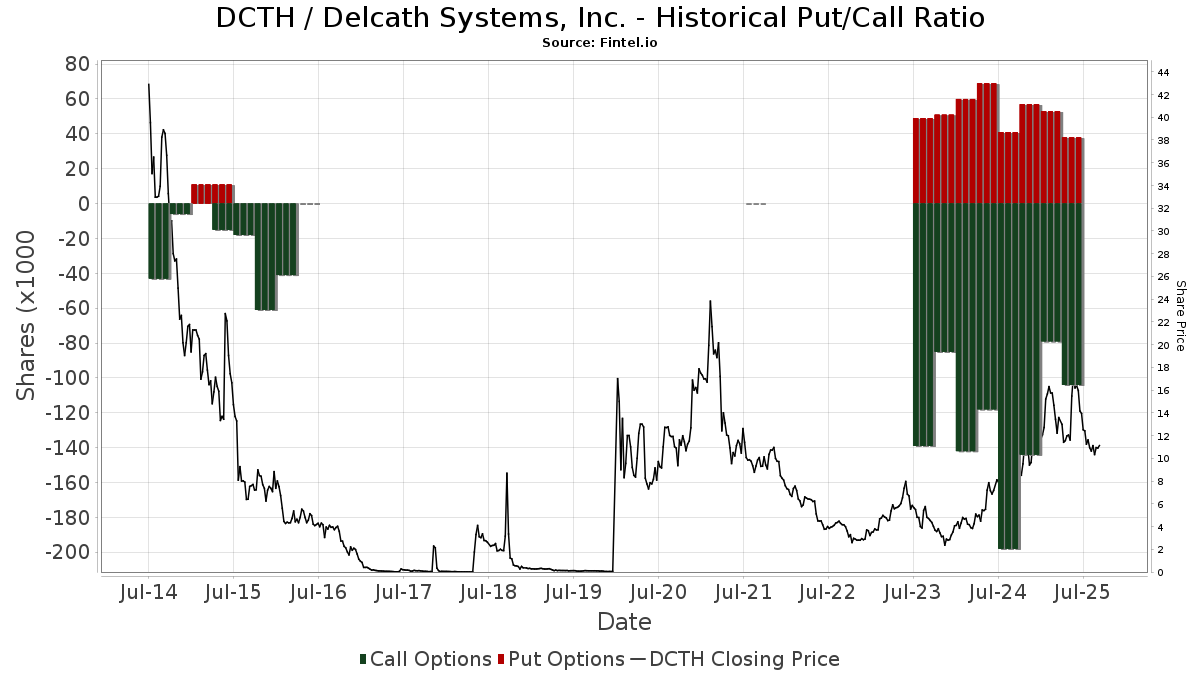
Institutionel Put/Call-forhold
Ud over at indberette standardaktie- og gældsudstedelser skal institutter med mere end 100 mill. aktiver under forvaltning også oplyse deres put- og call-optionsbeholdninger. Da salgsoptioner generelt indikerer negativ stemning, og købsoptioner indikerer positiv stemning, kan vi få en fornemmelse af den overordnede institutionelle stemning ved at plotte forholdet mellem put og kald. Diagrammet til højre viser det historiske put/call-forhold for dette instrument.
Brug af Put/Call Ratio som en indikator for investorernes stemning overvinder en af de vigtigste mangler ved at bruge totalt institutionelt ejerskab, som er, at en betydelig mængde af aktiver under forvaltning investeres passivt for at spore indekser. Passivt forvaltede fonde køber typisk ikke optioner, så indikatoren for put/call-forholdet følger mere nøje følelsen af aktivt forvaltede fonde.
13D/G-arkivering
Vi præsenterer 13D/G ansøgninger separat fra 13F ansøgninger på grund af den forskellige behandling af SEC. 13D/G-ansøgninger kan indgives af grupper af investorer (med én ledende), hvorimod 13F-ansøgninger ikke kan. Dette resulterer i situationer, hvor en investor kan indsende en 13D/G, der rapporterer én værdi for de samlede aktier (der repræsenterer alle de aktier, der ejes af investorgruppen), men derefter indsender en 13F, der rapporterer en anden værdi for de samlede aktier (der udelukkende repræsenterer deres egne) ejendomsret). Det betyder, at aktieejerskab af 13D/G-arkiver og 13F-arkiveringer ofte ikke er direkte sammenlignelige, så vi præsenterer dem separat.
Bemærk: Fra den 16. maj 2021 viser vi ikke længere ejere, der ikke har indsendt en 13D/G inden for det seneste år. Tidligere viste vi den fulde historie af 13D/G-arkiver. Generelt skal enheder, der er forpligtet til at indgive 13D/G-ansøgninger, indgive mindst årligt, før de indsender en afsluttende ansøgning. Dog forlader fonde nogle gange positioner uden at indsende en afsluttende ansøgning (dvs. de afvikler), så visning af den fulde historie resulterede nogle gange i forvirring om det nuværende ejerskab. For at undgå forvirring viser vi nu kun 'aktuelle' ejere - det vil sige - ejere, der har anmeldt inden for det seneste år.
Upgrade to unlock premium data.
| Fil dato | Form | Investor | Forrige Aktier |
Seneste Aktier |
Δ Aktier (Procent) |
Ejendomsret (Procent) |
Δ Ejerskab (Procent) |
|
|---|---|---|---|---|---|---|---|---|
| 2026-02-10 | Rosalind Advisors, Inc. | 6,674,993 | 6,719,993 | 0.67 | 9.90 | 0.00 | ||
| 2025-10-17 | BlackRock, Inc. | 508,211 | 1,753,024 | 244.94 | 5.01 | 19.29 | ||
| 2025-05-15 | Vivo Opportunity Fund Holdings, L.P. | 1,708,579 | 750,195 | -56.09 | 2.20 | -58.49 |
13F og NPORT arkivering
Detaljer om 13F-arkivering er gratis. Detaljer om NP-ansøgninger kræver et premium-medlemskab. Grønne rækker angiver nye positioner. Røde rækker angiver lukkede positioner. Klik på linket ikon for at se den fulde transaktionshistorik.
Opgrader
for at låse premium-data op og eksportere til Excel ![]() .
.
| Fil dato | Kilde | Investor | Type | Gennemsnitlig pris (Øst) |
Aktier | Δ Aktier (%) |
Rapporteret Værdi ($1000) |
Δ Værdi (%) |
Port Alloc (%) |
|
|---|---|---|---|---|---|---|---|---|---|---|
| 2026-02-13 | 13F | State Street Corp | 608.008 | -2,13 | 6.141 | -8,06 | ||||
| 2026-02-17 | 13F | California State Teachers Retirement System | 1.833 | -2,60 | 19 | -10,00 | ||||
| 2026-02-10 | 13F | Bnp Paribas Arbitrage, Sa | 6.437 | 10,49 | 65 | 4,84 | ||||
| 2026-02-17 | 13F | Bank Of America Corp /de/ | 37.480 | -66,12 | 379 | -68,21 | ||||
| 2026-02-09 | 13F | Royce & Associates Lp | 155.000 | 1.566 | ||||||
| 2026-02-17 | 13F | Quadrature Capital Ltd | 11.888 | -15,24 | 120 | -20,00 | ||||
| 2026-02-13 | 13F | Charles Schwab Investment Management Inc | 85.882 | 0,30 | 867 | -5,76 | ||||
| 2026-02-12 | 13F | Soleus Capital Management, L.P. | 10.000 | 0,00 | 101 | -5,61 | ||||
| 2026-02-13 | 13F | Caitong International Asset Management Co., Ltd | 1.774 | 18 | ||||||
| 2026-02-12 | 13F | Steward Partners Investment Advisory, Llc | 1 | 0,00 | 0 | |||||
| 2026-02-11 | 13F | Ameritas Investment Partners, Inc. | 3.075 | 31 | ||||||
| 2026-02-17 | 13F | XTX Topco Ltd | 71.193 | 339,38 | 719 | 313,22 | ||||
| 2026-02-10 | 13F | CIBC World Markets Inc. | 158.910 | -10,98 | 1.605 | -16,37 | ||||
| 2026-02-17 | 13F | Jump Financial, LLC | 45.953 | 67,98 | 464 | 57,82 | ||||
| 2026-02-12 | 13F | Silverarc Capital Management, Llc | 0 | -100,00 | 0 | -100,00 | ||||
| 2026-01-29 | 13F | Vanguard Group Inc | 1.672.357 | 0,90 | 16.891 | -5,20 | ||||
| 2026-02-17 | 13F | Hunting Hill Global Capital, LLC | 12.284 | -31,31 | 124 | -35,42 | ||||
| 2026-02-12 | 13F | Nuveen, LLC | 66.358 | 0,00 | 670 | -6,03 | ||||
| 2026-02-17 | 13F | Fmr Llc | 7.482 | 2.755,73 | 76 | 3.650,00 | ||||
| 2025-10-30 | 13F | Strs Ohio | 0 | -100,00 | 0 | -100,00 | ||||
| 2025-11-17 | 13F | Oberweis Asset Management Inc/ | 0 | -100,00 | 0 | -100,00 | ||||
| 2026-02-13 | 13F | Verition Fund Management LLC | 35.600 | -0,66 | 360 | -6,75 | ||||
| 2026-02-05 | 13F | Amalgamated Bank | 935 | -9,14 | 0 | |||||
| 2026-02-12 | 13F | New York State Common Retirement Fund | 114.562 | -3,94 | 1.157 | -9,75 | ||||
| 2026-02-17 | 13F | Advisory Services Network, LLC | 0 | -100,00 | 0 | |||||
| 2025-11-14 | 13F | Virtu Financial LLC | 0 | -100,00 | 0 | |||||
| 2025-11-14 | 13F | Point72 (DIFC) Ltd | 5.017 | 54 | ||||||
| 2026-02-12 | 13F | Quadrant Capital Group Llc | 491 | -2,77 | 5 | -20,00 | ||||
| 2026-02-17 | 13F | MIRAE ASSET GLOBAL ETFS HOLDINGS Ltd. | 13.820 | -2,36 | 140 | -8,55 | ||||
| 2026-02-17 | 13F | Trexquant Investment LP | 118.083 | -0,59 | 1.193 | -6,58 | ||||
| 2025-12-02 | 13F | IFP Advisors, Inc | 0 | 4 | ||||||
| 2026-02-10 | 13F | Bank of New York Mellon Corp | 100.993 | 45,46 | 1.020 | 36,73 | ||||
| 2026-02-11 | 13F | Group One Trading, L.p. | 16.318 | 765,22 | 165 | 720,00 | ||||
| 2026-04-22 | 13F | Sterling Capital Management LLC | 194 | 0,00 | 2 | 0,00 | ||||
| 2026-04-07 | 13F | Farther Finance Advisors, LLC | 24 | 50,00 | 0 | |||||
| 2026-04-14 | 13F | Nbc Securities, Inc. | 11.954 | 2,35 | 111 | -5,98 | ||||
| 2026-01-15 | 13F | Nisa Investment Advisors, Llc | 423 | 0,71 | 4 | 0,00 | ||||
| 2026-02-17 | 13F | Balyasny Asset Management Llc | 52.140 | 69,53 | 527 | 59,39 | ||||
| 2026-02-11 | 13F | Parallel Advisors, LLC | 1 | 0,00 | 0 | |||||
| 2026-02-13 | 13F | Divisadero Street Capital Management, LP | 499.796 | 4,96 | 5.048 | -1,39 | ||||
| 2026-02-13 | 13F | Stonepine Capital Management, LLC | 27.232 | 275 | ||||||
| 2026-02-06 | 13F | Private Wealth Advisors, LLC | 290.481 | 85,87 | 2.934 | 74,58 | ||||
| 2026-02-17 | 13F | Aquatic Capital Management LLC | 28.110 | -11,92 | 284 | -17,49 | ||||
| 2026-02-10 | 13F | Goldman Sachs Group Inc | 587.678 | 115,98 | 5.936 | 102,91 | ||||
| 2026-02-13 | 13F | Quarry LP | 829 | -68,60 | 8 | -71,43 | ||||
| 2026-02-17 | 13F | Ikarian Capital, LLC | 431.251 | 0,00 | 4.356 | -6,04 | ||||
| 2026-04-21 | 13F | PharVision Advisers, LLC | 0 | -100,00 | 0 | |||||
| 2026-02-09 | 13F | Koesten, Hirschmann & Crabtree, INC. | 0 | -100,00 | 0 | |||||
| 2026-01-27 | 13F | TD Waterhouse Canada Inc. | 500 | 5 | ||||||
| 2026-02-13 | 13F | Nantahala Capital Management, LLC | 0 | -100,00 | 0 | -100,00 | ||||
| 2026-02-13 | 13F | Macquarie Group Ltd | 0 | -100,00 | 0 | |||||
| 2026-02-17 | 13F | Sherbrooke Park Advisers Llc | 10.883 | 110 | ||||||
| 2026-02-05 | 13F | SkyOak Wealth, LLC | 15.000 | 152 | ||||||
| 2026-01-12 | 13F | AllSquare Wealth Management LLC | 1 | 0,00 | 0 | |||||
| 2026-04-20 | 13F | State of Alaska, Department of Revenue | 26.033 | 0,00 | 0 | |||||
| 2026-02-13 | 13F | Squarepoint Ops LLC | 75.143 | 20,91 | 759 | 13,47 | ||||
| 2026-02-11 | 13F | Simplex Trading, Llc | 13.283 | -33,68 | 134 | |||||
| 2026-02-13 | 13F | Marshall Wace, Llp | 24.342 | 246 | ||||||
| 2026-04-22 | 13F | Spire Wealth Management | 0 | -100,00 | 0 | |||||
| 2026-02-06 | 13F | Leonteq Securities AG | 29.000 | 293 | ||||||
| 2026-02-17 | 13F | Nomura Holdings Inc | 64.367 | 212,20 | 650 | 194,12 | ||||
| 2026-02-17 | 13F | Boothbay Fund Management, Llc | 72.977 | -37,15 | 737 | -40,95 | ||||
| 2026-04-15 | 13F | Activest Wealth Management | 1.000 | 0,00 | 9 | -10,00 | ||||
| 2026-02-12 | 13F | Rosalind Advisors, Inc. | 3.300.389 | 0,00 | 33.004 | 0,00 | ||||
| 2026-02-13 | 13F | Morgan Stanley | 308.550 | 21,95 | 3.116 | 14,60 | ||||
| 2025-11-14 | 13F | Occudo Quantitative Strategies Lp | 0 | -100,00 | 0 | |||||
| 2025-10-27 | 13F | Kiker Wealth Management, LLC | 0 | -100,00 | 0 | |||||
| 2026-02-11 | 13F | Los Angeles Capital Management Llc | 68.335 | 1,23 | 642 | -11,45 | ||||
| 2026-02-12 | 13F | Jane Street Group, Llc | 212.056 | -3,29 | 2.142 | -9,16 | ||||
| 2026-02-12 | 13F | Jane Street Group, Llc | Call | 11.100 | -38,67 | 112 | -42,27 | |||
| 2026-02-17 | 13F | Millennium Management Llc | 246.444 | 3,01 | 2.489 | -3,19 | ||||
| 2026-02-17 | 13F | Ameriprise Financial Inc | 47.079 | 8,89 | 475 | 2,37 | ||||
| 2026-02-12 | 13F | Jane Street Group, Llc | Put | 74.500 | 23,96 | 752 | 16,41 | |||
| 2026-02-13 | 13F | Police & Firemen's Retirement System of New Jersey | 8.795 | 0,00 | 89 | -6,38 | ||||
| 2026-04-08 | 13F | Capital Advisors Wealth Management, LLC | 93.000 | 2,76 | 863 | -5,58 | ||||
| 2026-02-18 | 13F | Vermillion & White Wealth Management Group, LLC | 154 | 0,00 | 2 | 0,00 | ||||
| 2025-11-14 | 13F | DRW Securities, LLC | 0 | -100,00 | 0 | -100,00 | ||||
| 2026-02-14 | 13F | Rockefeller Capital Management L.P. | 305 | 0,00 | 3 | 0,00 | ||||
| 2026-02-06 | 13F | Pnc Financial Services Group, Inc. | 29 | 0 | ||||||
| 2026-02-12 | 13F | Alps Advisors Inc | 28.999 | 71,86 | 293 | 61,33 | ||||
| 2026-02-17 | 13F | Price T Rowe Associates Inc /md/ | 16.076 | 0,00 | 0 | |||||
| 2026-02-13 | 13F | SRS Capital Advisors, Inc. | 0 | -100,00 | 0 | |||||
| 2026-02-09 | 13F | Simplify Asset Management Inc. | 261.126 | 0,00 | 2.637 | -6,06 | ||||
| 2026-02-10 | 13F | Intech Investment Management Llc | 17.595 | 13,08 | 178 | 5,99 | ||||
| 2026-04-07 | 13F | Signaturefd, Llc | 0 | -100,00 | 0 | |||||
| 2026-02-17 | 13F | Two Sigma Investments, Lp | 0 | -100,00 | 0 | |||||
| 2025-11-14 | 13F | Deerfield Management Company, L.p. (series C) | 0 | -100,00 | 0 | -100,00 | ||||
| 2026-02-17 | 13F | Tower Research Capital LLC (TRC) | 1.129 | -81,99 | 11 | -83,58 | ||||
| 2026-02-17 | 13F | Northern Trust Corp | 240.604 | -4,80 | 2.430 | -10,53 | ||||
| 2026-01-29 | 13F | Quent Capital, LLC | 894 | -5,80 | 9 | -10,00 | ||||
| 2025-11-14 | 13F | Bayesian Capital Management, LP | 0 | -100,00 | 0 | |||||
| 2026-02-11 | 13F | Fox Run Management, L.l.c. | 0 | -100,00 | 0 | |||||
| 2026-02-06 | 13F | Gsa Capital Partners Llp | 67.778 | 1 | ||||||
| 2026-02-13 | 13F | AWM Investment Company, Inc. | 60.000 | 3,95 | 606 | -2,26 | ||||
| 2026-02-09 | 13F | Legal & General Group Plc | 3.167 | -5,63 | 32 | -13,89 | ||||
| 2025-11-13 | 13F | Acadian Asset Management Llc | 0 | -100,00 | 0 | |||||
| 2025-11-04 | 13F | Principal Financial Group Inc | 0 | -100,00 | 0 | -100,00 | ||||
| 2026-01-08 | 13F | True Wealth Design, LLC | 0 | -100,00 | 0 | |||||
| 2026-01-26 | 13F | Cwm, Llc | 117 | -61,89 | 0 | |||||
| 2026-02-12 | 13F | BlackRock, Inc. | 1.825.086 | 3,17 | 18.433 | -3,07 | ||||
| 2026-02-17 | 13F | Citadel Advisors Llc | Call | 21.300 | -64,44 | 215 | -66,56 | |||
| 2026-02-13 | 13F | Wells Fargo & Company/mn | 32.820 | 77,01 | 331 | 66,33 | ||||
| 2026-02-17 | 13F | Citadel Advisors Llc | 368.865 | -17,91 | 3.726 | -22,88 | ||||
| 2026-01-28 | 13F | Geneos Wealth Management Inc. | 923 | 0,00 | 9 | 0,00 | ||||
| 2026-02-17 | 13F | Gilder Gagnon Howe & Co Llc | 0 | -100,00 | 0 | |||||
| 2026-02-17 | 13F | Citadel Advisors Llc | Put | 113.100 | 42,62 | 1.142 | 34,04 | |||
| 2026-02-17 | 13F | Susquehanna International Group, Llp | Put | 26.800 | 271 | |||||
| 2026-02-06 | 13F | FourThought Financial Partners, LLC | 0 | -100,00 | 0 | |||||
| 2026-02-17 | 13F | Raymond James Financial Inc | 0 | -100,00 | 0 | |||||
| 2025-11-10 | 13F | Hillsdale Investment Management Inc. | 0 | -100,00 | 0 | |||||
| 2026-02-17 | 13F | Susquehanna International Group, Llp | 57.782 | -11,28 | 584 | -16,71 | ||||
| 2026-02-11 | 13F | Jpmorgan Chase & Co | 12.927 | 3,41 | 131 | -2,99 | ||||
| 2026-02-13 | 13F | Pale Fire Capital SE | 40.085 | 405 | ||||||
| 2026-02-17 | 13F | Algert Global Llc | 171.595 | 2 | ||||||
| 2025-10-31 | 13F | Riverwater Partners LLC | 0 | -100,00 | 0 | |||||
| 2026-02-11 | 13F | Deutsche Bank Ag\ | 24.162 | 5,45 | 244 | -0,81 | ||||
| 2026-02-17 | 13F | Alliancebernstein L.p. | 14.000 | 0,00 | 141 | -6,00 | ||||
| 2026-02-17 | 13F | Royal Bank Of Canada | 16.019 | 27,44 | 162 | 20,00 | ||||
| 2026-02-05 | 13F | Allworth Financial LP | 16 | 433,33 | 0 | |||||
| 2025-11-14 | 13F | EAM Investors, LLC | 0 | -100,00 | 0 | |||||
| 2026-02-17 | 13F | Advisor Group Holdings, Inc. | 1.087 | 74,76 | 11 | 66,67 | ||||
| 2026-02-12 | 13F | EntryPoint Capital, LLC | 0 | -100,00 | 0 | -100,00 | ||||
| 2026-02-12 | 13F | Hrt Financial Lp | 12.581 | -91,89 | 0 | -100,00 | ||||
| 2026-02-17 | 13F | Susquehanna International Group, Llp | Call | 0 | -100,00 | 0 | ||||
| 2026-02-13 | 13F | Sei Investments Co | 22.029 | 222 | ||||||
| 2025-11-14 | 13F | D. E. Shaw & Co., Inc. | 0 | -100,00 | 0 | |||||
| 2026-02-12 | 13F | Skopos Labs, Inc. | 11.887 | -71,77 | 121 | -73,45 | ||||
| 2026-02-12 | 13F | Renaissance Technologies Llc | 361.599 | 41,14 | 3.652 | 32,61 | ||||
| 2026-01-29 | 13F | UBS Group AG | 198.992 | 73,29 | 2.010 | 62,80 | ||||
| 2025-11-14 | 13F | Cubist Systematic Strategies, LLC | 145.350 | -52,55 | 1.563 | -62,50 | ||||
| 2025-10-28 | 13F | Campbell & CO Investment Adviser LLC | 0 | -100,00 | 0 | -100,00 | ||||
| 2026-01-20 | 13F | Palisades Investment Partners, LLC | 267.138 | 1,60 | 2.698 | -4,53 | ||||
| 2026-02-13 | 13F | Barclays Plc | 78.487 | 40,17 | 793 | 31,78 | ||||
| 2026-02-17 | 13F | Man Group plc | 38.158 | 34,11 | 385 | 26,23 | ||||
| 2026-04-23 | 13F | SJS Investment Consulting Inc. | 3 | 0 | ||||||
| 2026-02-13 | 13F | Rhumbline Advisers | 34.579 | -18,65 | 349 | -23,46 | ||||
| 2026-02-17 | 13F | Corsair Capital Management, L.p. | 20.000 | 202 | ||||||
| 2025-11-14 | 13F | ExodusPoint Capital Management, LP | 379.583 | 4.081 | ||||||
| 2026-02-12 | 13F | MetLife Investment Management, LLC | 18.669 | 0,00 | 189 | -6,00 | ||||
| 2026-02-12 | 13F | Tripletail Wealth Management, LLC | 36.825 | 0,00 | 372 | -9,73 | ||||
| 2026-02-13 | 13F | Vivo Capital, LLC | 0 | -100,00 | 0 | -100,00 | ||||
| 2026-02-17 | 13F | Graham Capital Management, L.P. | 0 | -100,00 | 0 | |||||
| 2026-02-13 | 13F | Diametric Capital, LP | 220.182 | 155,35 | 2.224 | 140,06 | ||||
| 2026-02-17 | 13F | Russell Investments Group, Ltd. | 2.713 | 0,15 | 27 | -6,90 | ||||
| 2026-02-17 | 13F | Engineers Gate Manager LP | 0 | -100,00 | 0 | |||||
| 2026-02-05 | 13F | Navalign, LLC | 337 | 3 | ||||||
| 2026-02-17 | 13F | Apis Capital Advisors, LLC | 136.000 | -44,72 | 1.374 | -48,07 | ||||
| 2025-11-12 | 13F | LPL Financial LLC | 0 | -100,00 | 0 | |||||
| 2026-02-09 | 13F | Quest Partners LLC | 1.433 | 14 | ||||||
| 2026-02-12 | 13F | Federation des caisses Desjardins du Quebec | 800 | 0,00 | 8 | 0,00 | ||||
| 2026-02-11 | 13F | Propel Bio Management, LLC | 438.509 | 0,00 | 4.429 | -6,05 | ||||
| 2026-02-13 | 13F | Kennedy Capital Management, Inc. | 202.752 | -51,00 | 2.048 | -53,98 | ||||
| 2026-02-12 | 13F | Lane Generational LLC | 197.690 | 1.997 | ||||||
| 2026-04-06 | 13F | GAMMA Investing LLC | 412 | 4 | ||||||
| 2026-02-10 | 13F | Quantbot Technologies LP | 27.027 | 273 | ||||||
| 2026-02-13 | 13F | Manufacturers Life Insurance Company, The | 0 | -100,00 | 0 | |||||
| 2026-02-05 | 13F | WealthPlan Investment Management, LLC | 17.443 | 0,00 | 176 | -5,88 | ||||
| 2026-02-11 | 13F | Franklin Resources Inc | 0 | -100,00 | 0 | -100,00 | ||||
| 2026-02-17 | 13F | ADAR1 Capital Management, LLC | 224.385 | 0,00 | 2.266 | -6,05 | ||||
| 2026-02-17 | 13F | Qube Research & Technologies Ltd | 103.826 | -62,81 | 1.049 | -65,07 | ||||
| 2025-11-14 | 13F | Point72 Asset Management, L.P. | 0 | -100,00 | 0 | |||||
| 2026-02-17 | 13F | Creative Planning | 37.271 | 139,16 | 376 | 125,15 | ||||
| 2026-02-17 | 13F | Prelude Capital Management, Llc | 43.332 | 29,99 | 438 | 22,07 | ||||
| 2026-02-19 | 13F | Invesco Ltd. | 17.095 | -10,40 | 173 | -16,10 | ||||
| 2025-11-13 | 13F | Aristides Capital LLC | 0 | -100,00 | 0 | |||||
| 2025-11-14 | 13F | Wolverine Trading, Llc | Put | 19.200 | 52,38 | 209 | 22,94 | |||
| 2026-02-09 | 13F | Geode Capital Management, Llc | 682.829 | -0,70 | 6.898 | -6,71 | ||||
| 2025-11-14 | 13F | Tudor Investment Corp Et Al | 0 | -100,00 | 0 | |||||
| 2026-02-13 | 13F | Citigroup Inc | 1.509 | 16,44 | 15 | 15,38 | ||||
| 2025-11-14 | 13F | Wolverine Trading, Llc | 24.740 | 270 | ||||||
| 2025-11-14 | 13F | Wolverine Trading, Llc | Call | 44.000 | 47,65 | 480 | 18,56 |
Other Listings
| DE:DV3R | 8,87 € |