Grundlæggende statistik
| Institutionelle aktier (lange) | 37.418.320 - 74,60% (ex 13D/G) - change of -6,15MM shares -14,11% MRQ |
| Institutionel værdi (lang) | $ 959.695 USD ($1000) |
Institutionelt ejerskab og aktionærer
ConnectOne Bancorp, Inc. (US:CNOB) har 201 institutionelle ejere og aktionærer, der har indsendt 13D/G- eller 13F-formularer til Securities Exchange Commission (SEC). Disse institutioner har i alt 37,418,320 aktier. Største aktionærer omfatter BlackRock, Inc., Vanguard Group Inc, Fmr Llc, Dimensional Fund Advisors Lp, Wellington Management Group Llp, State Street Corp, Geode Capital Management, Llc, Goldman Sachs Group Inc, Bank Of America Corp /de/, and American Century Companies Inc .
ConnectOne Bancorp, Inc. (NasdaqGS:CNOB) institutionel ejerskabsstruktur viser aktuelle positioner i virksomheden efter institutioner og fonde, samt seneste ændringer i positionsstørrelse. Større aktionærer kan omfatte individuelle investorer, investeringsforeninger, hedgefonde eller institutioner. Skema 13D angiver, at investoren besidder (eller besidder) mere end 5 % af virksomheden og har til hensigt (eller har til hensigt at) aktivt at forfølge en ændring i forretningsstrategi. Skema 13G indikerer en passiv investering på over 5%.
The share price as of April 2, 2026 is 27,03 / share. Previously, on April 4, 2025, the share price was 21,61 / share. This represents an increase of 25,08% over that period.

Fondens stemningsscore
Fund Sentiment Score (fka Ownership Accumulation Score) finder de aktier, der bliver mest købt af fonde. Det er resultatet af en sofistikeret, multi-faktor kvantitativ model, der identificerer virksomheder med de højeste niveauer af institutionel akkumulering. Scoringsmodellen bruger en kombination af den samlede stigning i oplyste ejere, ændringerne i porteføljeallokeringer i disse ejere og andre målinger. Tallet går fra 0 til 100, hvor højere tal indikerer et højere niveau af akkumulering for sine jævnaldrende, og 50 er gennemsnittet.
Opdateringsfrekvens: Dagligt
Se Ownership Explorer, som giver en liste over højest rangerende virksomheder.
AI+ Ask Fintel’s AI assistant about ConnectOne Bancorp, Inc..
Select a question to share a public post with an AI-crafted answer.
Thinking of good questions…
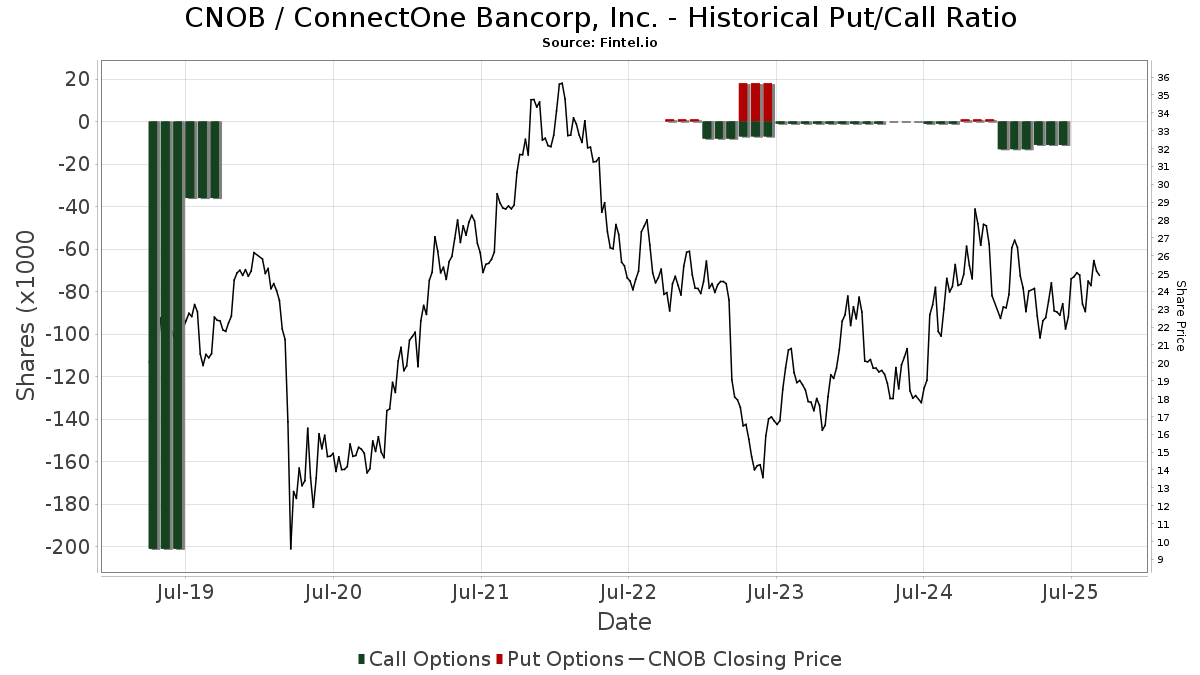
Institutionel Put/Call-forhold
Ud over at indberette standardaktie- og gældsudstedelser skal institutter med mere end 100 mill. aktiver under forvaltning også oplyse deres put- og call-optionsbeholdninger. Da salgsoptioner generelt indikerer negativ stemning, og købsoptioner indikerer positiv stemning, kan vi få en fornemmelse af den overordnede institutionelle stemning ved at plotte forholdet mellem put og kald. Diagrammet til højre viser det historiske put/call-forhold for dette instrument.
Brug af Put/Call Ratio som en indikator for investorernes stemning overvinder en af de vigtigste mangler ved at bruge totalt institutionelt ejerskab, som er, at en betydelig mængde af aktiver under forvaltning investeres passivt for at spore indekser. Passivt forvaltede fonde køber typisk ikke optioner, så indikatoren for put/call-forholdet følger mere nøje følelsen af aktivt forvaltede fonde.
13D/G-arkivering
Vi præsenterer 13D/G ansøgninger separat fra 13F ansøgninger på grund af den forskellige behandling af SEC. 13D/G-ansøgninger kan indgives af grupper af investorer (med én ledende), hvorimod 13F-ansøgninger ikke kan. Dette resulterer i situationer, hvor en investor kan indsende en 13D/G, der rapporterer én værdi for de samlede aktier (der repræsenterer alle de aktier, der ejes af investorgruppen), men derefter indsender en 13F, der rapporterer en anden værdi for de samlede aktier (der udelukkende repræsenterer deres egne) ejendomsret). Det betyder, at aktieejerskab af 13D/G-arkiver og 13F-arkiveringer ofte ikke er direkte sammenlignelige, så vi præsenterer dem separat.
Bemærk: Fra den 16. maj 2021 viser vi ikke længere ejere, der ikke har indsendt en 13D/G inden for det seneste år. Tidligere viste vi den fulde historie af 13D/G-arkiver. Generelt skal enheder, der er forpligtet til at indgive 13D/G-ansøgninger, indgive mindst årligt, før de indsender en afsluttende ansøgning. Dog forlader fonde nogle gange positioner uden at indsende en afsluttende ansøgning (dvs. de afvikler), så visning af den fulde historie resulterede nogle gange i forvirring om det nuværende ejerskab. For at undgå forvirring viser vi nu kun 'aktuelle' ejere - det vil sige - ejere, der har anmeldt inden for det seneste år.
Upgrade to unlock premium data.
| Fil dato | Form | Investor | Forrige Aktier |
Seneste Aktier |
Δ Aktier (Procent) |
Ejendomsret (Procent) |
Δ Ejerskab (Procent) |
|
|---|---|---|---|---|---|---|---|---|
| 2026-03-26 | VANGUARD GROUP INC | 2,090,143 | 0 | -100.00 | 0.00 | -100.00 | ||
| 2025-11-12 | WELLINGTON MANAGEMENT GROUP LLP | 562,748 | 2,882,584 | 412.23 | 5.70 | 223.86 | ||
| 2025-08-06 | FMR LLC | 3,375,725 | 3,222,811 | -4.53 | 6.40 | -26.80 | ||
| 2025-04-23 | BlackRock, Inc. | 4,685,873 | 2,990,894 | -36.17 | 7.80 | -36.07 |
13F og NPORT arkivering
Detaljer om 13F-arkivering er gratis. Detaljer om NP-ansøgninger kræver et premium-medlemskab. Grønne rækker angiver nye positioner. Røde rækker angiver lukkede positioner. Klik på linket ikon for at se den fulde transaktionshistorik.
Opgrader
for at låse premium-data op og eksportere til Excel ![]() .
.
| Fil dato | Kilde | Investor | Type | Gennemsnitlig pris (Øst) |
Aktier | Δ Aktier (%) |
Rapporteret Værdi ($1000) |
Δ Værdi (%) |
Port Alloc (%) |
|
|---|---|---|---|---|---|---|---|---|---|---|
| 2026-02-17 | 13F | Susquehanna International Group, Llp | 14.279 | -1,55 | 374 | 4,18 | ||||
| 2026-02-09 | 13F | Cary Street Partners Financial Llc | 15.000 | 0,00 | 393 | 5,65 | ||||
| 2026-02-17 | 13F | Bridgeway Capital Management Inc | 336.710 | 4,91 | 8.829 | 10,88 | ||||
| 2025-11-13 | 13F | Connor, Clark & Lunn Investment Management Ltd. | 0 | -100,00 | 0 | |||||
| 2026-02-17 | 13F | D. E. Shaw & Co., Inc. | 33.530 | 879 | ||||||
| 2026-01-27 | 13F | Zurcher Kantonalbank (Zurich Cantonalbank) | 16.085 | 30,29 | 422 | 37,58 | ||||
| 2025-11-14 | 13F | Susquehanna International Group, Llp | Call | 0 | -100,00 | 0 | -100,00 | |||
| 2026-02-04 | 13F | Pacific Ridge Capital Partners, LLC | 49.465 | 4,81 | 1.297 | 10,77 | ||||
| 2026-02-17 | 13F | Northern Trust Corp | 400.981 | -6,64 | 10.514 | -1,33 | ||||
| 2026-01-30 | 13F | Caldwell Securities, Inc | 4.596 | 0,00 | 121 | 5,26 | ||||
| 2026-02-17 | 13F | Jones Financial Companies Lllp | 43 | 0,00 | 1 | 0,00 | ||||
| 2026-02-17 | 13F | Public Employees Retirement System Of Ohio | 628 | -93,17 | 16 | -92,98 | ||||
| 2026-02-11 | 13F | Investors Towarzystwo Funduszy Inwestycyjnych Spolka Akcyjna | 11.630 | 305 | ||||||
| 2026-02-13 | 13F | Victory Capital Management Inc | 44.500 | -7,87 | 1.167 | -2,67 | ||||
| 2026-01-16 | 13F | Genesis Financial Group, LLC | 20.392 | 535 | ||||||
| 2026-02-17 | 13F | Raymond James Financial Inc | 184.726 | 186,81 | 4.844 | 203,26 | ||||
| 2026-02-09 | 13F | Hantz Financial Services, Inc. | 13 | 0,00 | 0 | |||||
| 2026-02-11 | 13F | Deutsche Bank Ag\ | 34.714 | 5,55 | 910 | 11,66 | ||||
| 2026-02-13 | 13F | Stifel Financial Corp | 206.802 | -0,29 | 5.422 | 5,38 | ||||
| 2026-02-12 | 13F | MetLife Investment Management, LLC | 27.561 | -0,80 | 723 | 4,79 | ||||
| 2026-01-29 | 13F | UBS Group AG | 705.119 | 579,25 | 18.488 | 617,98 | ||||
| 2026-01-20 | 13F | Harbor Capital Advisors, Inc. | 331 | -1,78 | 0 | |||||
| 2026-02-10 | 13F/A | Algebris (uk) Ltd | 846.865 | 36,52 | 22.215 | 44,46 | ||||
| 2026-02-11 | 13F | Simplex Trading, Llc | Put | 18.100 | -1,63 | 475 | ||||
| 2026-02-13 | 13F | Colony Group, LLC | 23.822 | -2,80 | 625 | 0,81 | ||||
| 2026-01-27 | 13F | Hennessy Advisors Inc | 145.000 | 0,00 | 3.802 | 5,67 | ||||
| 2026-02-09 | 13F | Legal & General Group Plc | 41.311 | -26,66 | 1.083 | -22,48 | ||||
| 2026-02-11 | 13F | Simplex Trading, Llc | 42 | -95,95 | 1 | |||||
| 2026-02-13 | 13F | PCM Encore, LLC | 10.607 | 278 | ||||||
| 2026-02-17 | 13F | Millennium Management Llc | 0 | -100,00 | 0 | |||||
| 2026-02-06 | 13F | EverSource Wealth Advisors, LLC | 404 | -57,52 | 11 | -56,52 | ||||
| 2026-02-06 | 13F | Global Retirement Partners, LLC | 484 | 0,83 | 13 | 9,09 | ||||
| 2026-02-19 | 13F | Invesco Ltd. | 81.488 | -17,92 | 2.137 | -13,28 | ||||
| 2026-02-06 | 13F | HighTower Advisors, LLC | 23.540 | 617 | ||||||
| 2026-01-21 | 13F | Capital Advisors, Ltd. LLC | 21 | 0,00 | 0 | |||||
| 2026-01-29 | 13F | Wealth Alliance Advisory Group, LLC | 10.385 | 0,00 | 272 | 5,84 | ||||
| 2026-02-13 | 13F | Manufacturers Life Insurance Company, The | 0 | -100,00 | 0 | |||||
| 2026-02-17 | 13F | Voloridge Investment Management, Llc | 0 | -100,00 | 0 | |||||
| 2025-11-12 | 13F | Aster Capital Management (DIFC) Ltd | 0 | -100,00 | 0 | |||||
| 2026-02-13 | 13F | SRS Capital Advisors, Inc. | 160 | -67,81 | 4 | -66,67 | ||||
| 2026-01-26 | 13F | Cwm, Llc | 6.885 | -2,48 | 0 | |||||
| 2026-02-13 | 13F | Wells Fargo & Company/mn | 191.832 | 6,44 | 5.030 | 12,48 | ||||
| 2026-01-07 | 13F | Massmutual Trust Co Fsb/adv | 174 | 0,00 | 5 | 0,00 | ||||
| 2026-02-03 | 13F | SBI Securities Co., Ltd. | 124 | -1,59 | 3 | 0,00 | ||||
| 2026-02-13 | 13F | First Trust Advisors Lp | 58.195 | -7,41 | 1.526 | -2,18 | ||||
| 2026-02-09 | 13F | Huntington National Bank | 1 | 0,00 | 0 | |||||
| 2026-02-17 | 13F | Two Sigma Investments, Lp | 243.345 | 44,28 | 6.381 | 52,49 | ||||
| 2026-02-05 | 13F | Tilson Financial Group, Inc. | 29.418 | 0,70 | 771 | 6,49 | ||||
| 2026-02-13 | 13F | MAI Capital Management | 62 | 0,00 | 2 | 0,00 | ||||
| 2026-01-28 | 13F | Arizona State Retirement System | 13.255 | -6,01 | 348 | -0,57 | ||||
| 2026-02-11 | 13F | Los Angeles Capital Management Llc | 180 | 4 | ||||||
| 2026-02-17 | 13F | Two Sigma Securities, Llc | 12.700 | 333 | ||||||
| 2026-02-11 | 13F | Jpmorgan Chase & Co | 538.297 | -5,45 | 14.114 | -0,08 | ||||
| 2026-02-06 | 13F | Cullen/frost Bankers, Inc. | 8 | 0,00 | 0 | |||||
| 2026-02-13 | 13F | Rhumbline Advisers | 61.238 | -13,96 | 1.606 | -9,07 | ||||
| 2026-02-17 | 13F | Cetera Investment Advisers | 38.294 | -10,47 | 1.004 | -5,37 | ||||
| 2026-02-17 | 13F | Trexquant Investment LP | 46.318 | 1.214 | ||||||
| 2026-02-11 | 13F | Franklin Resources Inc | 160.601 | -10,28 | 4.211 | -5,20 | ||||
| 2026-01-08 | 13F | Versant Capital Management, Inc | 1.396 | 28,07 | 37 | 33,33 | ||||
| 2026-02-06 | 13F | Covestor Ltd | 4 | -55,56 | 0 | |||||
| 2026-02-12 | 13F | Quadrant Capital Group Llc | 26.651 | -0,51 | 699 | 5,12 | ||||
| 2026-01-21 | 13F | Daytona Street Capital LLC | 10.600 | 278 | ||||||
| 2026-02-17 | 13F | Fmr Llc | 2.860.814 | -9,78 | 75.011 | -4,65 | ||||
| 2026-02-13 | 13F | American Century Companies Inc | 912.486 | -1,67 | 23.925 | 3,91 | ||||
| 2026-02-10 | 13F | Envestnet Asset Management Inc | 217.920 | -5,55 | 5.714 | -0,19 | ||||
| 2026-02-13 | 13F | Arrowstreet Capital, Limited Partnership | 216.819 | -15,82 | 5.685 | -11,05 | ||||
| 2026-02-17 | 13F | Elizabeth Park Capital Advisors, Ltd. | 99.219 | 0,00 | 2.602 | 5,69 | ||||
| 2026-02-18 | 13F | EP Wealth Advisors, Inc. | 8.982 | 236 | ||||||
| 2026-01-23 | 13F | Farther Finance Advisors, LLC | 3.475 | 129,07 | 91 | 145,95 | ||||
| 2026-02-17 | 13F | Optiver Holding B.V. | 106 | -72,40 | 3 | -77,78 | ||||
| 2026-02-13 | 13F | Pinnacle Wealth Planning Services, Inc. | 1.256 | 33 | ||||||
| 2026-02-13 | 13F | Police & Firemen's Retirement System of New Jersey | 13.396 | 0,05 | 351 | 5,72 | ||||
| 2026-02-11 | 13F | Janney Montgomery Scott LLC | 39.548 | -19,48 | 1 | 0,00 | ||||
| 2026-02-09 | 13F | Hartland & Co., LLC | 1.330 | 195,56 | 35 | 209,09 | ||||
| 2026-02-13 | 13F | Rafferty Asset Management, LLC | 39.869 | -23,07 | 1.045 | -18,68 | ||||
| 2026-02-17 | 13F | Silvercrest Asset Management Group Llc | 16.000 | -8,69 | 420 | -3,46 | ||||
| 2026-02-17 | 13F | Blair William & Co/il | 33.570 | 0,00 | 880 | 5,77 | ||||
| 2026-02-09 | 13F | Cary Street Partner Investment Advisory Llc | 38 | 0,00 | 1 | |||||
| 2026-02-12 | 13F | Bank Of Montreal /can/ | 10.990 | 0,00 | 288 | 5,88 | ||||
| 2026-02-12 | 13F | Jane Street Group, Llc | 110.269 | 167,74 | 2.891 | 183,15 | ||||
| 2026-02-04 | 13F | Ground Swell Capital, LLC | 0 | -100,00 | 0 | |||||
| 2026-02-13 | 13F | Marshall Wace, Llp | 115.816 | 3.037 | ||||||
| 2026-02-13 | 13F | Burton Enright Welch | 79.662 | 0,00 | 2.089 | 5,67 | ||||
| 2026-02-12 | 13F | Banc Funds Co Llc | 227.795 | -5,55 | 5.973 | -0,18 | ||||
| 2026-02-13 | 13F | Boston Partners | 144.774 | 12,46 | 3.796 | 18,85 | ||||
| 2026-02-13 | 13F | Kennedy Capital Management, Inc. | 863.983 | 12,98 | 22.654 | 19,40 | ||||
| 2026-02-13 | 13F | Caitong International Asset Management Co., Ltd | 0 | -100,00 | 0 | |||||
| 2025-11-13 | 13F | C M Bidwell & Associates Ltd | 0 | -100,00 | 0 | |||||
| 2026-02-10 | 13F | Anchor Capital Advisors Llc | 108.415 | 9,23 | 2.843 | 15,43 | ||||
| 2026-02-17 | 13F | Two Sigma Advisers, Lp | 207.094 | 3,76 | 5.430 | 9,67 | ||||
| 2026-02-06 | 13F | ProShare Advisors LLC | 8.716 | 6,87 | 229 | 12,87 | ||||
| 2026-02-17 | 13F | Jump Financial, LLC | 0 | -100,00 | 0 | |||||
| 2026-02-17 | 13F | Price T Rowe Associates Inc /md/ | 55.032 | 3,64 | 1 | 0,00 | ||||
| 2026-02-17 | 13F | Wellington Management Group Llp | 2.787.747 | -3,29 | 73.095 | 2,21 | ||||
| 2026-01-29 | 13F | UMA Financial Services, Inc. | 18 | 0 | ||||||
| 2026-01-29 | 13F | Copeland Capital Management, LLC | 2.594 | 0,00 | 68 | 6,25 | ||||
| 2026-01-28 | 13F | Klp Kapitalforvaltning As | 10.200 | 4,08 | 267 | 9,88 | ||||
| 2025-10-30 | 13F | Strs Ohio | 0 | -100,00 | 0 | |||||
| 2026-02-17 | 13F | Ameriprise Financial Inc | 63.002 | -32,09 | 1.652 | -28,25 | ||||
| 2026-02-11 | 13F | CenterBook Partners LP | 117.868 | 3.090 | ||||||
| 2026-02-06 | 13F | Stieven Capital Advisors, L.P. | 698.939 | -0,26 | 18.326 | 5,41 | ||||
| 2026-02-13 | 13F | Gator Capital Management, LLC | 308.487 | 0,73 | 8.089 | 6,46 | ||||
| 2026-02-10 | 13F | BW Gestao de Investimentos Ltda. | 162.500 | 4.261 | ||||||
| 2026-02-12 | 13F | Campbell & CO Investment Adviser LLC | 29.870 | 783 | ||||||
| 2026-02-17 | 13F | Chilton Investment Co Llc | 49.606 | -32,93 | 1.301 | -29,12 | ||||
| 2026-02-10 | 13F | Bnp Paribas Arbitrage, Sa | 10.372 | 9,35 | 272 | 15,32 | ||||
| 2026-02-12 | 13F | JPL Wealth Management, LLC | 0 | -100,00 | 0 | |||||
| 2026-02-12 | 13F | Principal Securities, Inc. | 0 | -100,00 | 0 | -100,00 | ||||
| 2026-01-28 | 13F | Serenus Wealth Advisors, LLC | 0 | -100,00 | 0 | |||||
| 2026-02-09 | 13F | Endeavour Capital Advisors Inc | 128.972 | 79,04 | 3.382 | 89,20 | ||||
| 2026-02-09 | 13F | Quest Partners LLC | 0 | -100,00 | 0 | |||||
| 2026-02-11 | 13F | Empowered Funds, LLC | 212.496 | 8,02 | 5.572 | 14,16 | ||||
| 2026-01-28 | 13F | John W. Rosenthal Capital Management, Inc. | 81.893 | 0,00 | 2.147 | 5,71 | ||||
| 2026-02-17 | 13F | Alliancebernstein L.p. | 262.840 | 0,28 | 6.892 | 5,98 | ||||
| 2025-11-13 | 13F | RMB Capital Management, LLC | 0 | -100,00 | 0 | |||||
| 2026-02-17 | 13F | Advisor Group Holdings, Inc. | 1.549 | -12,98 | 41 | -11,11 | ||||
| 2026-02-17 | 13F | Jain Global LLC | 124.325 | 3.260 | ||||||
| 2026-02-17 | 13F | Janus Henderson Group Plc | 20.357 | 0,00 | 533 | 5,54 | ||||
| 2026-02-10 | 13F | Goldman Sachs Group Inc | 1.124.619 | -7,33 | 29.488 | -2,07 | ||||
| 2026-01-05 | 13F | GAMMA Investing LLC | 4.643 | 6,81 | 122 | 13,08 | ||||
| 2026-01-09 | 13F | SG Americas Securities, LLC | 599.235 | 16 | ||||||
| 2026-02-17 | 13F | Tower Research Capital LLC (TRC) | 5.502 | 16,47 | 144 | 23,08 | ||||
| 2025-11-12 | 13F | Simplex Trading, Llc | Call | 0 | -100,00 | 0 | ||||
| 2026-02-17 | 13F | State Of Wisconsin Investment Board | 20.692 | 543 | ||||||
| 2026-02-06 | 13F | IFP Advisors, Inc | 45 | -2,17 | 1 | 0,00 | ||||
| 2026-02-12 | 13F | Renaissance Technologies Llc | 393.578 | -1,15 | 10.320 | 4,46 | ||||
| 2026-02-06 | 13F | Pnc Financial Services Group, Inc. | 1.586 | -3,29 | 42 | 2,50 | ||||
| 2026-02-09 | 13F | Emerald Mutual Fund Advisers Trust | 0 | -100,00 | 0 | |||||
| 2026-02-05 | 13F | Allworth Financial LP | 1.146 | 0,00 | 30 | 7,14 | ||||
| 2026-02-06 | 13F | Lsv Asset Management | 30.100 | 0,00 | 1 | |||||
| 2026-02-17 | 13F | Russell Investments Group, Ltd. | 4.386 | -3,67 | 115 | 2,68 | ||||
| 2026-02-14 | 13F | Rockefeller Capital Management L.P. | 48.389 | -0,18 | 1.269 | 5,49 | ||||
| 2025-11-14 | 13F | Quarry LP | 0 | -100,00 | 0 | |||||
| 2026-02-17 | 13F | Creative Planning | 52.007 | -0,44 | 1.364 | 5,17 | ||||
| 2026-02-11 | 13F | Group One Trading, L.p. | Put | 6.800 | 0,00 | 178 | 5,95 | |||
| 2026-02-13 | 13F | BNP Paribas Asset Management Holding S.A. | 566 | 0 | ||||||
| 2026-02-11 | 13F | Group One Trading, L.p. | Call | 300 | 0,00 | 8 | 0,00 | |||
| 2026-02-11 | 13F | LPL Financial LLC | 9.467 | 13,34 | 248 | 19,81 | ||||
| 2026-02-17 | 13F | Royal Bank Of Canada | 18.876 | -18,77 | 496 | -14,04 | ||||
| 2026-02-04 | 13F | Wsfs Capital Management, Llc | 8.130 | -11,04 | 213 | -5,75 | ||||
| 2026-02-13 | 13F | Public Employees Retirement Association Of Colorado | 11.289 | 0,00 | 0 | |||||
| 2026-01-23 | 13F | State of Alaska, Department of Revenue | 1.971 | 0,00 | 0 | |||||
| 2026-02-12 | 13F | Earnest Partners Llc | 296.413 | -4,30 | 7.772 | 1,13 | ||||
| 2026-01-13 | 13F | Capital Investment Advisors, LLC | 0 | -100,00 | 0 | |||||
| 2026-02-13 | 13F | Y-Intercept (Hong Kong) Ltd | 11.793 | 309 | ||||||
| 2026-01-15 | 13F | Nisa Investment Advisors, Llc | 592 | -20,75 | 16 | -16,67 | ||||
| 2026-01-27 | 13F | Evergreen Capital Management Llc | 8.841 | 232 | ||||||
| 2026-02-12 | 13F | Wealthspire Advisors, LLC | 0 | -100,00 | 0 | |||||
| 2026-02-13 | 13F | Prudential Financial Inc | 100.521 | -3,17 | 2.636 | 2,33 | ||||
| 2026-02-06 | 13F | Larson Financial Group LLC | 241 | 33,89 | 6 | 50,00 | ||||
| 2026-02-12 | 13F | Dimensional Fund Advisors Lp | 2.816.307 | -0,76 | 73.844 | 4,88 | ||||
| 2025-11-14 | 13F | Mendon Capital Advisors Corp | 0 | -100,00 | 0 | -100,00 | ||||
| 2026-02-09 | 13F | Geode Capital Management, Llc | 1.225.516 | -0,36 | 32.139 | 5,30 | ||||
| 2026-02-17 | 13F | Zacks Investment Management | 9.264 | -0,39 | 243 | 5,22 | ||||
| 2026-02-17 | 13F | Watershed Asset Management, L.L.C. | 15.114 | 396 | ||||||
| 2026-02-12 | 13F | Steward Partners Investment Advisory, Llc | 0 | -100,00 | 0 | |||||
| 2026-01-23 | 13F | Palouse Capital Management, Inc. | 1 | 0,00 | 0 | |||||
| 2025-11-14 | 13F | Skopos Labs, Inc. | 0 | -100,00 | 0 | |||||
| 2026-02-13 | 13F | Fourthstone LLC | 0 | -100,00 | 0 | |||||
| 2026-01-15 | 13F | Fortitude Family Office, LLC | 0 | -100,00 | 0 | |||||
| 2026-02-13 | 13F | Morgan Stanley | 289.545 | -32,06 | 7.592 | -28,20 | ||||
| 2026-02-17 | 13F | PMC FIG Opportunities LLC | 92.093 | -60,95 | 2.415 | -58,74 | ||||
| 2026-01-21 | 13F | Newbridge Financial Services Group, Inc. | 750 | 0,00 | 20 | 5,56 | ||||
| 2026-01-30 | 13F | R Squared Ltd | 10.262 | 269 | ||||||
| 2026-02-13 | 13F | Citigroup Inc | 33.821 | -12,19 | 887 | -7,23 | ||||
| 2026-02-17 | 13F | Advisory Services Network, LLC | 0 | -100,00 | 0 | |||||
| 2026-02-17 | 13F | Qube Research & Technologies Ltd | 56.253 | 1.475 | ||||||
| 2025-11-07 | 13F | Shell Asset Management Co | 2.545 | -59,62 | 0 | |||||
| 2026-02-10 | 13F | Intech Investment Management Llc | 17.796 | -9,56 | 467 | -4,51 | ||||
| 2026-02-12 | 13F | DRW Securities, LLC | 8.010 | 210 | ||||||
| 2025-10-24 | 13F | Hemington Wealth Management | 105 | 0,00 | 0 | |||||
| 2026-02-11 | 13F | Ameritas Investment Partners, Inc. | 3.984 | 104 | ||||||
| 2026-02-10 | 13F | Quantbot Technologies LP | 0 | -100,00 | 0 | |||||
| 2026-02-12 | 13F | BlackRock, Inc. | 4.837.581 | -0,42 | 126.841 | 5,24 | ||||
| 2026-02-12 | 13F | BRYN MAWR TRUST Co | 12.019 | 0,00 | 315 | 5,70 | ||||
| 2026-01-14 | 13F | Jfs Wealth Advisors, Llc | 155 | 0,00 | 4 | 33,33 | ||||
| 2026-02-02 | 13F | Salzhauer Michael | 67.091 | 0,30 | 1.759 | 6,03 | ||||
| 2025-10-08 | 13F | Rise Advisors, LLC | 0 | -100,00 | 0 | |||||
| 2026-02-11 | 13F | Parallel Advisors, LLC | 122 | 0,00 | 3 | 0,00 | ||||
| 2026-02-12 | 13F | Nuveen, LLC | 596.019 | -2,14 | 15.628 | 3,42 | ||||
| 2026-02-17 | 13F | VARCOV Co. | 16.095 | 422 | ||||||
| 2026-02-12 | 13F | New York State Common Retirement Fund | 13.709 | 0,00 | 359 | 5,59 | ||||
| 2026-02-17 | 13F | Aquatic Capital Management LLC | 8.123 | 378,95 | 213 | 404,76 | ||||
| 2026-02-10 | 13F | Fort Sheridan Advisors Llc | 11.828 | 0,00 | 310 | 5,80 | ||||
| 2026-01-08 | 13F | True Wealth Design, LLC | 25 | 0,00 | 1 | |||||
| 2026-02-17 | 13F | California State Teachers Retirement System | 44.427 | -0,09 | 1.165 | 5,53 | ||||
| 2026-02-13 | 13F | Sei Investments Co | 86.013 | 58,41 | 2.255 | 67,41 | ||||
| 2026-02-23 | 13F | Mv Capital Management, Inc. | 0 | -100,00 | 0 | |||||
| 2026-02-12 | 13F | Swiss National Bank | 94.100 | 1,73 | 2.467 | 7,54 | ||||
| 2026-02-17 | 13F | Quantinno Capital Management LP | 46.649 | 24,92 | 1.223 | 32,07 | ||||
| 2026-01-23 | 13F | Webster Bank, N. A. | 1.319 | 0,00 | 35 | 6,25 | ||||
| 2026-01-08 | 13F | Tompkins Financial Corp | 44 | 1 | ||||||
| 2026-02-12 | 13F | CIBC Private Wealth Group, LLC | 151 | 0,00 | 4 | 0,00 | ||||
| 2025-11-14 | 13F | Verition Fund Management LLC | 0 | -100,00 | 0 | |||||
| 2026-02-13 | 13F | Barclays Plc | 124.901 | 8,89 | 3.275 | 13,96 | ||||
| 2026-01-20 | 13F | Signaturefd, Llc | 7.661 | 2,09 | 201 | 7,53 | ||||
| 2026-02-05 | 13F | Amalgamated Bank | 1.498 | 15,59 | 0 | |||||
| 2026-02-10 | 13F | Bank of New York Mellon Corp | 276.459 | -18,11 | 7.249 | -13,46 | ||||
| 2026-02-13 | 13F | Charles Schwab Investment Management Inc | 415.844 | 0,71 | 10.903 | 6,44 | ||||
| 2026-02-17 | 13F | Persistent Asset Partners Ltd | 32.890 | -56,61 | 862 | -54,15 | ||||
| 2026-02-10 | 13F | Rothschild Investment Llc | 120 | 0,00 | 3 | 50,00 | ||||
| 2026-02-13 | 13F | Smartleaf Asset Management LLC | 69 | 1,47 | 2 | 0,00 | ||||
| 2026-02-05 | 13F | Thrivent Financial For Lutherans | 56.554 | 1 | ||||||
| 2026-01-30 | 13F | Us Bancorp \de\ | 1.222 | -7,98 | 32 | 0,00 | ||||
| 2026-02-17 | 13F | Brevan Howard Capital Management LP | 283.923 | 7.444 | ||||||
| 2026-02-17 | 13F | EJF Capital LLC | 28.364 | -6,12 | 744 | -0,80 | ||||
| 2026-02-13 | 13F | Sterling Capital Management LLC | 2.148 | -14,35 | 56 | -9,68 | ||||
| 2026-02-17 | 13F | Balyasny Asset Management Llc | 20.375 | 534 | ||||||
| 2025-11-13 | 13F | Clear Street Markets Llc | 0 | -100,00 | 0 | |||||
| 2026-02-13 | 13F | Parkside Financial Bank & Trust | 80 | 0,00 | 2 | 100,00 | ||||
| 2026-02-13 | 13F | State Street Corp | 1.475.466 | -1,44 | 38.687 | 4,16 | ||||
| 2026-02-17 | 13F | MIRAE ASSET GLOBAL ETFS HOLDINGS Ltd. | 22.136 | 0,56 | 580 | 6,23 | ||||
| 2026-02-10 | 13F | State of Wyoming | 2.788 | 73 | ||||||
| 2026-02-11 | 13F | Zions Bancorporation, National Association /ut/ | 28 | 1 | ||||||
| 2026-02-13 | 13F | Great West Life Assurance Co /can/ | 3.451 | 0,00 | 0 | |||||
| 2026-02-12 | 13F | Voya Investment Management Llc | 149.800 | -13,61 | 3.928 | -8,72 | ||||
| 2026-01-16 | 13F | PFS Partners, LLC | 303 | 0,00 | 8 | 0,00 | ||||
| 2026-01-28 | 13F | Universal- Beteiligungs- und Servicegesellschaft mbH | 23.080 | 14,53 | 605 | 21,24 | ||||
| 2026-02-13 | 13F | Kestra Advisory Services, LLC | 0 | -100,00 | 0 | |||||
| 2026-02-13 | 13F | Squarepoint Ops LLC | 134.132 | 11,09 | 3.517 | 17,40 | ||||
| 2026-02-10 | 13F | Eurizon Capital SGR S.p.A. | 265 | 7 | ||||||
| 2026-02-12 | 13F | State Board Of Administration Of Florida Retirement System | 13.730 | 0,00 | 360 | 5,88 | ||||
| 2026-02-10 | 13F | Acadian Asset Management Llc | 5.242 | 0 | ||||||
| 2026-02-17 | 13F | Aqr Capital Management Llc | 118.749 | -2,75 | 3.114 | 2,77 | ||||
| 2026-01-30 | 13F | State of New Jersey Common Pension Fund D | 92.016 | 4,30 | 2.413 | 10,24 | ||||
| 2026-02-17 | 13F | Engineers Gate Manager LP | 11.467 | -44,29 | 301 | -41,18 | ||||
| 2026-02-13 | 13F | Ubs Asset Management Americas Inc | 63.791 | 33,63 | 1.673 | 41,22 | ||||
| 2025-11-03 | 13F | Hussman Strategic Advisors, Inc. | 0 | -100,00 | 0 | |||||
| 2026-01-23 | 13F | Transcend Wealth Collective, Llc | 10.012 | 0,00 | 263 | 5,65 | ||||
| 2026-01-29 | 13F | Vanguard Group Inc | 2.914.268 | 2,22 | 76.412 | 8,03 | ||||
| 2026-02-17 | 13F | Bank Of America Corp /de/ | 913.232 | -7,31 | 23.945 | -2,05 | ||||
| 2026-02-17 | 13F | Wiley Bros.-aintree Capital, Llc | 20.426 | 6,70 | 536 | 12,87 | ||||
| 2026-01-12 | 13F | Salem Investment Counselors Inc | 0 | -100,00 | 0 | |||||
| 2026-02-17 | 13F | Hotchkis & Wiley Capital Management Llc | 530.812 | -0,82 | 13.918 | 4,81 | ||||
| 2026-02-17 | 13F | Boothbay Fund Management, Llc | 225.017 | -48,67 | 5.900 | -45,76 | ||||
| 2026-02-13 | 13F | Jacobs Levy Equity Management, Inc | 0 | -100,00 | 0 | |||||
| 2026-02-12 | 13F | Commonwealth Equity Services, Llc | 14.104 | -12,81 | 370 | |||||
| 2026-02-17 | 13F | Citadel Advisors Llc | 48.506 | 1.272 | ||||||
| 2026-02-05 | 13F | Bessemer Group Inc | 106 | 0 |
Other Listings
| DE:CBM | 23,00 € |