Grundlæggende statistik
| Institutionelle ejere | 34 total, 34 long only, 0 short only, 0 long/short - change of -29,17% MRQ |
| Gennemsnitlig porteføljeallokering | 0.5975 % - change of -24,76% MRQ |
| Institutionelle aktier (lange) | 9.085.799 (ex 13D/G) - change of -2,13MM shares -18,99% MRQ |
| Institutionel værdi (lang) | $ 220.035 USD ($1000) |
Institutionelt ejerskab og aktionærer
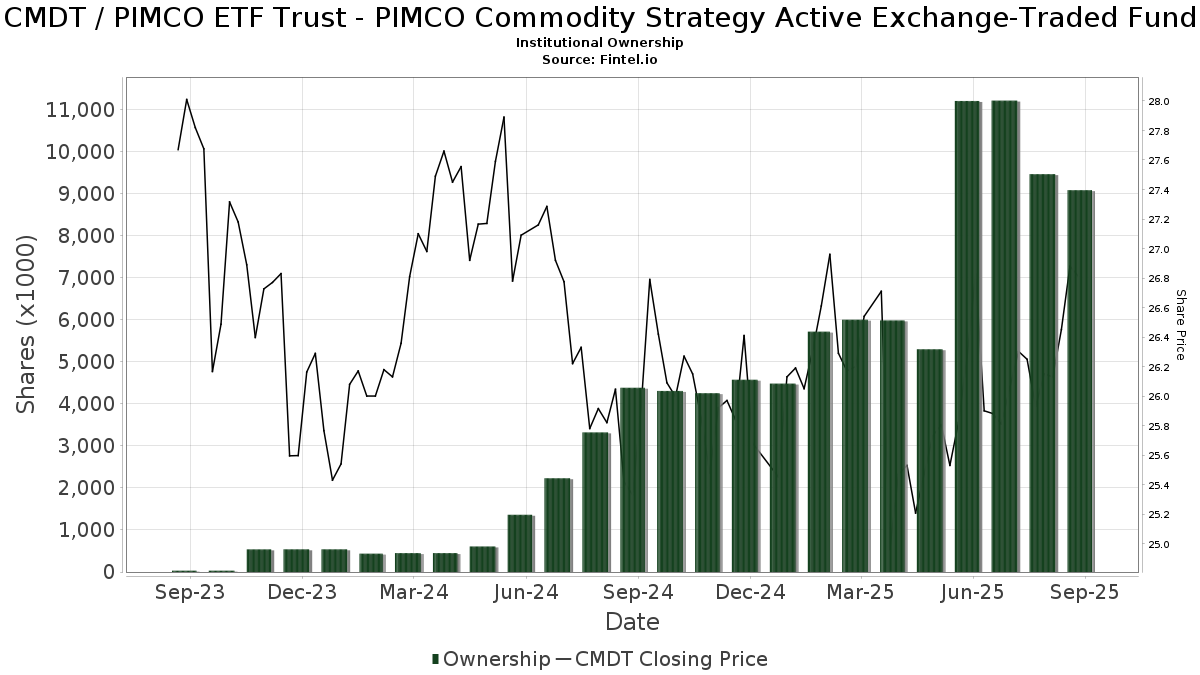
PIMCO ETF Trust - PIMCO Commodity Strategy Active Exchange-Traded Fund (US:CMDT) har 34 institutionelle ejere og aktionærer, der har indsendt 13D/G- eller 13F-formularer til Securities Exchange Commission (SEC). Disse institutioner har i alt 9,085,799 aktier. Største aktionærer omfatter Allianz Asset Management GmbH, PZRMX - PIMCO Inflation Response Multi-Asset Fund Class A, Apollon Wealth Management, LLC, TDSC - Cabana Target Drawdown 10 ETF, Wells Fargo & Company/mn, Cwm, Llc, DRAFX - Destinations Real Assets Fund Class I, Exchange Traded Concepts, Llc, Fidelity D & D Bancorp Inc, and Cambridge Investment Research Advisors, Inc. .
PIMCO ETF Trust - PIMCO Commodity Strategy Active Exchange-Traded Fund (ARCA:CMDT) institutionel ejerskabsstruktur viser aktuelle positioner i virksomheden efter institutioner og fonde, samt seneste ændringer i positionsstørrelse. Større aktionærer kan omfatte individuelle investorer, investeringsforeninger, hedgefonde eller institutioner. Skema 13D angiver, at investoren besidder (eller besidder) mere end 5 % af virksomheden og har til hensigt (eller har til hensigt at) aktivt at forfølge en ændring i forretningsstrategi. Skema 13G indikerer en passiv investering på over 5%.
The share price as of September 9, 2025 is 26,82 / share. Previously, on September 9, 2024, the share price was 25,37 / share. This represents an increase of 5,72% over that period.
Fondens stemningsscore
Fund Sentiment Score (fka Ownership Accumulation Score) finder de aktier, der bliver mest købt af fonde. Det er resultatet af en sofistikeret, multi-faktor kvantitativ model, der identificerer virksomheder med de højeste niveauer af institutionel akkumulering. Scoringsmodellen bruger en kombination af den samlede stigning i oplyste ejere, ændringerne i porteføljeallokeringer i disse ejere og andre målinger. Tallet går fra 0 til 100, hvor højere tal indikerer et højere niveau af akkumulering for sine jævnaldrende, og 50 er gennemsnittet.
Opdateringsfrekvens: Dagligt
Se Ownership Explorer, som giver en liste over højest rangerende virksomheder.
Institutionel Put/Call-forhold
Ud over at indberette standardaktie- og gældsudstedelser skal institutter med mere end 100 mill. aktiver under forvaltning også oplyse deres put- og call-optionsbeholdninger. Da salgsoptioner generelt indikerer negativ stemning, og købsoptioner indikerer positiv stemning, kan vi få en fornemmelse af den overordnede institutionelle stemning ved at plotte forholdet mellem put og kald. Diagrammet til højre viser det historiske put/call-forhold for dette instrument.
Brug af Put/Call Ratio som en indikator for investorernes stemning overvinder en af de vigtigste mangler ved at bruge totalt institutionelt ejerskab, som er, at en betydelig mængde af aktiver under forvaltning investeres passivt for at spore indekser. Passivt forvaltede fonde køber typisk ikke optioner, så indikatoren for put/call-forholdet følger mere nøje følelsen af aktivt forvaltede fonde.
13F og NPORT arkivering
Detaljer om 13F-arkivering er gratis. Detaljer om NP-ansøgninger kræver et premium-medlemskab. Grønne rækker angiver nye positioner. Røde rækker angiver lukkede positioner. Klik på linket ikon for at se den fulde transaktionshistorik.
Opgrader
for at låse premium-data op og eksportere til Excel ![]() .
.
| Fil dato | Kilde | Investor | Type | Gennemsnitlig pris (Øst) |
Aktier | Δ Aktier (%) |
Rapporteret Værdi ($1000) |
Δ Værdi (%) |
Port Alloc (%) |
|
|---|---|---|---|---|---|---|---|---|---|---|
| 2025-07-28 | 13F | Allianz Asset Management GmbH | 2.245.036 | 0,00 | 57.989 | -3,51 | ||||
| 2025-08-07 | 13F | Allworth Financial LP | 5.693 | 0,00 | 147 | 0,68 | ||||
| 2025-08-14 | 13F | Jane Street Group, Llc | 0 | -100,00 | 0 | |||||
| 2025-05-15 | 13F/A | Orion Portfolio Solutions, LLC | 18.785 | -96,46 | 503 | -96,25 | ||||
| 2025-08-19 | 13F | Advisory Services Network, LLC | 9.737 | 254 | ||||||
| 2025-07-25 | 13F | Cwm, Llc | 412.350 | 1,69 | 11 | 0,00 | ||||
| 2025-04-24 | 13F | Decker Retirement Planning Inc. | 0 | -100,00 | 0 | |||||
| 2025-04-23 | 13F | B.O.S.S. Retirement Advisors, LLC | 0 | -100,00 | 0 | -100,00 | ||||
| 2025-08-13 | 13F | Continuum Advisory, LLC | 0 | -100,00 | 0 | |||||
| 2025-09-04 | 13F/A | Advisor Group Holdings, Inc. | 2.968 | -6,31 | 77 | -9,52 | ||||
| 2025-08-12 | 13F | Proequities, Inc. | 0 | 0 | ||||||
| 2025-07-14 | 13F | Matrix Trust Co | 0 | -100,00 | 0 | |||||
| 2025-08-14 | 13F | Susquehanna International Group, Llp | 43.355 | -8,26 | 1.120 | -11,54 | ||||
| 2025-08-15 | 13F | Fidelity D & D Bancorp Inc | 166.872 | 9,70 | 4.310 | 5,84 | ||||
| 2025-07-30 | 13F | Wallace Advisory Group, LLC | 12.677 | 339 | ||||||
| 2025-07-11 | 13F | Farther Finance Advisors, LLC | 493 | 5,79 | 13 | 0,00 | ||||
| 2025-08-08 | 13F | Foundations Investment Advisors, LLC | 0 | -100,00 | 0 | |||||
| 2025-08-14 | 13F | Principia Wealth Advisory, LLC | 0 | -100,00 | 0 | |||||
| 2025-07-25 | 13F | Apollon Financial, LLC | 101.406 | 8,56 | 2.619 | 4,76 | ||||
| 2025-08-14 | 13F | Arete Wealth Advisors, LLC | 0 | -100,00 | 0 | |||||
| 2025-07-10 | 13F | Wealth Enhancement Advisory Services, Llc | 0 | -100,00 | 0 | |||||
| 2025-08-14 | 13F | Financial Network Wealth Advisors LLC | 0 | -100,00 | 0 | |||||
| 2025-07-31 | 13F | Cambridge Investment Research Advisors, Inc. | 156.440 | 0,37 | 4 | 0,00 | ||||
| 2025-07-15 | 13F | Mather Group, Llc. | 0 | -100,00 | 0 | |||||
| 2025-08-11 | 13F | M Wealth Management, LLC | 0 | -100,00 | 0 | |||||
| 2025-08-06 | 13F | AE Wealth Management LLC | 24.368 | 3,29 | 629 | -0,32 | ||||
| 2025-07-22 | NP | DRAFX - Destinations Real Assets Fund Class I | 347.407 | -27,82 | 8.803 | -29,40 | ||||
| 2025-08-05 | 13F | Lord & Richards Wealth Management, LLC | 0 | -100,00 | 0 | |||||
| 2025-08-13 | 13F | Cerity Partners LLC | 0 | -100,00 | 0 | |||||
| 2025-05-14 | 13F | Eqis Capital Management, Inc. | 0 | -100,00 | 0 | -100,00 | ||||
| 2025-08-18 | 13F | Hollencrest Capital Management | 138.801 | 0,68 | 3.585 | -2,85 | ||||
| 2025-07-21 | 13F | Ameritas Advisory Services, LLC | 2.307 | 60 | ||||||
| 2025-08-14 | 13F | CoreCap Advisors, LLC | 681 | 18 | ||||||
| 2025-04-14 | 13F | Lloyd Advisory Services, LLC. | 0 | -100,00 | 0 | |||||
| 2025-05-12 | 13F | Fmr Llc | 0 | -100,00 | 0 | |||||
| 2025-08-14 | 13F | Alliance Wealth Advisors, LLC /UT | 0 | -100,00 | 0 | |||||
| 2025-05-12 | 13F | Independent Advisor Alliance | 0 | -100,00 | 0 | |||||
| 2025-08-15 | 13F | Morgan Stanley | 487 | 214,19 | 13 | 200,00 | ||||
| 2025-08-07 | 13F | Authentikos Wealth Advisory, LLC | 0 | -100,00 | 0 | |||||
| 2025-08-14 | 13F | Mpwm Advisory Solutions, Llc | 724 | 0,00 | 19 | -5,26 | ||||
| 2025-05-12 | 13F | Richard W. Paul & Associates, LLC | 0 | -100,00 | 0 | |||||
| 2025-07-16 | 13F | Blue Oak Capital, LLC | 0 | -100,00 | 0 | |||||
| 2025-08-05 | 13F | Prosperity Consulting Group, LLC | 0 | -100,00 | 0 | |||||
| 2025-08-28 | NP | PZRMX - PIMCO Inflation Response Multi-Asset Fund Class A | 2.245.036 | 0,00 | 57.989 | -3,51 | ||||
| 2025-08-11 | 13F | Principal Securities, Inc. | 45 | 0,00 | 1 | 0,00 | ||||
| 2025-08-15 | 13F | Kestra Advisory Services, LLC | 8.596 | 222 | ||||||
| 2025-08-28 | NP | EDGH - 3EDGE Dynamic Hard Assets ETF | 0 | -100,00 | 0 | -100,00 | ||||
| 2025-04-17 | 13F | Great Lakes Retirement, Inc. | 0 | -100,00 | 0 | |||||
| 2025-07-15 | 13F | Elevated Capital Advisors, LLC | 23.102 | 0,00 | 618 | 0,00 | ||||
| 2025-08-12 | 13F | LPL Financial LLC | 47.053 | 103,92 | 1.215 | 96,92 | ||||
| 2025-04-30 | 13F | Pineridge Advisors LLC | 0 | -100,00 | 0 | |||||
| 2025-05-01 | 13F | Quest 10 Wealth Builders, Inc. | 0 | -100,00 | 0 | |||||
| 2025-08-12 | 13F | Park Square Financial Group, LLC | 0 | -100,00 | 0 | |||||
| 2025-07-31 | 13F | 3EDGE Asset Management, LP | 0 | -100,00 | 0 | |||||
| 2025-05-02 | 13F | Capital A Wealth Management, LLC | 0 | -100,00 | 0 | |||||
| 2025-05-05 | 13F | Transce3nd, LLC | 0 | -100,00 | 0 | |||||
| 2025-04-17 | 13F | Howard Bailey Securities, Llc | 0 | -100,00 | 0 | |||||
| 2025-08-27 | 13F/A | Brinker Capital Investments, LLC | 15.482 | -17,58 | 400 | -20,52 | ||||
| 2025-08-13 | 13F | Certior Financial Group, Llc | 0 | -100,00 | 0 | |||||
| 2025-03-20 | NP | TDSC - Cabana Target Drawdown 10 ETF | 625.620 | -8,08 | 16.316 | -7,83 | ||||
| 2025-08-13 | 13F | Townsquare Capital Llc | 0 | -100,00 | 0 | |||||
| 2025-07-24 | 13F | Lokken Investment Group LLC | 147.222 | 5,21 | 3.803 | 1,52 | ||||
| 2025-07-30 | 13F | Mid-American Wealth Advisory Group, Inc. | 25 | 1 | ||||||
| 2025-08-11 | 13F | Portside Wealth Group, LLC | 0 | -100,00 | 0 | |||||
| 2025-07-10 | 13F | Exchange Traded Concepts, Llc | 279.909 | -63,18 | 7.230 | -64,48 | ||||
| 2025-08-14 | 13F | Wells Fargo & Company/mn | 509.918 | 71,43 | 13.171 | 65,42 | ||||
| 2025-08-12 | 13F | Global Retirement Partners, LLC | 81 | 2 | ||||||
| 2025-08-13 | 13F | GeoWealth Management, LLC | 16.155 | -51,13 | 417 | -52,83 | ||||
| 2025-07-25 | 13F | Apollon Wealth Management, LLC | 1.468.806 | 0,16 | 37.939 | -3,36 | ||||
| 2025-08-27 | 13F | Barnes Wealth Management Group, Inc | 8.162 | 3,19 | 211 | -0,47 |