Grundlæggende statistik
| Institutionelle ejere | 111 total, 111 long only, 0 short only, 0 long/short - change of 2,78% MRQ |
| Gennemsnitlig porteføljeallokering | 0.5969 % - change of -18,76% MRQ |
| Institutionelle aktier (lange) | 15.038.039 (ex 13D/G) - change of -1,15MM shares -7,09% MRQ |
| Institutionel værdi (lang) | $ 378.617 USD ($1000) |
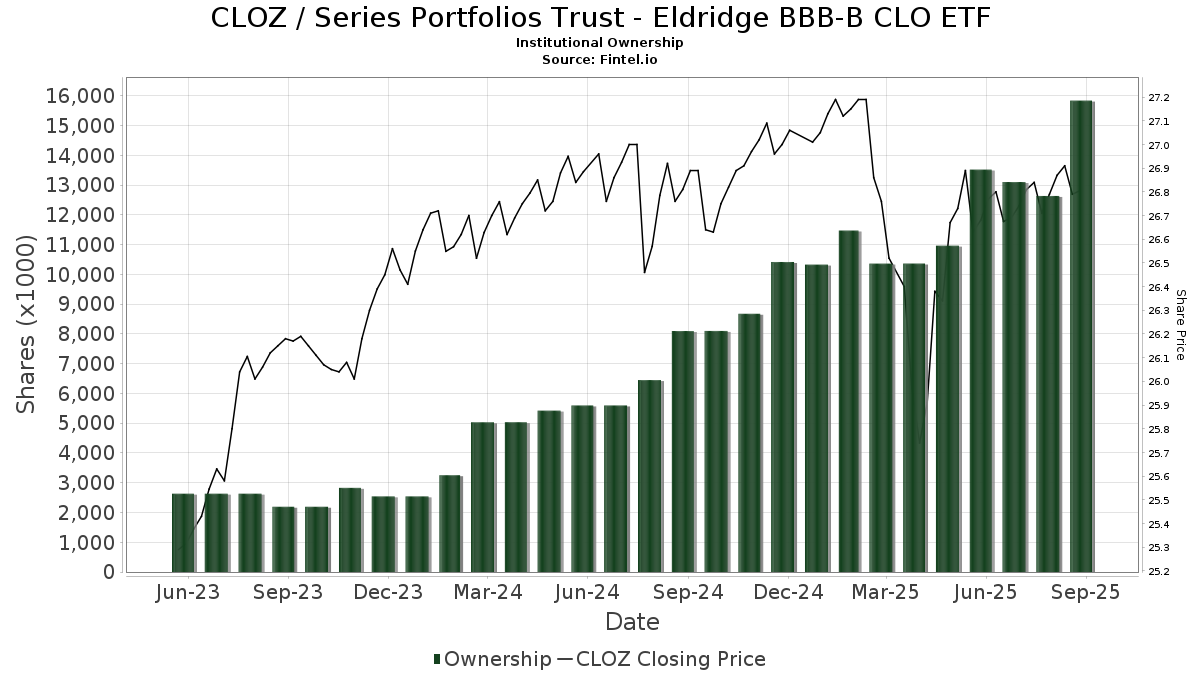
Institutionelt ejerskab og aktionærer
Series Portfolios Trust - Eldridge BBB-B CLO ETF (US:CLOZ) har 111 institutionelle ejere og aktionærer, der har indsendt 13D/G- eller 13F-formularer til Securities Exchange Commission (SEC). Disse institutioner har i alt 15,038,039 aktier. Største aktionærer omfatter SRS Capital Advisors, Inc., Security Benefit Life Insurance Co /ks/, Colony Group, LLC, Estate Planners Group, LLC, Guardian Financial Partners, LLC, Goldman Sachs Group Inc, LPL Financial LLC, Jane Street Group, Llc, Black Swift Group, LLC, and Wright Fund Managment, LLC .
Series Portfolios Trust - Eldridge BBB-B CLO ETF (ARCA:CLOZ) institutionel ejerskabsstruktur viser aktuelle positioner i virksomheden efter institutioner og fonde, samt seneste ændringer i positionsstørrelse. Større aktionærer kan omfatte individuelle investorer, investeringsforeninger, hedgefonde eller institutioner. Skema 13D angiver, at investoren besidder (eller besidder) mere end 5 % af virksomheden og har til hensigt (eller har til hensigt at) aktivt at forfølge en ændring i forretningsstrategi. Skema 13G indikerer en passiv investering på over 5%.
The share price as of April 13, 2026 is 25,78 / share. Previously, on April 14, 2025, the share price was 25,78 / share. This represents an increase of 0,00% over that period.
Fondens stemningsscore
Fund Sentiment Score (fka Ownership Accumulation Score) finder de aktier, der bliver mest købt af fonde. Det er resultatet af en sofistikeret, multi-faktor kvantitativ model, der identificerer virksomheder med de højeste niveauer af institutionel akkumulering. Scoringsmodellen bruger en kombination af den samlede stigning i oplyste ejere, ændringerne i porteføljeallokeringer i disse ejere og andre målinger. Tallet går fra 0 til 100, hvor højere tal indikerer et højere niveau af akkumulering for sine jævnaldrende, og 50 er gennemsnittet.
Opdateringsfrekvens: Dagligt
Se Ownership Explorer, som giver en liste over højest rangerende virksomheder.
AI+ Ask Fintel’s AI assistant about Series Portfolios Trust - Eldridge BBB-B CLO ETF.
Select a question to share a public post with an AI-crafted answer.
Thinking of good questions…
Institutionel Put/Call-forhold
Ud over at indberette standardaktie- og gældsudstedelser skal institutter med mere end 100 mill. aktiver under forvaltning også oplyse deres put- og call-optionsbeholdninger. Da salgsoptioner generelt indikerer negativ stemning, og købsoptioner indikerer positiv stemning, kan vi få en fornemmelse af den overordnede institutionelle stemning ved at plotte forholdet mellem put og kald. Diagrammet til højre viser det historiske put/call-forhold for dette instrument.
Brug af Put/Call Ratio som en indikator for investorernes stemning overvinder en af de vigtigste mangler ved at bruge totalt institutionelt ejerskab, som er, at en betydelig mængde af aktiver under forvaltning investeres passivt for at spore indekser. Passivt forvaltede fonde køber typisk ikke optioner, så indikatoren for put/call-forholdet følger mere nøje følelsen af aktivt forvaltede fonde.
13F og NPORT arkivering
Detaljer om 13F-arkivering er gratis. Detaljer om NP-ansøgninger kræver et premium-medlemskab. Grønne rækker angiver nye positioner. Røde rækker angiver lukkede positioner. Klik på linket ikon for at se den fulde transaktionshistorik.
Opgrader
for at låse premium-data op og eksportere til Excel ![]() .
.
| Fil dato | Kilde | Investor | Type | Gennemsnitlig pris (Øst) |
Aktier | Δ Aktier (%) |
Rapporteret Værdi ($1000) |
Δ Værdi (%) |
Port Alloc (%) |
|
|---|---|---|---|---|---|---|---|---|---|---|
| 2026-01-20 | 13F | Ethos Financial Group, LLC | 77.656 | 138,41 | 2.069 | 136,88 | ||||
| 2026-02-06 | 13F | Cedar Wealth Management, LLC | 96.781 | -3,68 | 2.563 | -4,90 | ||||
| 2026-02-10 | 13F | Impact Partnership Wealth, LLC | 65.971 | 9,48 | 1.747 | 8,04 | ||||
| 2026-02-13 | 13F | Mariner, LLC | 171.506 | 3,93 | 4.541 | 2,62 | ||||
| 2026-02-02 | 13F | Fifth Third Bancorp | 0 | -100,00 | 0 | |||||
| 2026-01-26 | 13F | CWC Advisors, LLC. | 141.217 | 6,92 | 3.739 | 5,56 | ||||
| 2026-02-03 | 13F | Sequoia Financial Advisors, LLC | 12.423 | 1,90 | 329 | 0,61 | ||||
| 2026-02-12 | 13F | Virtue Capital Management, LLC | 5.036 | -19,06 | 785 | -11,20 | ||||
| 2026-02-03 | 13F | Primoris Wealth Advisors, Llc | 51.450 | 0,00 | 1.362 | -1,23 | ||||
| 2026-04-13 | 13F | Mather Group, Llc. | 19.565 | 502 | ||||||
| 2026-02-11 | 13F | LPL Financial LLC | 583.344 | 15.447 | ||||||
| 2026-02-04 | 13F/A | Nwam Llc | 0 | -100,00 | 0 | |||||
| 2026-02-13 | 13F | Stifel Financial Corp | 288.558 | 36,51 | 7.641 | 34,79 | ||||
| 2026-04-10 | 13F | Brucke Financial, Inc. | 21.605 | -44,85 | 554 | -46,58 | ||||
| 2026-02-09 | 13F | Claudia M.p. Batlle, Crp (r) Llc | 22.478 | -32,72 | 595 | -33,59 | ||||
| 2026-01-29 | 13F | Carmel Capital Partners, LLC | 244.829 | 15,78 | 6.483 | 14,32 | ||||
| 2026-02-13 | 13F | Mml Investors Services, Llc | 9.891 | 4,69 | 262 | 3,16 | ||||
| 2026-02-17 | 13F | Gladstone Institutional Advisory LLC | 36.132 | -15,91 | 957 | -17,01 | ||||
| 2026-02-12 | 13F | Renaissance Technologies Llc | 44.256 | -74,76 | 1.172 | -75,10 | ||||
| 2026-02-12 | 13F | Bank Of Montreal /can/ | 18.177 | -33,47 | 481 | -34,29 | ||||
| 2025-11-14 | 13F | Mount Yale Investment Advisors, LLC | 0 | -100,00 | 0 | -100,00 | ||||
| 2026-02-10 | 13F | Envestnet Asset Management Inc | 194.156 | -3,39 | 5.141 | -4,62 | ||||
| 2026-02-17 | 13F | Citadel Advisors Llc | 102.908 | 45,02 | 2.725 | 43,19 | ||||
| 2026-01-26 | 13F | Private Trust Co Na | 16.051 | 425 | ||||||
| 2026-01-16 | 13F | Morris Retirement Advisors, LLC | 8.166 | 216 | ||||||
| 2026-01-15 | 13F | Brookstone Capital Management | 12.258 | -96,85 | 325 | -96,90 | ||||
| 2026-02-17 | 13F | National Asset Management, Inc. | 20.997 | -8,49 | 556 | -9,59 | ||||
| 2026-02-12 | 13F | Triumph Capital Management | 175 | 10,06 | 5 | 0,00 | ||||
| 2026-01-30 | 13F | Verity Asset Management, Inc. | 13.796 | -66,56 | 365 | -67,00 | ||||
| 2026-02-13 | 13F | MAI Capital Management | 4.275 | 0,00 | 113 | -0,88 | ||||
| 2026-02-11 | 13F | Parallel Advisors, LLC | 0 | -100,00 | 0 | |||||
| 2026-02-03 | 13F | Koshinski Asset Management, Inc. | 12.219 | -20,19 | 324 | -21,22 | ||||
| 2026-02-09 | 13F | Harbour Investments, Inc. | 12.376 | 0,22 | 328 | -1,21 | ||||
| 2025-11-14 | 13F | Manchester Capital Management LLC | 0 | -100,00 | 0 | |||||
| 2026-01-14 | 13F | Chris Bulman Inc | 0 | -100,00 | 0 | |||||
| 2026-03-04 | 13F | SHP Wealth Management | 101 | 3 | ||||||
| 2026-02-02 | 13F | Truist Financial Corp | 196.507 | -2,29 | 5.204 | -3,52 | ||||
| 2026-02-19 | 13F | Claris Financial LLC | 32.700 | -33,51 | 866 | -34,37 | ||||
| 2026-02-06 | 13F | Copia Wealth Management | 111.427 | 54,65 | 2.951 | 52,69 | ||||
| 2026-02-17 | 13F | Tower Research Capital LLC (TRC) | 201.580 | 397,37 | 5.338 | 391,44 | ||||
| 2026-01-14 | 13F | Worth Asset Management, LLC | 26.818 | 209,25 | 710 | 206,03 | ||||
| 2026-04-07 | 13F | Farther Finance Advisors, LLC | 101.087 | 167,13 | 2.606 | 160,08 | ||||
| 2026-04-06 | 13F | Highline Wealth Partners Llc | 0 | -100,00 | 0 | |||||
| 2026-02-12 | 13F | Hrt Financial Lp | 0 | -100,00 | 0 | |||||
| 2026-02-17 | 13F | Private Advisor Group, LLC | 44.203 | 87,90 | 1.170 | 85,71 | ||||
| 2026-02-12 | 13F | Steward Partners Investment Advisory, Llc | 7.266 | 1.353,20 | 192 | 1.376,92 | ||||
| 2026-02-06 | 13F | Griffin Asset Management, Inc. | 25.554 | -18,73 | 677 | -19,81 | ||||
| 2026-02-04 | 13F | Valeo Financial Advisors, LLC | 123.764 | 0,00 | 3.277 | -1,27 | ||||
| 2026-01-28 | 13F | WMG Financial Advisors, LLC | 139.988 | 61,82 | 3.707 | 59,74 | ||||
| 2026-02-05 | 13F | Allworth Financial LP | 1.700 | 0,00 | 45 | 0,00 | ||||
| 2026-02-13 | 13F | Vontobel Holding Ltd. | 8.000 | 0,00 | 212 | -1,40 | ||||
| 2026-02-06 | 13F | New Millennium Group LLC | 35 | 0,00 | 1 | |||||
| 2026-01-26 | 13F | AE Wealth Management LLC | 36.857 | -12,13 | 976 | -13,26 | ||||
| 2026-02-10 | 13F | Natixis Advisors, L.p. | 0 | -100,00 | 0 | |||||
| 2026-01-09 | 13F | Tactive Advisors, LLC | 13.952 | -12,56 | 369 | -13,58 | ||||
| 2026-01-27 | 13F | Elevated Capital Advisors, LLC | 17.343 | -1,35 | 459 | -2,55 | ||||
| 2026-02-13 | 13F | Ausdal Financial Partners, Inc. | 19.220 | 65,82 | 509 | 63,87 | ||||
| 2025-10-30 | 13F | Triad Wealth Partners, LLC | 0 | -100,00 | 0 | |||||
| 2026-02-03 | 13F | Security Benefit Life Insurance Co /ks/ | 1.625.576 | 0,00 | 43.045 | -1,27 | ||||
| 2026-02-13 | 13F | Gts Securities Llc | 11.874 | 314 | ||||||
| 2026-01-14 | 13F | Guardian Financial Partners, LLC | 735.819 | -4,86 | 19.484 | -6,07 | ||||
| 2026-02-13 | 13F | Morgan Stanley | 1.017 | -9,52 | 27 | -13,33 | ||||
| 2026-02-17 | 13F | Bank Of America Corp /de/ | 96.741 | 2.562 | ||||||
| 2026-01-07 | 13F | Baldwin Brothers Inc/ma | 25.598 | -7,05 | 678 | -8,27 | ||||
| 2026-02-12 | 13F | Insigneo Advisory Services, Llc | 9.363 | 248 | ||||||
| 2026-01-21 | 13F | Sound Income Strategies, LLC | 217.449 | 50,99 | 5.802 | 50,99 | ||||
| 2026-02-20 | 13F | Kovitz Investment Group Partners, LLC | 0 | -100,00 | 0 | |||||
| 2026-01-21 | 13F | Newbridge Financial Services Group, Inc. | 1.679 | -93,96 | 44 | -94,10 | ||||
| 2026-02-13 | 13F | Navis Wealth Advisors, LLC | 19.259 | 510 | ||||||
| 2025-11-12 | 13F | Principal Securities, Inc. | 0 | -100,00 | 0 | -100,00 | ||||
| 2026-01-21 | 13F | Sowell Financial Services LLC | 155.101 | 1,85 | 4.107 | 0,56 | ||||
| 2026-02-06 | 13F | HighTower Advisors, LLC | 106.885 | -17,15 | 2.830 | -18,21 | ||||
| 2026-02-11 | 13F | BI Asset Management Fondsmaeglerselskab A/S | 18.140 | 0 | ||||||
| 2026-02-10 | 13F | Essex Financial Services, Inc. | 32.962 | 46,56 | 873 | 44,61 | ||||
| 2026-02-02 | 13F | Mutual Advisors, LLC | 9.500 | -1,47 | 252 | -1,95 | ||||
| 2026-02-17 | 13F | Basso Capital Management, L.p. | 71.589 | 28,43 | 1.896 | 26,84 | ||||
| 2026-02-17 | 13F | Advisor Group Holdings, Inc. | 24.331 | 6,25 | 644 | 5,06 | ||||
| 2026-02-12 | 13F | Commonwealth Equity Services, Llc | 16.925 | 19,11 | 448 | |||||
| 2026-01-23 | 13F | Assetmark, Inc | 300 | 0,00 | 8 | -12,50 | ||||
| 2025-11-04 | 13F | Pineridge Advisors LLC | 255 | -15,00 | 7 | -25,00 | ||||
| 2026-02-06 | 13F | Rockport Wealth LLC | 114.221 | 20,37 | 3.025 | 18,82 | ||||
| 2026-01-29 | 13F | Almanack Investment Partners, LLC. | 69.351 | -51,45 | 1.836 | -52,08 | ||||
| 2026-02-11 | 13F | Janney Montgomery Scott LLC | 47.966 | 1 | ||||||
| 2026-02-13 | 13F | Inspire Advisors, LLC | 46.760 | 66,65 | 1.238 | 64,63 | ||||
| 2026-01-23 | 13F | Ball & Co Wealth Management Inc. | 257.290 | -31,31 | 7 | -40,00 | ||||
| 2026-02-17 | 13F | Prostatis Group LLC | 12.151 | 322 | ||||||
| 2026-02-17 | 13F | Royal Bank Of Canada | 12.366 | -48,86 | 328 | -49,46 | ||||
| 2026-04-08 | 13F | High Point Wealth Management, LLC | 150 | 2,04 | 4 | 0,00 | ||||
| 2026-02-13 | 13F | Wells Fargo & Company/mn | 1 | 0 | ||||||
| 2025-11-12 | 13F | Barclays Plc | 0 | -100,00 | 0 | |||||
| 2026-01-30 | 13F | State of New Jersey Common Pension Fund D | 300.000 | 0,00 | 7.944 | -1,27 | ||||
| 2026-02-17 | 13F | Bienville Capital Management, LLC | 222.201 | 0,60 | 5.920 | -0,05 | ||||
| 2026-02-10 | 13F | Goldman Sachs Group Inc | 603.013 | -57,77 | 15.968 | -58,30 | ||||
| 2026-02-12 | 13F | Wealthspire Advisors, LLC | 12.922 | 0,00 | 342 | -1,16 | ||||
| 2026-02-13 | 13F | Flow Traders U.s. Llc | 310.113 | 94,40 | 8 | 100,00 | ||||
| 2025-11-12 | 13F | Hohimer Wealth Management, Llc | 0 | -100,00 | 0 | |||||
| 2026-01-29 | 13F | Spurstone Advisory Services, LLC | 14 | 0,00 | 0 | |||||
| 2026-04-07 | 13F | Estate Planners Group, LLC | 744.969 | 19.727 | ||||||
| 2026-02-03 | 13F | Nordwand Advisors, LLC | 22.600 | 0,00 | 598 | -1,32 | ||||
| 2026-02-13 | 13F | Colony Group, LLC | 1.304.334 | 34.741 | ||||||
| 2026-02-12 | 13F | Laurel Oak Wealth Management, Llc | 42.998 | 1.139 | ||||||
| 2026-01-08 | 13F | Maridea Wealth Management LLC | 109.521 | 30,39 | 2.900 | 29,87 | ||||
| 2026-02-05 | 13F | Cambridge Investment Research Advisors, Inc. | 27.394 | 28,82 | 1 | |||||
| 2026-02-17 | 13F | Hilltop Holdings Inc. | 70.700 | 68,74 | 1.872 | 66,70 | ||||
| 2026-02-12 | 13F | Knott David M Jr | 47.807 | 0,00 | 1.266 | -1,33 | ||||
| 2026-01-22 | 13F/A | Cresset Asset Management, LLC | 0 | -100,00 | 0 | |||||
| 2026-01-26 | 13F | Reyes Financial Architecture, Inc. | 280 | 4,48 | 7 | 0,00 | ||||
| 2026-01-26 | 13F | Cwm, Llc | 346 | -14,57 | 0 | |||||
| 2025-11-12 | 13F | Napa Wealth Management | 18.085 | 2,26 | 485 | 2,75 | ||||
| 2025-11-14 | 13F | Old Mission Capital Llc | 0 | -100,00 | 0 | |||||
| 2026-01-29 | 13F | UBS Group AG | 27.763 | 147,11 | 735 | 144,19 | ||||
| 2026-02-10 | 13F | Black Swift Group, LLC | 394.659 | -36,97 | 7.779 | -53,68 | ||||
| 2026-02-03 | 13F | We Are One Seven, LLC | 30.168 | -3,40 | 799 | -4,66 | ||||
| 2026-02-13 | 13F | SRS Capital Advisors, Inc. | 2.010.327 | -0,62 | 53.233 | -1,88 | ||||
| 2025-11-06 | 13F | Abich Financial Wealth Management LLC | 632 | 17 | ||||||
| 2026-04-13 | 13F | Gradient Investments LLC | 294.190 | 3,02 | 7.546 | -0,22 | ||||
| 2026-02-13 | 13F | Advyzon Investment Management, LLC | 15.438 | 409 | ||||||
| 2025-11-14 | 13F | VestGen Advisors, LLC | 0 | -100,00 | 0 | |||||
| 2025-11-26 | 13F/A | Jpmorgan Chase & Co | 58.889 | 1.579 | ||||||
| 2026-01-15 | 13F | Wright Fund Managment, LLC | 364.527 | -9,62 | 9.653 | -10,77 | ||||
| 2026-02-12 | 13F | Skopos Labs, Inc. | 46.138 | 1.222 | ||||||
| 2025-10-20 | 13F | Mid-American Wealth Advisory Group, Inc. | 0 | -100,00 | 0 | |||||
| 2026-04-10 | 13F | Insight Wealth Strategies, LLC | 0 | -100,00 | 0 | |||||
| 2026-02-13 | 13F | Integrated Wealth Concepts LLC | 15.951 | 422 | ||||||
| 2026-02-05 | 13F | Atria Investments Llc | 170.020 | -6,45 | 4.502 | -7,63 | ||||
| 2026-02-13 | 13F | Kestra Advisory Services, LLC | 0 | -100,00 | 0 | |||||
| 2026-03-17 | 13F | Stance Capital Llc | 0 | -100,00 | 0 | |||||
| 2026-02-12 | 13F | Jane Street Group, Llc | 530.707 | 747,48 | 14.053 | 736,99 | ||||
| 2026-02-12 | 13F | CIBC Private Wealth Group, LLC | 3.793 | 1,91 | 100 | 1,01 | ||||
| 2026-02-06 | 13F | Fortis Group Advisors, LLC | 16.536 | 443 | ||||||
| 2026-02-05 | 13F | Tucker Asset Management Llc | 896 | 24 | ||||||
| 2026-02-09 | 13F | Darden Wealth Group Inc | 63.135 | 18,08 | 1.672 | 16,61 |