Grundlæggende statistik
| Institutionelle ejere | 175 total, 173 long only, 0 short only, 2 long/short - change of -33,08% MRQ |
| Gennemsnitlig porteføljeallokering | 0.1199 % - change of 137,11% MRQ |
| Institutionelle aktier (lange) | 32.109.251 (ex 13D/G) - change of -1,69MM shares -5,01% MRQ |
| Institutionel værdi (lang) | $ 201.757 USD ($1000) |
Institutionelt ejerskab og aktionærer
City Office REIT, Inc. (US:CIO) har 175 institutionelle ejere og aktionærer, der har indsendt 13D/G- eller 13F-formularer til Securities Exchange Commission (SEC). Disse institutioner har i alt 32,109,251 aktier. Største aktionærer omfatter BlackRock, Inc., Newtyn Management, LLC, Glazer Capital, Llc, Vanguard Group Inc, Trium Capital LLP, FIL Ltd, Nomura Holdings Inc, Gabelli Funds Llc, Magnetar Financial LLC, and Geode Capital Management, Llc .
City Office REIT, Inc. (NYSE:CIO) institutionel ejerskabsstruktur viser aktuelle positioner i virksomheden efter institutioner og fonde, samt seneste ændringer i positionsstørrelse. Større aktionærer kan omfatte individuelle investorer, investeringsforeninger, hedgefonde eller institutioner. Skema 13D angiver, at investoren besidder (eller besidder) mere end 5 % af virksomheden og har til hensigt (eller har til hensigt at) aktivt at forfølge en ændring i forretningsstrategi. Skema 13G indikerer en passiv investering på over 5%.
The share price as of January 9, 2026 is 0,00 / share. Previously, on March 18, 2025, the share price was 5,10 / share. This represents a decline of 100,00% over that period.

Fondens stemningsscore
Fund Sentiment Score (fka Ownership Accumulation Score) finder de aktier, der bliver mest købt af fonde. Det er resultatet af en sofistikeret, multi-faktor kvantitativ model, der identificerer virksomheder med de højeste niveauer af institutionel akkumulering. Scoringsmodellen bruger en kombination af den samlede stigning i oplyste ejere, ændringerne i porteføljeallokeringer i disse ejere og andre målinger. Tallet går fra 0 til 100, hvor højere tal indikerer et højere niveau af akkumulering for sine jævnaldrende, og 50 er gennemsnittet.
Opdateringsfrekvens: Dagligt
Se Ownership Explorer, som giver en liste over højest rangerende virksomheder.
AI+ Ask Fintel’s AI assistant about City Office REIT, Inc..
Select a question to share a public post with an AI-crafted answer.
Thinking of good questions…
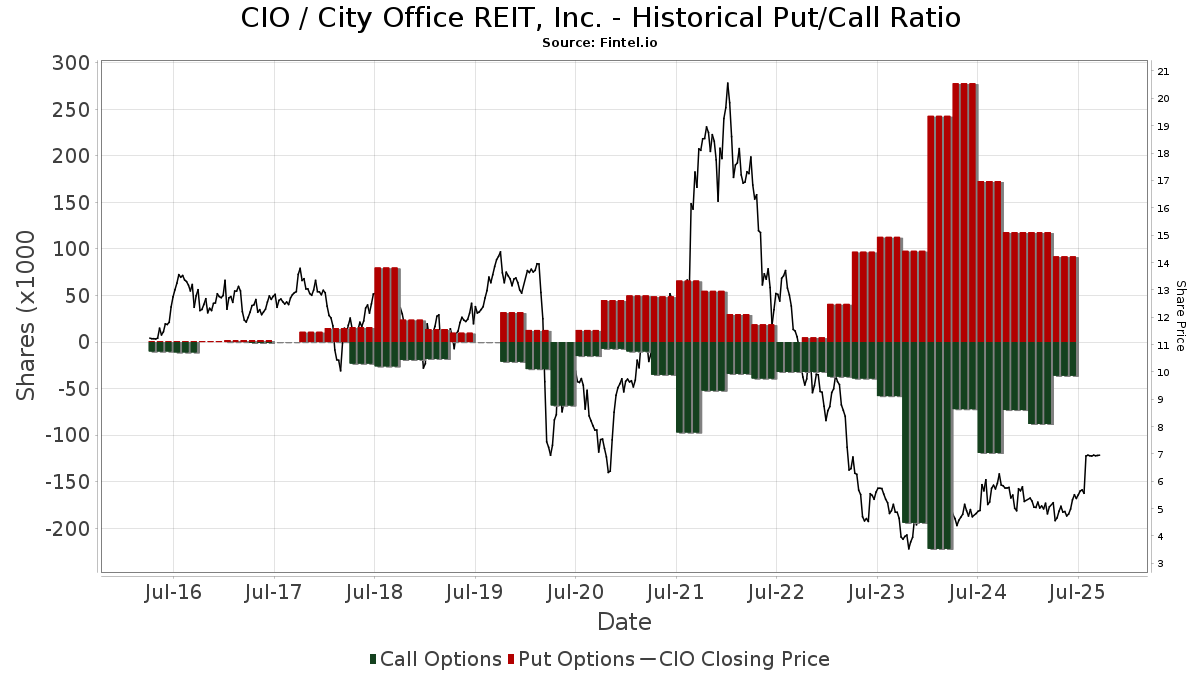
Institutionel Put/Call-forhold
Ud over at indberette standardaktie- og gældsudstedelser skal institutter med mere end 100 mill. aktiver under forvaltning også oplyse deres put- og call-optionsbeholdninger. Da salgsoptioner generelt indikerer negativ stemning, og købsoptioner indikerer positiv stemning, kan vi få en fornemmelse af den overordnede institutionelle stemning ved at plotte forholdet mellem put og kald. Diagrammet til højre viser det historiske put/call-forhold for dette instrument.
Brug af Put/Call Ratio som en indikator for investorernes stemning overvinder en af de vigtigste mangler ved at bruge totalt institutionelt ejerskab, som er, at en betydelig mængde af aktiver under forvaltning investeres passivt for at spore indekser. Passivt forvaltede fonde køber typisk ikke optioner, så indikatoren for put/call-forholdet følger mere nøje følelsen af aktivt forvaltede fonde.
13D/G-arkivering
Vi præsenterer 13D/G ansøgninger separat fra 13F ansøgninger på grund af den forskellige behandling af SEC. 13D/G-ansøgninger kan indgives af grupper af investorer (med én ledende), hvorimod 13F-ansøgninger ikke kan. Dette resulterer i situationer, hvor en investor kan indsende en 13D/G, der rapporterer én værdi for de samlede aktier (der repræsenterer alle de aktier, der ejes af investorgruppen), men derefter indsender en 13F, der rapporterer en anden værdi for de samlede aktier (der udelukkende repræsenterer deres egne) ejendomsret). Det betyder, at aktieejerskab af 13D/G-arkiver og 13F-arkiveringer ofte ikke er direkte sammenlignelige, så vi præsenterer dem separat.
Bemærk: Fra den 16. maj 2021 viser vi ikke længere ejere, der ikke har indsendt en 13D/G inden for det seneste år. Tidligere viste vi den fulde historie af 13D/G-arkiver. Generelt skal enheder, der er forpligtet til at indgive 13D/G-ansøgninger, indgive mindst årligt, før de indsender en afsluttende ansøgning. Dog forlader fonde nogle gange positioner uden at indsende en afsluttende ansøgning (dvs. de afvikler), så visning af den fulde historie resulterede nogle gange i forvirring om det nuværende ejerskab. For at undgå forvirring viser vi nu kun 'aktuelle' ejere - det vil sige - ejere, der har anmeldt inden for det seneste år.
Upgrade to unlock premium data.
| Fil dato | Form | Investor | Forrige Aktier |
Seneste Aktier |
Δ Aktier (Procent) |
Ejendomsret (Procent) |
Δ Ejerskab (Procent) |
|
|---|---|---|---|---|---|---|---|---|
| 2026-02-17 | Newtyn Management, LLC | 3,938,000 | 2,800,000 | -28.90 | 6.90 | -29.59 | ||
| 2025-10-23 | GLAZER CAPITAL, LLC | 2,412,926 | 5.98 |
13F og NPORT arkivering
Detaljer om 13F-arkivering er gratis. Detaljer om NP-ansøgninger kræver et premium-medlemskab. Grønne rækker angiver nye positioner. Røde rækker angiver lukkede positioner. Klik på linket ikon for at se den fulde transaktionshistorik.
Opgrader
for at låse premium-data op og eksportere til Excel ![]() .
.
| Fil dato | Kilde | Investor | Type | Gennemsnitlig pris (Øst) |
Aktier | Δ Aktier (%) |
Rapporteret Værdi ($1000) |
Δ Værdi (%) |
Port Alloc (%) |
|
|---|---|---|---|---|---|---|---|---|---|---|
| 2026-02-09 | 13F | Fidelis Capital Partners, LLC | 12.956 | -0,09 | 91 | 0,00 | ||||
| 2026-02-13 | 13F | Manufacturers Life Insurance Company, The | 0 | -100,00 | 0 | |||||
| 2026-02-13 | 13F | JustInvest LLC | 24.361 | -1,78 | 170 | -1,16 | ||||
| 2026-02-17 | 13F | Boothbay Fund Management, Llc | 27.850 | 138,34 | 195 | 139,51 | ||||
| 2026-02-13 | 13F | Sterling Capital Management LLC | 2.254 | -16,49 | 16 | -16,67 | ||||
| 2026-01-20 | 13F | Harbor Capital Advisors, Inc. | 715 | -1,65 | 0 | |||||
| 2026-02-10 | 13F | Rothschild Investment Llc | 325 | 0,00 | 2 | 0,00 | ||||
| 2025-11-14 | 13F | Cubist Systematic Strategies, LLC | 14.748 | 103 | ||||||
| 2026-02-17 | 13F | Highland Capital Management Fund Advisors, L.p. | 0 | -100,00 | 0 | |||||
| 2026-02-11 | 13F | Group One Trading, L.p. | 3.040 | 4,36 | 21 | 5,00 | ||||
| 2026-02-11 | 13F | Group One Trading, L.p. | Call | 4.900 | -28,99 | 34 | -29,17 | |||
| 2025-09-25 | NP | USRT - iShares Core U.S. REIT ETF | 108.371 | 13,73 | 752 | 55,37 | ||||
| 2025-11-13 | 13F | Martingale Asset Management L P | 0 | -100,00 | 0 | |||||
| 2025-11-14 | 13F | National Bank Of Canada /fi/ | 0 | -100,00 | 0 | |||||
| 2026-02-13 | 13F | Headlands Technologies LLC | 13.541 | 95 | ||||||
| 2026-02-17 | 13F | Citadel Advisors Llc | 0 | -100,00 | 0 | |||||
| 2025-09-25 | NP | DFA INVESTMENT DIMENSIONS GROUP INC - DFA Global Real Estate Securities Portfolio Shares | 176.231 | -11,66 | 1.223 | 20,73 | ||||
| 2025-09-29 | NP | PRFZ - Invesco FTSE RAFI US 1500 Small-Mid ETF This fund is a listed as child fund of Invesco Ltd. and if that institution has disclosed ownership in this security, then these positions will not be double counted when calculating total shares and total value | 89.722 | -33,95 | 623 | -9,86 | ||||
| 2026-01-23 | 13F | Private Wealth Management Group, LLC | 110 | 0,00 | 1 | |||||
| 2026-01-29 | 13F | Vanguard Group Inc | 2.170.563 | 1,52 | 15.172 | 1,96 | ||||
| 2026-02-17 | 13F | Harvest Investment Services, LLC | 16.339 | -24,28 | 114 | -24,00 | ||||
| 2026-02-19 | 13F | CI Private Wealth, LLC | 0 | -100,00 | 0 | |||||
| 2026-02-04 | 13F | Versor Investments LP | 267.841 | 1,08 | 1.872 | 1,52 | ||||
| 2026-02-02 | 13F | Wolverine Asset Management Llc | 269.491 | 198,50 | 1.884 | 199,84 | ||||
| 2026-02-17 | 13F | Aqr Capital Management Llc | 47.504 | 5,57 | 332 | 6,07 | ||||
| 2026-02-13 | 13F | State Street Corp | 867.444 | -0,42 | 6.063 | 0,02 | ||||
| 2025-09-25 | NP | WMMRX - Wilmington Real Asset Fund Class A Shares | 9.220 | 0,00 | 64 | 36,96 | ||||
| 2026-01-05 | 13F | GAMMA Investing LLC | 1.758 | -1,46 | 12 | 0,00 | ||||
| 2025-11-14 | 13F | Raymond James Financial Inc | 0 | -100,00 | 0 | |||||
| 2025-09-24 | NP | SWSSX - Schwab Small-Cap Index Fund This fund is a listed as child fund of Charles Schwab Investment Management Inc and if that institution has disclosed ownership in this security, then these positions will not be double counted when calculating total shares and total value | 101.011 | 6,20 | 701 | 45,13 | ||||
| 2026-02-13 | 13F | Sei Investments Co | 15.246 | 0,00 | 107 | 0,00 | ||||
| 2026-02-17 | 13F | Cambria Investment Management, L.P. | 113.223 | 0,04 | 791 | 0,51 | ||||
| 2026-02-13 | 13F | Colony Group, LLC | 228.818 | 1.599 | ||||||
| 2025-09-26 | NP | USMIX - Extended Market Index Fund | 4.394 | 2,66 | 30 | 42,86 | ||||
| 2025-11-06 | 13F | Wedbush Securities Inc | 0 | -100,00 | 0 | |||||
| 2025-09-24 | NP | PJARX - SmallCap Value Fund II R-3 | 2.177 | -23,29 | 15 | 7,14 | ||||
| 2026-03-09 | 13F | EMC Capital Management | 11.752 | -15,00 | 0 | |||||
| 2026-02-11 | 13F | Deutsche Bank Ag\ | 5.793 | -87,24 | 40 | -87,30 | ||||
| 2026-02-04 | 13F | Atlantic Union Bankshares Corp | 3.332 | 0,00 | 23 | 0,00 | ||||
| 2026-02-09 | 13F | Legal & General Group Plc | 3.629 | 0,00 | 25 | 0,00 | ||||
| 2026-02-17 | 13F | Mercer Global Advisors Inc /adv | 12.628 | 88 | ||||||
| 2026-02-13 | 13F | Ubs Asset Management Americas Inc | 1.366 | 10 | ||||||
| 2026-02-05 | 13F | Gamco Investors, Inc. Et Al | 50.000 | 78,57 | 350 | 79,90 | ||||
| 2026-02-13 | 13F | Squarepoint Ops LLC | 213.443 | 344,59 | 1.492 | 346,41 | ||||
| 2025-10-20 | 13F | Los Angeles Capital Management Llc | 0 | -100,00 | 0 | -100,00 | ||||
| 2026-02-03 | 13F | Credit Industriel Et Commercial | 275.144 | 103,59 | 1.923 | 104,57 | ||||
| 2025-09-25 | NP | DFAR - Dimensional US Real Estate ETF | 39.669 | 16,26 | 275 | 58,96 | ||||
| 2026-02-12 | 13F | MetLife Investment Management, LLC | 16.716 | -29,67 | 117 | -29,70 | ||||
| 2026-02-12 | 13F | Pitcairn Co | 0 | -100,00 | 0 | |||||
| 2026-02-17 | 13F | Bank Of America Corp /de/ | 30.849 | 97,79 | 216 | 99,07 | ||||
| 2026-02-17 | 13F | Jones Financial Companies Lllp | 741 | -16,37 | 5 | -16,67 | ||||
| 2025-11-13 | 13F | Acadian Asset Management Llc | 0 | -100,00 | 0 | |||||
| 2026-02-13 | 13F | Transamerica Financial Advisors, Inc. | 14 | 0 | ||||||
| 2026-02-17 | 13F | Susquehanna International Group, Llp | Put | 0 | -100,00 | 0 | ||||
| 2026-02-17 | 13F | Price T Rowe Associates Inc /md/ | 20.966 | 0,00 | 0 | |||||
| 2025-11-14 | 13F | Lazard Asset Management Llc | 0 | -100,00 | 0 | |||||
| 2025-09-26 | NP | EBIT - Harbor AlphaEdge Small Cap Earners ETF | 812 | -44,76 | 6 | -28,57 | ||||
| 2026-02-17 | 13F | Point72 Asset Management, L.P. | 23.790 | 166 | ||||||
| 2026-02-17 | 13F | Susquehanna International Group, Llp | 0 | -100,00 | 0 | |||||
| 2026-02-17 | 13F | Northern Trust Corp | 325.778 | -5,17 | 2.277 | -4,77 | ||||
| 2026-02-17 | 13F | CastleKnight Management LP | 42.300 | 0,00 | 296 | 0,34 | ||||
| 2026-02-17 | 13F | Susquehanna International Group, Llp | Call | 0 | -100,00 | 0 | ||||
| 2026-02-09 | 13F | Huntington National Bank | 641 | 0,00 | 4 | 0,00 | ||||
| 2026-02-13 | 13F | Truvestments Capital Llc | 300 | 0,00 | 2 | 0,00 | ||||
| 2026-01-28 | 13F | DekaBank Deutsche Girozentrale | 19.497 | 0,00 | 0 | |||||
| 2026-02-17 | 13F | LMR Partners LLP | 90.800 | 635 | ||||||
| 2026-01-21 | 13F | Daytona Street Capital LLC | 10.760 | 75 | ||||||
| 2026-02-17 | 13F | Polar Asset Management Partners Inc. | 0 | -100,00 | 0 | |||||
| 2026-02-17 | 13F | Public Employees Retirement System Of Ohio | 13.609 | 95 | ||||||
| 2026-02-13 | 13F | SRS Capital Advisors, Inc. | 689 | -79,41 | 5 | -82,61 | ||||
| 2026-02-10 | 13F | Nomura Asset Management Co Ltd | 66.700 | 17,64 | 466 | 18,27 | ||||
| 2025-10-24 | 13F | Meeder Asset Management Inc | 0 | -100,00 | 0 | |||||
| 2026-02-12 | 13F | Alps Advisors Inc | 0 | -100,00 | 0 | |||||
| 2025-09-26 | NP | TIEIX - TIAA-CREF Equity Index Fund Institutional Class | 45.741 | 0,00 | 317 | 36,64 | ||||
| 2026-01-16 | 13F | FNY Investment Advisers, LLC | 178.829 | 1 | ||||||
| 2026-02-13 | 13F | Victory Capital Management Inc | 96.900 | -2,12 | 677 | -1,74 | ||||
| 2026-02-19 | 13F | Invesco Ltd. | 24.731 | -60,96 | 173 | -60,91 | ||||
| 2026-01-07 | 13F | Massmutual Trust Co Fsb/adv | 629 | 0,00 | 4 | 0,00 | ||||
| 2026-01-23 | 13F | Sumitomo Mitsui Trust Holdings, Inc. | 44.226 | -2,22 | 309 | -1,59 | ||||
| 2026-02-13 | 13F | Umb Bank N A/mo | 140 | 1 | ||||||
| 2025-10-09 | 13F | Voya Investment Management Llc | 0 | -100,00 | 0 | |||||
| 2026-02-11 | 13F | Simplex Trading, Llc | 1.114 | 3.275,76 | 8 | |||||
| 2026-02-06 | 13F | Lsv Asset Management | 84.000 | -44,11 | 1 | -100,00 | ||||
| 2026-02-11 | 13F | Simplex Trading, Llc | Call | 1.000 | -58,33 | 7 | ||||
| 2026-02-11 | 13F | Simplex Trading, Llc | Put | 200 | 100,00 | 1 | ||||
| 2026-02-13 | 13F | Panagora Asset Management Inc | 0 | -100,00 | 0 | |||||
| 2026-02-17 | 13F | Murchinson Ltd. | 14.400 | 101 | ||||||
| 2025-12-09 | 13F/A | Tudor Investment Corp Et Al | 0 | -100,00 | 0 | |||||
| 2026-02-05 | 13F | AlphaCore Capital LLC | 63.125 | -32,11 | 441 | -31,84 | ||||
| 2026-02-13 | 13F/A | Alberta Investment Management Corp | 0 | -100,00 | 0 | |||||
| 2026-02-17 | 13F | Magnetar Financial LLC | 1.012.143 | 2,27 | 7.075 | 2,70 | ||||
| 2026-01-21 | 13F | Capital Advisors, Ltd. LLC | 394 | 0,00 | 0 | |||||
| 2026-02-13 | 13F | Wells Fargo & Company/mn | 43.854 | 46,22 | 307 | 47,12 | ||||
| 2026-02-17 | 13F | Odyssean, LLC | 44.385 | 310 | ||||||
| 2026-02-12 | 13F | Renaissance Technologies Llc | 0 | -100,00 | 0 | |||||
| 2026-02-13 | 13F | Morgan Stanley | 759.313 | -34,73 | 5.308 | -34,46 | ||||
| 2026-02-13 | 13F | Glazer Capital, Llc | 2.775.000 | 22,09 | 19 | 26,67 | ||||
| 2025-09-24 | NP | BLACKROCK FUNDS - iShares Russell Small/Mid-Cap Index Fund Investor A | 5.152 | 44,19 | 36 | 94,44 | ||||
| 2026-02-13 | 13F | Rhumbline Advisers | 54.460 | -12,64 | 381 | -12,24 | ||||
| 2026-02-11 | 13F | Jpmorgan Chase & Co | 52.782 | -79,83 | 369 | -79,78 | ||||
| 2026-02-17 | 13F | Newtyn Management, LLC | 2.800.000 | -28,90 | 19.572 | -28,59 | ||||
| 2025-11-03 | 13F | Federated Hermes, Inc. | 0 | -100,00 | 0 | |||||
| 2026-02-13 | 13F | MAI Capital Management | 45 | 0 | ||||||
| 2025-09-26 | NP | FSSNX - Fidelity Small Cap Index Fund This fund is a listed as child fund of Fmr Llc and if that institution has disclosed ownership in this security, then these positions will not be double counted when calculating total shares and total value | 409.316 | -2,52 | 2.841 | 33,15 | ||||
| 2026-02-17 | 13F | Crawford Fund Management, LLC | Put | 0 | -100,00 | 0 | ||||
| 2026-02-13 | 13F | Pinnacle Wealth Planning Services, Inc. | 20.257 | 0,00 | 142 | 0,71 | ||||
| 2026-02-13 | 13F | Arrowstreet Capital, Limited Partnership | 332.766 | -1,36 | 2.326 | -0,94 | ||||
| 2026-01-29 | 13F | UBS Group AG | 152.344 | 86,06 | 1.065 | 86,99 | ||||
| 2025-11-14 | 13F | Man Group plc | 0 | -100,00 | 0 | |||||
| 2026-02-05 | 13F | Gabelli Funds Llc | 1.041.665 | 165,54 | 7.281 | 166,70 | ||||
| 2025-09-26 | NP | UAPIX - Ultrasmall-cap Profund Investor Class | 433 | 8,79 | 3 | 50,00 | ||||
| 2026-02-17 | 13F | Advisor Group Holdings, Inc. | 44.232 | -9,74 | 309 | -8,85 | ||||
| 2026-02-06 | 13F | EverSource Wealth Advisors, LLC | 1.248 | -1,73 | 9 | 0,00 | ||||
| 2026-02-17 | 13F | Optiver Holding B.V. | 724 | 0,00 | 5 | 0,00 | ||||
| 2025-11-13 | 13F | Prudential Financial Inc | 0 | -100,00 | 0 | |||||
| 2026-02-17 | 13F | Royal Bank Of Canada | 10.683 | 50,06 | 75 | 47,06 | ||||
| 2026-02-17 | 13F | Nomura Holdings Inc | 1.410.430 | -19,88 | 9.859 | -19,54 | ||||
| 2026-02-17 | 13F | Two Sigma Advisers, Lp | 35.500 | 98,32 | 248 | 100,00 | ||||
| 2026-02-17 | 13F | Jump Financial, LLC | 0 | -100,00 | 0 | |||||
| 2026-01-16 | 13F | Ronald Blue Trust, Inc. | 0 | -100,00 | 0 | |||||
| 2026-02-02 | 13F | Strs Ohio | 7.800 | 0,00 | 55 | 0,00 | ||||
| 2026-02-23 | 13F | Virtu Financial LLC | 61.580 | 5,74 | 0 | |||||
| 2026-02-12 | 13F | Hrt Financial Lp | 17.190 | 0 | ||||||
| 2026-02-17 | 13F | FIL Ltd | 1.614.545 | 0,00 | 11.286 | 0,43 | ||||
| 2026-02-13 | 13F | Police & Firemen's Retirement System of New Jersey | 10.869 | 0,00 | 76 | 0,00 | ||||
| 2025-09-26 | NP | SLPIX - Small-cap Profund Investor Class | 35 | -7,89 | 0 | |||||
| 2026-02-17 | 13F | D. E. Shaw & Co., Inc. | 72.767 | -62,17 | 509 | -62,03 | ||||
| 2026-02-17 | 13F | Fmr Llc | 24.578 | 15,56 | 172 | 15,54 | ||||
| 2025-11-13 | 13F | Hsbc Holdings Plc | 0 | -100,00 | 0 | -100,00 | ||||
| 2026-02-17 | 13F | Engine Capital Management, LP | 231.020 | 0,00 | 1.615 | 0,44 | ||||
| 2026-02-10 | 13F | Daiwa Securities Group Inc. | 13.925 | 0,00 | 0 | |||||
| 2026-01-29 | 13F | UMA Financial Services, Inc. | 205 | 0,00 | 1 | 0,00 | ||||
| 2026-01-23 | 13F | Farther Finance Advisors, LLC | 1.104 | 0,00 | 8 | 0,00 | ||||
| 2026-02-12 | 13F | Penserra Capital Management LLC | 0 | -100,00 | 0 | |||||
| 2026-02-13 | 13F | Charles Schwab Investment Management Inc | 326.091 | -4,10 | 2.279 | -3,68 | ||||
| 2026-02-06 | 13F | Gsa Capital Partners Llp | 25.270 | -50,83 | 0 | |||||
| 2026-02-06 | 13F | Larson Financial Group LLC | 2.000 | 0,00 | 14 | 0,00 | ||||
| 2026-02-11 | 13F | Ameritas Investment Partners, Inc. | 3.686 | 26 | ||||||
| 2025-09-26 | NP | LSVQX - LSV Small Cap Value Fund Institutional Class Shares | 201.000 | 54,38 | 1.395 | 110,89 | ||||
| 2026-01-27 | 13F | Cannon Global Investment Management, LLC | 40.000 | 280 | ||||||
| 2025-11-12 | 13F | LPL Financial LLC | 0 | -100,00 | 0 | |||||
| 2026-01-27 | 13F | WealthCollab, LLC | 0 | -100,00 | 0 | |||||
| 2026-02-17 | 13F | Alliancebernstein L.p. | 61.929 | -7,47 | 433 | -7,10 | ||||
| 2026-02-06 | 13F | Pnc Financial Services Group, Inc. | 10.905 | -2,27 | 76 | -1,30 | ||||
| 2026-02-03 | 13F | Mitsubishi UFJ Kokusai Asset Management Co., Ltd. | 30.780 | 0,00 | 215 | 0,00 | ||||
| 2026-02-14 | 13F | Rockefeller Capital Management L.P. | 1.154 | 8 | ||||||
| 2026-02-05 | 13F | Allworth Financial LP | 20 | -28,57 | 0 | |||||
| 2025-09-29 | NP | RSSL - Global X Russell 2000 ETF | 20.580 | -12,10 | 143 | 20,34 | ||||
| 2026-02-17 | 13F | Css Llc/il | Put | 1.300 | 0,00 | 9 | 0,00 | |||
| 2026-02-17 | 13F | Water Island Capital Llc | 61.498 | 13,22 | 430 | 13,49 | ||||
| 2026-02-17 | 13F | Css Llc/il | 207.013 | 1.970,13 | 1.447 | 1.997,10 | ||||
| 2026-02-12 | 13F | Groupe la Francaise | 412.718 | 103,59 | 2.885 | 104,54 | ||||
| 2025-10-07 | 13F | Sonora Investment Management Group, LLC | 240.620 | -26,67 | 1.675 | -4,45 | ||||
| 2026-02-17 | 13F | State Of Wisconsin Investment Board | 28.100 | -51,13 | 196 | -51,00 | ||||
| 2026-01-30 | 13F/A | M&t Bank Corp | 17.517 | 122 | ||||||
| 2026-02-17 | 13F | Prelude Capital Management, Llc | 415.998 | 732,00 | 2.908 | 735,34 | ||||
| 2025-11-07 | 13F | Shell Asset Management Co | 0 | 0 | ||||||
| 2026-02-12 | 13F | Jane Street Group, Llc | 86.307 | -7,46 | 603 | -7,09 | ||||
| 2026-02-10 | 13F | Bnp Paribas Arbitrage, Sa | 9.017 | -57,64 | 63 | -57,43 | ||||
| 2026-01-26 | 13F | Cwm, Llc | 2.053 | 5,66 | 0 | |||||
| 2025-09-24 | NP | BLACKROCK FUNDS - iShares FTSE NAREIT All Equity REIT Index Fund | 54.484 | 23,72 | 378 | 69,51 | ||||
| 2026-02-06 | 13F | IFP Advisors, Inc | 103 | -1,90 | 1 | |||||
| 2026-02-17 | 13F | Toronto Dominion Bank | 612.093 | 538,26 | 4.279 | 541,38 | ||||
| 2025-09-26 | NP | TASVX - PGIM QMA SMALL-CAP VALUE FUND Class Z | 96.400 | 0,00 | 669 | 36,81 | ||||
| 2026-02-17 | 13F | Tower Research Capital LLC (TRC) | 3.250 | 88,95 | 23 | 100,00 | ||||
| 2026-01-23 | 13F | State of Alaska, Department of Revenue | 18.914 | 0,00 | 0 | |||||
| 2026-02-13 | 13F | Kestra Advisory Services, LLC | 0 | -100,00 | 0 | |||||
| 2026-01-27 | 13F | Optas, LLC | 11.648 | 81 | ||||||
| 2026-01-08 | 13F | Versant Capital Management, Inc | 3.614 | -5,27 | 25 | -3,85 | ||||
| 2025-10-21 | 13F | Simon Quick Advisors, Llc | 0 | -100,00 | 0 | -100,00 | ||||
| 2026-01-15 | 13F | Fortitude Family Office, LLC | 248 | 0,00 | 2 | 0,00 | ||||
| 2026-02-17 | 13F | Russell Investments Group, Ltd. | 12.329 | 0,58 | 86 | 1,18 | ||||
| 2026-02-13 | 13F | Capula Management Ltd | 0 | -100,00 | 0 | |||||
| 2026-02-17 | 13F | XTX Topco Ltd | 142.646 | 997 | ||||||
| 2026-02-12 | 13F | Triumph Capital Management | 695 | 0,00 | 5 | 0,00 | ||||
| 2026-01-27 | 13F | Asset Management One Co., Ltd. | 53.460 | 0,00 | 372 | 0,00 | ||||
| 2025-09-26 | NP | TISBX - TIAA-CREF Small-Cap Blend Index Fund Institutional Class | 54.938 | 0,00 | 381 | 36,56 | ||||
| 2026-02-10 | 13F | Goldman Sachs Group Inc | 377.708 | 21,34 | 2.640 | 21,88 | ||||
| 2026-02-13 | 13F | Pathstone Holdings, LLC | 0 | -100,00 | 0 | |||||
| 2026-02-17 | 13F | National Asset Management, Inc. | 17.395 | 3,52 | 122 | 4,31 | ||||
| 2026-02-13 | 13F | Quarry LP | 3.409 | 24 | ||||||
| 2026-02-13 | 13F | Carmignac Gestion | 375.233 | 0,00 | 2.623 | 0,42 | ||||
| 2026-02-17 | 13F | Millennium Management Llc | 291.630 | -35,77 | 2.038 | -35,49 | ||||
| 2026-02-17 | 13F | PenderFund Capital Management Ltd. | 58.700 | 39,10 | 410 | 39,93 | ||||
| 2026-02-17 | 13F | California State Teachers Retirement System | 2.403 | -14,97 | 17 | -15,79 | ||||
| 2025-09-24 | NP | SWTSX - Schwab Total Stock Market Index Fund This fund is a listed as child fund of Charles Schwab Investment Management Inc and if that institution has disclosed ownership in this security, then these positions will not be double counted when calculating total shares and total value | 16.407 | 0,00 | 114 | 36,14 | ||||
| 2025-09-25 | NP | DFGR - Dimensional Global Real Estate ETF | 57.306 | 22,60 | 398 | 67,51 | ||||
| 2026-02-17 | 13F | PharVision Advisers, LLC | 46.164 | 323 | ||||||
| 2025-11-13 | 13F | Founders Capital Management | 0 | -100,00 | 0 | |||||
| 2025-09-25 | NP | DFREX - Dfa Real Estate Securities Portfolio - Institutional Class This fund is a listed as child fund of Dimensional Fund Advisors Lp and if that institution has disclosed ownership in this security, then these positions will not be double counted when calculating total shares and total value | 191.254 | 0,00 | 1.327 | 36,66 | ||||
| 2026-02-10 | 13F | Commonwealth Of Pennsylvania Public School Empls Retrmt Sys | 88.623 | -11,38 | 619 | -11,06 | ||||
| 2026-02-05 | 13F | Amalgamated Bank | 1.229 | -16,39 | 0 | |||||
| 2026-02-10 | 13F | Intech Investment Management Llc | 17.665 | 0,00 | 123 | 0,82 | ||||
| 2026-02-12 | 13F | Dimensional Fund Advisors Lp | 289.834 | -30,95 | 2.026 | -30,67 | ||||
| 2026-02-05 | 13F | GABELLI & Co INVESTMENT ADVISERS, INC. | 693.050 | 183,98 | 4.844 | 185,28 | ||||
| 2026-01-20 | 13F | Signaturefd, Llc | 2 | 0,00 | 0 | |||||
| 2025-10-15 | 13F | Stephens Consulting, LLC | 0 | -100,00 | 0 | |||||
| 2026-02-10 | 13F | Bank of New York Mellon Corp | 118.996 | -4,26 | 832 | -3,93 | ||||
| 2026-02-17 | 13F | Quantinno Capital Management LP | 177.732 | 6,94 | 1.242 | 7,44 | ||||
| 2025-10-22 | 13F | D.a. Davidson & Co. | 0 | -100,00 | 0 | |||||
| 2025-11-14 | 13F | Point72 Asia (Singapore) Pte. Ltd. | 85.734 | 597 | ||||||
| 2026-02-17 | 13F | Qube Research & Technologies Ltd | 155.337 | 31,80 | 1.086 | 32,32 | ||||
| 2026-01-08 | 13F | True Wealth Design, LLC | 17 | 0,00 | 0 | |||||
| 2026-02-12 | 13F | New York State Common Retirement Fund | 7.029 | 0,00 | 49 | 2,08 | ||||
| 2026-02-12 | 13F | Nuveen, LLC | 100.482 | -13,62 | 702 | -13,23 | ||||
| 2026-03-17 | 13F | Stance Capital Llc | 0 | -100,00 | 0 | |||||
| 2026-02-13 | 13F | Smartleaf Asset Management LLC | 487 | 0,00 | 3 | 0,00 | ||||
| 2026-02-17 | 13F | Engineers Gate Manager LP | 10.140 | -55,28 | 71 | -55,41 | ||||
| 2026-02-13 | 13F | Barclays Plc | 60.887 | 10,59 | 426 | 10,97 | ||||
| 2026-02-13 | 13F | Mariner, LLC | 10.028 | -54,16 | 70 | -53,95 | ||||
| 2025-09-24 | NP | BLACKROCK FUNDS - iShares Total U.S. Stock Market Index Fund Investor A | 1.953 | 0,00 | 14 | 44,44 | ||||
| 2026-02-12 | 13F | Gardner Lewis Asset Management L P | 764.158 | 5.341 | ||||||
| 2026-02-17 | 13F | MIRAE ASSET GLOBAL ETFS HOLDINGS Ltd. | 18.165 | 1,88 | 127 | 1,61 | ||||
| 2026-02-06 | 13F | Resona Asset Management Co.,Ltd. | 16.508 | -14,44 | 115 | -14,93 | ||||
| 2025-09-29 | NP | KCXIX - Knights of Columbus U.S. All Cap Index Fund I Shares | 173 | 8,81 | 1 | |||||
| 2026-01-21 | 13F | Sound Income Strategies, LLC | 0 | -100,00 | 0 | |||||
| 2025-11-13 | 13F | Macquarie Group Ltd | 0 | -100,00 | 0 | -100,00 | ||||
| 2026-02-17 | 13F | Two Sigma Investments, Lp | 0 | -100,00 | 0 | |||||
| 2026-01-15 | 13F | Nisa Investment Advisors, Llc | 4.754 | -37,19 | 33 | -36,54 | ||||
| 2026-02-13 | 13F | Citigroup Inc | 885 | -75,03 | 6 | -75,00 | ||||
| 2026-02-12 | 13F | BlackRock, Inc. | 3.352.706 | 2,43 | 23.435 | 2,87 | ||||
| 2026-01-22 | 13F | Trium Capital LLP | 2.027.163 | 14.170 | ||||||
| 2026-02-17 | 13F | Balyasny Asset Management Llc | 25.570 | 179 | ||||||
| 2026-02-09 | 13F | Geode Capital Management, Llc | 876.753 | -5,97 | 6.130 | -5,56 |