Grundlæggende statistik
| Institutionelle ejere | 148 total, 148 long only, 0 short only, 0 long/short - change of 27,35% MRQ |
| Gennemsnitlig porteføljeallokering | 0.2765 % - change of 22,04% MRQ |
| Institutionelle aktier (lange) | 50.035.591 (ex 13D/G) - change of 15,84MM shares 46,30% MRQ |
| Institutionel værdi (lang) | $ 1.515.986 USD ($1000) |
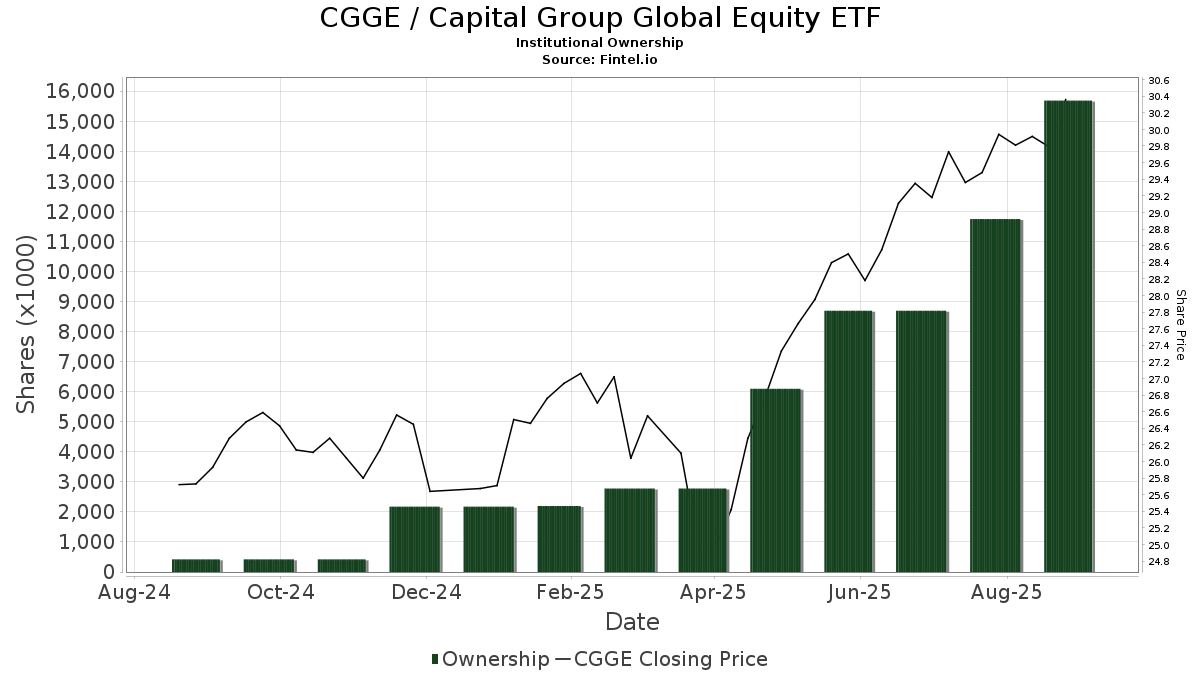
Institutionelt ejerskab og aktionærer
Capital Group Global Equity ETF (US:CGGE) har 148 institutionelle ejere og aktionærer, der har indsendt 13D/G- eller 13F-formularer til Securities Exchange Commission (SEC). Disse institutioner har i alt 50,035,591 aktier. Største aktionærer omfatter Envestnet Asset Management Inc, Capital Group Private Client Services, Inc., Capital International Investors, Cetera Investment Advisers, LPL Financial LLC, Wells Fargo & Company/mn, Mml Investors Services, Llc, Larson Financial Group LLC, Assetmark, Inc, and Royal Bank Of Canada .
Capital Group Global Equity ETF (ARCA:CGGE) institutionel ejerskabsstruktur viser aktuelle positioner i virksomheden efter institutioner og fonde, samt seneste ændringer i positionsstørrelse. Større aktionærer kan omfatte individuelle investorer, investeringsforeninger, hedgefonde eller institutioner. Skema 13D angiver, at investoren besidder (eller besidder) mere end 5 % af virksomheden og har til hensigt (eller har til hensigt at) aktivt at forfølge en ændring i forretningsstrategi. Skema 13G indikerer en passiv investering på over 5%.
The share price as of March 6, 2026 is 31,44 / share. Previously, on March 7, 2025, the share price was 26,71 / share. This represents an increase of 17,71% over that period.
Fondens stemningsscore
Fund Sentiment Score (fka Ownership Accumulation Score) finder de aktier, der bliver mest købt af fonde. Det er resultatet af en sofistikeret, multi-faktor kvantitativ model, der identificerer virksomheder med de højeste niveauer af institutionel akkumulering. Scoringsmodellen bruger en kombination af den samlede stigning i oplyste ejere, ændringerne i porteføljeallokeringer i disse ejere og andre målinger. Tallet går fra 0 til 100, hvor højere tal indikerer et højere niveau af akkumulering for sine jævnaldrende, og 50 er gennemsnittet.
Opdateringsfrekvens: Dagligt
Se Ownership Explorer, som giver en liste over højest rangerende virksomheder.
AI+ Ask Fintel’s AI assistant about Capital Group Global Equity ETF.
Select a question to share a public post with an AI-crafted answer.
Thinking of good questions…
Institutionel Put/Call-forhold
Ud over at indberette standardaktie- og gældsudstedelser skal institutter med mere end 100 mill. aktiver under forvaltning også oplyse deres put- og call-optionsbeholdninger. Da salgsoptioner generelt indikerer negativ stemning, og købsoptioner indikerer positiv stemning, kan vi få en fornemmelse af den overordnede institutionelle stemning ved at plotte forholdet mellem put og kald. Diagrammet til højre viser det historiske put/call-forhold for dette instrument.
Brug af Put/Call Ratio som en indikator for investorernes stemning overvinder en af de vigtigste mangler ved at bruge totalt institutionelt ejerskab, som er, at en betydelig mængde af aktiver under forvaltning investeres passivt for at spore indekser. Passivt forvaltede fonde køber typisk ikke optioner, så indikatoren for put/call-forholdet følger mere nøje følelsen af aktivt forvaltede fonde.

13F og NPORT arkivering
Detaljer om 13F-arkivering er gratis. Detaljer om NP-ansøgninger kræver et premium-medlemskab. Grønne rækker angiver nye positioner. Røde rækker angiver lukkede positioner. Klik på linket ikon for at se den fulde transaktionshistorik.
Opgrader
for at låse premium-data op og eksportere til Excel ![]() .
.
| Fil dato | Kilde | Investor | Type | Gennemsnitlig pris (Øst) |
Aktier | Δ Aktier (%) |
Rapporteret Værdi ($1000) |
Δ Værdi (%) |
Port Alloc (%) |
|
|---|---|---|---|---|---|---|---|---|---|---|
| 2026-02-06 | 13F | Cullen/frost Bankers, Inc. | 285.813 | 24,74 | 9.040 | 28,14 | ||||
| 2026-02-12 | 13F | Steward Partners Investment Advisory, Llc | 358 | 36,64 | 11 | 37,50 | ||||
| 2026-02-09 | 13F | Huntington National Bank | 5 | 0,00 | ||||||
| 2026-01-26 | 13F | Valmark Advisers, Inc. | 112.660 | 48,63 | 3.563 | 52,72 | ||||
| 2026-02-17 | 13F | Raymond James Financial Inc | 512.911 | 175,70 | 16.223 | 183,22 | ||||
| 2026-01-30 | 13F | Strategic Blueprint, LLC | 312.147 | 6,72 | 9.873 | 9,64 | ||||
| 2026-02-13 | 13F | Blueprint Financial Advisors LLC | 77.045 | 49,71 | 2.437 | 53,79 | ||||
| 2026-02-17 | 13F | Lantern Wealth Advisors, LLC | 28.212 | 15,23 | 892 | 18,46 | ||||
| 2026-02-19 | 13F | Birchwood Financial Partners, Inc. | 2.750 | 87 | ||||||
| 2025-11-14 | 13F | Old Mission Capital Llc | 0 | -100,00 | 0 | -100,00 | ||||
| 2026-01-29 | 13F | Aprio Wealth Management, LLC | 129.370 | 4.092 | ||||||
| 2026-02-05 | 13F | Navalign, LLC | 2 | 0 | ||||||
| 2026-01-16 | 13F | Tempus Wealth Planning, LLC | 46.615 | 10,05 | 1.474 | 13,04 | ||||
| 2026-02-13 | 13F | Integrated Wealth Concepts LLC | 83.653 | 92,98 | 2.646 | 98,28 | ||||
| 2026-02-02 | 13F | Benjamin Edwards Inc | 619.247 | 63,37 | 19.587 | 67,83 | ||||
| 2026-02-17 | 13F | Advisory Services Network, LLC | 0 | -100,00 | 0 | |||||
| 2026-02-13 | 13F | Mml Investors Services, Llc | 1.554.291 | 14,23 | 49.162 | 17,35 | ||||
| 2025-11-13 | 13F | Herold Advisors, Inc. | 0 | -100,00 | 0 | |||||
| 2026-02-17 | 13F | Hilltop Holdings Inc. | 9.107 | 288 | ||||||
| 2026-02-03 | 13F | SFG Wealth Management, LLC. | 57.293 | -0,48 | 1.812 | 2,26 | ||||
| 2026-02-17 | 13F | Advisor Group Holdings, Inc. | 608.892 | 0,58 | 19.263 | 5,12 | ||||
| 2026-02-06 | 13F | Global Retirement Partners, LLC | 6.282 | 199 | ||||||
| 2026-02-09 | 13F | Prospera Financial Services Inc | 12.300 | 43,16 | 389 | 47,35 | ||||
| 2026-02-11 | 13F | Janney Montgomery Scott LLC | 784.574 | 34,71 | 25 | 41,18 | ||||
| 2026-01-20 | 13F | Sovran Advisors, LLC | 99.717 | 3,15 | 3.253 | 7,36 | ||||
| 2026-01-23 | 13F | Assetmark, Inc | 1.212.952 | 24,85 | 38.366 | 28,26 | ||||
| 2026-01-14 | 13F | ORG Partners LLC | 57.283 | 98,44 | 1.812 | 75,83 | ||||
| 2026-01-30 | 13F | Boyer Financial Services, Inc. | 63.997 | 2.046 | ||||||
| 2026-02-13 | 13F | Mariner, LLC | 65.544 | 40,37 | 2.073 | 44,26 | ||||
| 2026-02-10 | 13F | Sittner & Nelson, Llc | 7.399 | 0,15 | 241 | 6,17 | ||||
| 2026-01-13 | 13F | Mayflower Financial Advisors, LLC | 7.567 | 0,00 | 239 | 3,02 | ||||
| 2026-02-11 | 13F | Gwn Securities Inc. | 23.712 | 80,14 | 750 | 85,19 | ||||
| 2026-02-13 | 13F | Advyzon Investment Management, LLC | 37.454 | 1.185 | ||||||
| 2026-02-13 | 13F | Kestra Advisory Services, LLC | 0 | -100,00 | 0 | |||||
| 2026-02-13 | 13F | BNB Wealth Management, LLC | 56.462 | 1.786 | ||||||
| 2026-02-02 | 13F | CX Institutional | 107 | 0 | ||||||
| 2026-02-17 | 13F | Cetera Investment Advisers | 2.825.862 | 16,59 | 89.382 | 19,77 | ||||
| 2025-11-14 | 13F | Virtu Financial LLC | 0 | -100,00 | 0 | |||||
| 2026-01-28 | 13F | Kingswood Wealth Advisors, Llc | 33.738 | 1.067 | ||||||
| 2026-02-11 | 13F | Capital International Investors | 3.801.915 | 15.343,01 | 120.255 | 15.764,64 | ||||
| 2026-02-11 | 13F | LPL Financial LLC | 2.741.720 | 43,14 | 86.721 | 47,04 | ||||
| 2026-02-17 | 13F | Evergreen Wealth Solutions, LLC | 129.670 | 81,73 | 4.101 | 86,66 | ||||
| 2026-01-27 | 13F | TD Waterhouse Canada Inc. | 1.842 | 58 | ||||||
| 2026-02-23 | 13F | Continental Investors Services, Inc. | 12.160 | -4,93 | 392 | -1,01 | ||||
| 2026-02-10 | 13F | Advisor Resource Council | 15.228 | 0,00 | 482 | 2,78 | ||||
| 2026-02-10 | 13F | Envestnet Asset Management Inc | 12.115.687 | 15,73 | 383.219 | 18,89 | ||||
| 2026-02-12 | 13F | CIBC Private Wealth Group, LLC | 1.727 | -27,25 | 55 | -26,03 | ||||
| 2026-01-20 | 13F | AdvisorNet Financial, Inc | 17 | 1 | ||||||
| 2026-02-06 | 13F | EverSource Wealth Advisors, LLC | 7 | 0,00 | 0 | |||||
| 2026-02-13 | 13F | Greenline Wealth Management LLC | 79 | 2 | ||||||
| 2026-02-03 | 13F | Legacy Wealth Managment, LLC/ID | 49 | 0,00 | 2 | 0,00 | ||||
| 2026-01-29 | 13F | Nbc Securities, Inc. | 3.779 | 0,43 | 120 | 3,48 | ||||
| 2026-02-06 | 13F | Envestnet Portfolio Solutions, Inc. | 292.168 | 14,92 | 9.241 | 18,05 | ||||
| 2026-02-12 | 13F | Hrt Financial Lp | 29.416 | 1 | ||||||
| 2026-02-13 | 13F | Smartleaf Asset Management LLC | 361.584 | 19,03 | 11.506 | 23,86 | ||||
| 2026-02-02 | 13F | Oppenheimer & Co Inc | 7.510 | 238 | ||||||
| 2026-02-02 | 13F | Mutual Advisors, LLC | 15.421 | 3,51 | 488 | 5,18 | ||||
| 2026-02-06 | 13F | Principle Wealth Partners Llc | 32.090 | 4,10 | 1.015 | 6,95 | ||||
| 2026-02-12 | 13F | Principal Securities, Inc. | 0 | -100,00 | 0 | |||||
| 2026-01-28 | 13F | Ai Financial Services Llc | 54.295 | 7,57 | 1.717 | 9,78 | ||||
| 2026-01-15 | 13F | Clg Llc | 25.571 | 78,51 | 809 | 83,22 | ||||
| 2026-02-13 | 13F | MAI Capital Management | 60 | 0,00 | 2 | 0,00 | ||||
| 2026-02-05 | 13F | Financial Council Asset Management Inc | 7.272 | 230 | ||||||
| 2026-02-17 | 13F | Wiley Bros.-aintree Capital, Llc | 644.201 | 102,34 | 20.367 | 107,19 | ||||
| 2026-01-28 | 13F | Financial Perspectives, Inc | 1.145 | 0,44 | 36 | 2,86 | ||||
| 2026-01-27 | 13F | PFG Advisors | 47.787 | 88,43 | 1.512 | 93,72 | ||||
| 2026-02-17 | 13F | Susquehanna International Group, Llp | 163.258 | 1.239,72 | 5.164 | 1.276,80 | ||||
| 2026-01-14 | 13F | James Reed Financial Services, Inc. | 598.625 | 60,77 | 18.935 | 65,16 | ||||
| 2026-02-17 | 13F | GeoWealth Management, LLC | 10.283 | 28,70 | 325 | 32,65 | ||||
| 2026-01-22 | 13F | Apollon Wealth Management, LLC | 11.367 | 360 | ||||||
| 2026-02-03 | 13F | RFG Advisory, LLC | 44.359 | -1,20 | 1.403 | 1,52 | ||||
| 2026-02-10 | 13F | IFG Advisory, LLC | 7.521 | 238 | ||||||
| 2026-02-13 | 13F | Gts Securities Llc | 113.738 | 3.598 | ||||||
| 2026-01-30 | 13F | Simplicity Wealth,LLC | 31.507 | 0,30 | 997 | 3,00 | ||||
| 2026-02-17 | 13F | Royal Bank Of Canada | 1.103.456 | 10,65 | 34.902 | 13,67 | ||||
| 2026-02-10 | 13F | Vantus Wealth LLC | 37.139 | 1.175 | ||||||
| 2026-01-16 | 13F | Balboa Wealth Partners | 18.631 | 3,42 | 589 | 6,32 | ||||
| 2026-02-09 | 13F | Cary Street Partners Financial Llc | 91.342 | -1,21 | 2.889 | 1,51 | ||||
| 2026-02-05 | 13F | Stephens Inc /ar/ | 256.679 | 9,76 | 8.119 | 12,75 | ||||
| 2026-01-12 | 13F | World Equity Group, Inc. | 0 | -100,00 | 0 | |||||
| 2026-02-13 | 13F | Venture Visionary Partners LLC | 182.679 | 212,12 | 5.778 | 220,64 | ||||
| 2026-02-17 | 13F | Citadel Advisors Llc | 35.427 | -86,16 | 1.121 | -85,78 | ||||
| 2026-02-06 | 13F | Larson Financial Group LLC | 1.363.320 | 13,85 | 43.122 | 16,95 | ||||
| 2026-01-07 | 13F | Sagespring Wealth Partners, Llc | 48.979 | 20,33 | 1.549 | 23,62 | ||||
| 2026-02-13 | 13F | Wells Fargo & Company/mn | 2.334.375 | 356,26 | 73.836 | 368,71 | ||||
| 2026-02-10 | 13F/A | Northwestern Mutual Wealth Management Co | 9.470 | 117,80 | 300 | 124,81 | ||||
| 2026-02-09 | 13F | Arq Wealth Advisors, Llc | 27.419 | 85,04 | 867 | 90,13 | ||||
| 2026-01-12 | 13F | DAVENPORT & Co LLC | 32.527 | 271,74 | 1.029 | 282,16 | ||||
| 2026-01-23 | 13F | Farther Finance Advisors, LLC | 7.470 | 28,26 | 236 | 31,84 | ||||
| 2026-02-11 | 13F | Capital Group Private Client Services, Inc. | 5.413.104 | 20,80 | 171.217 | 24,10 | ||||
| 2026-02-09 | 13F | Bleakley Financial Group, LLC | 11.372 | 360 | ||||||
| 2026-01-21 | 13F | Flagship Harbor Advisors, Llc | 87 | 3 | ||||||
| 2026-02-12 | 13F | Commonwealth Equity Services, Llc | 655.790 | 40,26 | 20.743 | 148.057,14 | ||||
| 2026-01-26 | 13F | Cwm, Llc | 1.102 | 12,11 | 0 | |||||
| 2026-02-09 | 13F | Harbour Investments, Inc. | 109.800 | 47,03 | 3.473 | 51,02 | ||||
| 2026-02-12 | 13F | Jane Street Group, Llc | 400.000 | 60,90 | 12.652 | 65,30 | ||||
| 2026-02-17 | 13F | Bank Of America Corp /de/ | 0 | -100,00 | 0 | |||||
| 2026-02-17 | 13F | Captrust Financial Advisors | 37.003 | 16,40 | 1.170 | 19,63 | ||||
| 2026-02-14 | 13F | Whipplewood Advisors, LLC | 1.450 | 0,00 | 46 | 2,27 | ||||
| 2026-02-10 | 13F | Goldman Sachs Group Inc | 11.063 | 350 | ||||||
| 2026-02-10 | 13F | Rothschild Investment Llc | 325 | 10 | ||||||
| 2026-02-13 | 13F | Visionary Wealth Advisors | 9.232 | 292 | ||||||
| 2026-02-02 | 13F | CENTRAL TRUST Co | 207 | 7 | ||||||
| 2026-01-29 | 13F | Comerica Bank | 7.108 | 165,52 | 225 | 173,17 | ||||
| 2026-02-04 | 13F | Stonebridge Financial Group, LLC / MO | 7.657 | 242 | ||||||
| 2026-02-05 | 13F | Compton Financial Group, LLC | 15.481 | 490 | ||||||
| 2026-02-13 | 13F | Stifel Financial Corp | 103.538 | 68,33 | 3.275 | 72,95 | ||||
| 2026-02-17 | 13F | Fmr Llc | 3 | 0 | ||||||
| 2026-02-17 | 13F | Equitable Holdings, Inc. | 10.089 | 319 | ||||||
| 2026-02-03 | 13F | We Are One Seven, LLC | 14.154 | 448 | ||||||
| 2025-09-26 | 13F | Capital A Wealth Management, LLC | 0 | -100,00 | 0 | |||||
| 2026-02-13 | 13F | Transamerica Financial Advisors, Inc. | 20.355 | 644 | ||||||
| 2026-02-17 | 13F | Ameriflex Group, Inc. | 95 | -78,21 | 3 | -76,92 | ||||
| 2026-02-18 | 13F | GWM Advisors LLC | 745.919 | 49,75 | 23.593 | 53,83 | ||||
| 2026-02-12 | 13F | Wedbush Securities Inc | 24.643 | -0,73 | 1 | |||||
| 2026-01-13 | 13F | LongView Wealth Management | 121.730 | 20,61 | 3.993 | 28,48 | ||||
| 2026-01-20 | 13F | Investment Planning Advisors, Inc. | 19.863 | -11,58 | 628 | -9,12 | ||||
| 2026-02-05 | 13F | Atria Investments Llc | 24.856 | 163,17 | 786 | 171,03 | ||||
| 2026-02-12 | 13F | Titleist Asset Management, Llc | 7.220 | 228 | ||||||
| 2026-01-29 | 13F | UBS Group AG | 1.175 | 0,00 | 37 | 2,78 | ||||
| 2026-02-10 | 13F | Thoroughbred Financial Services, Llc | 69.745 | 76,57 | 2 | 100,00 | ||||
| 2026-01-27 | 13F | Security Financial Services, INC. | 46.786 | 24,97 | 1.480 | 28,39 | ||||
| 2026-02-09 | 13F | MSH Capital Advisors LLC | 17.537 | 32,51 | 555 | 36,12 | ||||
| 2026-01-14 | 13F | Clarius Group, LLC | 1.103.189 | 34.894 | ||||||
| 2026-02-06 | 13F | Vestmark Advisory Solutions, Inc. | 724.587 | 9,41 | 22.919 | 12,40 | ||||
| 2026-02-03 | 13F | Koshinski Asset Management, Inc. | 45.001 | 75,01 | 1.423 | 79,90 | ||||
| 2026-02-13 | 13F | Flow Traders U.s. Llc | 56.158 | 377,33 | 2 | |||||
| 2026-02-12 | 13F | Rossby Financial, LCC | 68 | 2 | ||||||
| 2026-01-29 | 13F | Concurrent Investment Advisors, LLC | 483.650 | 103,59 | 15.298 | 109,15 | ||||
| 2026-02-11 | 13F | Gateway Wealth Partners, LLC | 69.985 | 45,54 | 2.214 | 49,53 | ||||
| 2026-02-13 | 13F | Ausdal Financial Partners, Inc. | 13.891 | 3,74 | 439 | 6,55 | ||||
| 2026-02-05 | 13F | Intrua Financial, LLC | 224.506 | 24,75 | 7.101 | 28,15 | ||||
| 2026-02-11 | 13F | Capital Analysts, Inc. | 14.249 | 22,24 | 0 | |||||
| 2026-02-17 | 13F | Signature Equity Partners, LLC | 212 | 7 | ||||||
| 2026-02-17 | 13F | Jones Financial Companies Lllp | 192.282 | 47,32 | 6.082 | 52,48 | ||||
| 2026-02-12 | 13F | Concorde Asset Management, LLC | 6.663 | -0,61 | 211 | 1,45 | ||||
| 2026-02-17 | 13F | Private Advisor Group, LLC | 130.078 | 22,45 | 4.114 | 25,81 | ||||
| 2026-02-12 | 13F | Brinker Capital Investments, LLC | 424.260 | 5,53 | 13.419 | 8,41 | ||||
| 2026-02-18 | 13F | Hanlon Investment Management, Inc. | 16.261 | -2,98 | 514 | -0,39 | ||||
| 2026-01-28 | 13F | Geneos Wealth Management Inc. | 15.763 | 1.776,55 | 499 | 1.892,00 | ||||
| 2026-02-02 | 13F | Truist Financial Corp | 353.948 | 11,93 | 11.195 | 14,99 | ||||
| 2026-01-16 | 13F | Armstrong, Fleming & Moore, Inc | 7.090 | 0,01 | 224 | 2,75 | ||||
| 2026-01-13 | 13F | CoreCap Advisors, LLC | 109 | 3 | ||||||
| 2026-02-17 | 13F | Northern Trust Corp | 18.063 | 571 | ||||||
| 2026-01-26 | 13F | Merit Financial Group, LLC | 149.261 | 0,18 | 4.721 | 2,92 | ||||
| 2026-02-11 | 13F | Jpmorgan Chase & Co | 2.467 | 376,25 | 78 | 420,00 | ||||
| 2026-01-20 | 13F | Stratos Wealth Partners, LTD. | 170.451 | 45,32 | 5.391 | 49,29 | ||||
| 2026-02-05 | 13F | Cambridge Investment Research Advisors, Inc. | 996.254 | 400,03 | 32 | 416,67 | ||||
| 2026-02-06 | 13F | IFP Advisors, Inc | 1.238 | 0,24 | 39 | 2,63 | ||||
| 2026-02-17 | 13F | Blueprint Investment Partners LLC | 77.045 | 49,71 | 2.437 | 53,79 | ||||
| 2026-01-20 | 13F | Ascent Group, LLC | 17.428 | 1,38 | 551 | 4,16 | ||||
| 2026-02-10 | 13F | IAG Wealth Partners, LLC | 28.501 | -3,32 | 901 | -0,66 | ||||
| 2026-02-10 | 13F | Natixis Advisors, L.p. | 19.541 | 6,79 | 1 | |||||
| 2026-01-30 | 13F | Canandaigua National Trust Co of Florida | 25.060 | 793 | ||||||
| 2026-02-13 | 13F | Morgan Stanley | 300 | 0,00 | 9 | 0,00 | ||||
| 2026-01-05 | 13F | Park Avenue Securities Llc | 121.745 | 14,21 | 4 | 0,00 | ||||
| 2026-02-04 | 13F | Ameritas Advisory Services, LLC | 10.403 | 548,97 | 329 | 571,43 | ||||
| 2026-02-13 | 13F | SRS Capital Advisors, Inc. | 108 | 0,00 | 3 | 0,00 |