Grundlæggende statistik
| Institutionelle ejere | 114 total, 114 long only, 0 short only, 0 long/short - change of 9,62% MRQ |
| Gennemsnitlig porteføljeallokering | 0.1651 % - change of -28,49% MRQ |
| Institutionelle aktier (lange) | 40.217.603 (ex 13D/G) - change of 0,81MM shares 2,06% MRQ |
| Institutionel værdi (lang) | $ 540.147 USD ($1000) |
Institutionelt ejerskab og aktionærer
Compañía Cervecerías Unidas S.A. - Depositary Receipt (Common Stock) (US:CCU) har 114 institutionelle ejere og aktionærer, der har indsendt 13D/G- eller 13F-formularer til Securities Exchange Commission (SEC). Disse institutioner har i alt 40,217,603 aktier. Største aktionærer omfatter First Eagle Investment Management, LLC, SGOVX - First Eagle Overseas Fund Class A, Discerene Group LP, Wellington Management Group Llp, HILAX - The Hartford International Value Fund Class A, FEBAX - First Eagle Global Income Builder Fund Class A, Bennbridge Ltd, Macquarie Group Ltd, Acadian Asset Management Llc, and BlackRock, Inc. .
Compañía Cervecerías Unidas S.A. - Depositary Receipt (Common Stock) (NYSE:CCU) institutionel ejerskabsstruktur viser aktuelle positioner i virksomheden efter institutioner og fonde, samt seneste ændringer i positionsstørrelse. Større aktionærer kan omfatte individuelle investorer, investeringsforeninger, hedgefonde eller institutioner. Skema 13D angiver, at investoren besidder (eller besidder) mere end 5 % af virksomheden og har til hensigt (eller har til hensigt at) aktivt at forfølge en ændring i forretningsstrategi. Skema 13G indikerer en passiv investering på over 5%.
The share price as of September 15, 2025 is 12,23 / share. Previously, on September 16, 2024, the share price was 10,70 / share. This represents an increase of 14,30% over that period.

Fondens stemningsscore
Fund Sentiment Score (fka Ownership Accumulation Score) finder de aktier, der bliver mest købt af fonde. Det er resultatet af en sofistikeret, multi-faktor kvantitativ model, der identificerer virksomheder med de højeste niveauer af institutionel akkumulering. Scoringsmodellen bruger en kombination af den samlede stigning i oplyste ejere, ændringerne i porteføljeallokeringer i disse ejere og andre målinger. Tallet går fra 0 til 100, hvor højere tal indikerer et højere niveau af akkumulering for sine jævnaldrende, og 50 er gennemsnittet.
Opdateringsfrekvens: Dagligt
Se Ownership Explorer, som giver en liste over højest rangerende virksomheder.
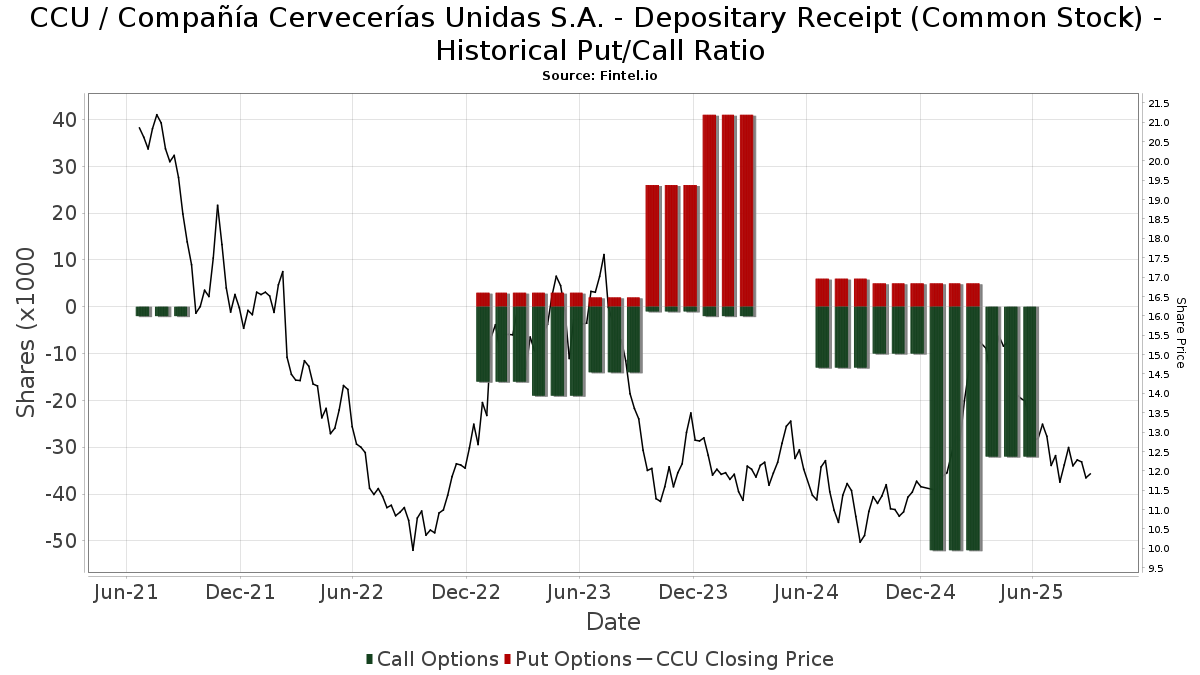
Institutionel Put/Call-forhold
Ud over at indberette standardaktie- og gældsudstedelser skal institutter med mere end 100 mill. aktiver under forvaltning også oplyse deres put- og call-optionsbeholdninger. Da salgsoptioner generelt indikerer negativ stemning, og købsoptioner indikerer positiv stemning, kan vi få en fornemmelse af den overordnede institutionelle stemning ved at plotte forholdet mellem put og kald. Diagrammet til højre viser det historiske put/call-forhold for dette instrument.
Brug af Put/Call Ratio som en indikator for investorernes stemning overvinder en af de vigtigste mangler ved at bruge totalt institutionelt ejerskab, som er, at en betydelig mængde af aktiver under forvaltning investeres passivt for at spore indekser. Passivt forvaltede fonde køber typisk ikke optioner, så indikatoren for put/call-forholdet følger mere nøje følelsen af aktivt forvaltede fonde.
13F og NPORT arkivering
Detaljer om 13F-arkivering er gratis. Detaljer om NP-ansøgninger kræver et premium-medlemskab. Grønne rækker angiver nye positioner. Røde rækker angiver lukkede positioner. Klik på linket ikon for at se den fulde transaktionshistorik.
Opgrader
for at låse premium-data op og eksportere til Excel ![]() .
.
| Fil dato | Kilde | Investor | Type | Gennemsnitlig pris (Øst) |
Aktier | Δ Aktier (%) |
Rapporteret Værdi ($1000) |
Δ Værdi (%) |
Port Alloc (%) |
|
|---|---|---|---|---|---|---|---|---|---|---|
| 2025-07-31 | 13F | MQS Management LLC | 17.266 | 223 | ||||||
| 2025-06-26 | NP | DFSE - Dimensional Emerging Markets Sustainability Core 1 ETF | 5.206 | 253,43 | 79 | 364,71 | ||||
| 2025-07-28 | NP | AVEM - Avantis Emerging Markets Equity ETF This fund is a listed as child fund of American Century Companies Inc and if that institution has disclosed ownership in this security, then these positions will not be double counted when calculating total shares and total value | 157.260 | 173,52 | 2.143 | 167,21 | ||||
| 2025-04-25 | 13F | Ameritas Advisory Services, LLC | 0 | -100,00 | 0 | |||||
| 2025-08-14 | 13F | Goldman Sachs Group Inc | 13.405 | -64,83 | 173 | -70,12 | ||||
| 2025-06-26 | NP | DEXC - Dimensional Emerging Markets ex China Core Equity ETF | 3.422 | 134,87 | 52 | 205,88 | ||||
| 2025-06-26 | NP | DFA INVESTMENT DIMENSIONS GROUP INC - World ex U.S. Core Equity Portfolio Institutional Class Shares | 5.319 | 0,00 | 81 | 25,00 | ||||
| 2025-06-26 | NP | DFAX - Dimensional World ex U.S. Core Equity 2 ETF | 19.543 | 0,00 | 297 | 25,32 | ||||
| 2025-08-14 | 13F | Fmr Llc | 138 | 0,00 | 2 | -50,00 | ||||
| 2025-08-14 | 13F | Federation des caisses Desjardins du Quebec | 19.108 | 0,00 | 247 | -14,83 | ||||
| 2025-07-08 | 13F | Parallel Advisors, LLC | 1.472 | -16,08 | 19 | -26,92 | ||||
| 2025-08-14 | 13F | Smartleaf Asset Management LLC | 0 | -100,00 | 0 | |||||
| 2025-08-12 | 13F | Rhumbline Advisers | 6.455 | -1,53 | 83 | -16,16 | ||||
| 2025-08-13 | 13F | Quadrant Capital Group Llc | 16.715 | -37,47 | 216 | -47,04 | ||||
| 2025-08-07 | 13F | Allworth Financial LP | 168 | 13,51 | 2 | 0,00 | ||||
| 2025-08-06 | 13F | Savant Capital, LLC | 12.778 | 165 | ||||||
| 2025-08-05 | 13F | Simplex Trading, Llc | 2.022 | 0 | ||||||
| 2025-06-27 | NP | FEBAX - First Eagle Global Income Builder Fund Class A | 1.327.830 | 0,00 | 20.210 | 25,37 | ||||
| 2025-07-25 | NP | DEMAX - Delaware Emerging Markets Fund Class A | 410.528 | 0,00 | 5.595 | -2,29 | ||||
| 2025-08-04 | 13F | Assetmark, Inc | 65 | 96,97 | 1 | |||||
| 2025-07-22 | 13F | Gsa Capital Partners Llp | 0 | -100,00 | 0 | |||||
| 2025-08-12 | 13F | Trexquant Investment LP | 0 | -100,00 | 0 | |||||
| 2025-07-29 | NP | WEUSX - Siit World Equity Ex-us Fund - Class A | 76.859 | 1.048 | ||||||
| 2025-08-13 | 13F | Jump Financial, LLC | 23.177 | -35,67 | 299 | -45,34 | ||||
| 2025-07-29 | NP | RBB FUND, INC. - Aquarius International Fund | 4.167 | 0,00 | 57 | -3,45 | ||||
| 2025-08-28 | NP | FEOVX - First Eagle Overseas Variable Fund | 165.749 | 0,00 | 2.141 | -15,01 | ||||
| 2025-08-14 | 13F | Bank Of America Corp /de/ | 282.777 | 8,67 | 3.653 | -7,64 | ||||
| 2025-08-19 | 13F | Advisory Services Network, LLC | 0 | -100,00 | 0 | |||||
| 2025-08-13 | 13F | Employees Retirement System of Texas | 5.694 | 0,00 | 0 | |||||
| 2025-08-12 | 13F | BlackRock, Inc. | 450.421 | -5,76 | 5.819 | -19,89 | ||||
| 2025-05-08 | 13F | XTX Topco Ltd | 0 | -100,00 | 0 | |||||
| 2025-07-07 | 13F | Investors Research Corp | 36.275 | 0,00 | 469 | -15,06 | ||||
| 2025-08-08 | 13F | SBI Securities Co., Ltd. | 19 | 0,00 | 0 | |||||
| 2025-06-26 | NP | DFCEX - Emerging Markets Core Equity Portfolio - Institutional Class This fund is a listed as child fund of Dimensional Fund Advisors Lp and if that institution has disclosed ownership in this security, then these positions will not be double counted when calculating total shares and total value | 75.722 | 0,00 | 1.152 | 25,35 | ||||
| 2025-07-18 | 13F | Ninety One UK Ltd | 312.746 | 0,00 | 4.041 | -15,00 | ||||
| 2025-08-29 | NP | PEIFX - PIMCO RAE Emerging Markets Fund Institutional Class | 47.816 | -50,19 | 311 | -43,53 | ||||
| 2025-08-14 | 13F | Jane Street Group, Llc | 25.796 | 101,59 | 333 | 71,65 | ||||
| 2025-07-29 | 13F | Stephens Inc /ar/ | 21.750 | 0,93 | 281 | -14,07 | ||||
| 2025-07-22 | 13F | Sage Investment Counsel LLC | 0 | -100,00 | 0 | |||||
| 2025-07-24 | 13F | Jfs Wealth Advisors, Llc | 45 | 0,00 | 1 | |||||
| 2025-09-04 | 13F/A | Advisor Group Holdings, Inc. | 840 | 1.687,23 | 11 | |||||
| 2025-07-14 | 13F | UMA Financial Services, Inc. | 82 | 22,39 | 1 | 0,00 | ||||
| 2025-07-31 | 13F | Fielder Capital Group LLC | 12.636 | 0,00 | 163 | -15,10 | ||||
| 2025-08-14 | 13F | Citadel Advisors Llc | Put | 0 | -100,00 | 0 | ||||
| 2025-08-14 | 13F | UBS Group AG | 70.654 | 54,23 | 913 | 31,03 | ||||
| 2025-08-14 | 13F | Vident Advisory, LLC | 43.220 | -3,31 | 558 | -17,82 | ||||
| 2025-08-14 | 13F | D. E. Shaw & Co., Inc. | 86.721 | -18,98 | 1.120 | -31,12 | ||||
| 2025-07-16 | 13F | Signaturefd, Llc | 1.631 | -19,30 | 21 | -30,00 | ||||
| 2025-06-26 | NP | DFEM - Dimensional Emerging Markets Core Equity 2 ETF | 18.761 | 48,37 | 286 | 86,27 | ||||
| 2025-08-14 | 13F | Point72 Asset Management, L.P. | 65.200 | 842 | ||||||
| 2025-08-14 | 13F | Susquehanna International Group, Llp | Call | 13.600 | -38,46 | 176 | -47,76 | |||
| 2025-08-27 | NP | OAIEX - Optimum International Fund Class A | 18.470 | 91,32 | 239 | 96,69 | ||||
| 2025-07-11 | 13F | Diversified Trust Co | 12.007 | 155 | ||||||
| 2025-08-15 | 13F | Tower Research Capital LLC (TRC) | 31 | -32,61 | 0 | |||||
| 2025-08-26 | NP | SBHEX - Segall Bryant & Hamill Emerging Markets Fund Retail Class | 2.600 | 34 | ||||||
| 2025-08-14 | 13F | Citadel Advisors Llc | Call | 19.000 | -37,91 | 245 | -47,31 | |||
| 2025-07-11 | 13F | Farther Finance Advisors, LLC | 50 | 0,00 | 1 | |||||
| 2025-05-01 | 13F | Genesis Investment Management, LLP | 0 | -100,00 | 0 | |||||
| 2025-08-12 | 13F | Jpmorgan Chase & Co | 296 | 122,56 | 4 | 50,00 | ||||
| 2025-05-14 | 13F | Catalyst Funds Management Pty Ltd | 0 | -100,00 | 0 | |||||
| 2025-08-29 | NP | SA FUNDS INVESTMENT TRUST - SA Emerging Markets Value Fund | 788 | 10 | ||||||
| 2025-08-06 | 13F | First Eagle Investment Management, LLC | 15.891.620 | -0,00 | 205.320 | -15,00 | ||||
| 2025-05-14 | 13F | Guggenheim Capital Llc | 0 | -100,00 | 0 | |||||
| 2025-08-13 | 13F | BLI - Banque de Luxembourg Investments | 435.000 | -13,86 | 5.606 | -27,42 | ||||
| 2025-07-10 | 13F | Banque de Luxembourg S.A. | 6.623 | 0,00 | 101 | 0,00 | ||||
| 2025-08-14 | 13F | Barometer Capital Management Inc. | 9.543 | 0,00 | 123 | -13,99 | ||||
| 2025-08-14 | 13F | Parvin Asset Management, LLC | 3.875 | 0,00 | 50 | -13,79 | ||||
| 2025-08-12 | 13F | Virtu Financial LLC | 13.034 | -18,58 | 0 | |||||
| 2025-05-15 | 13F | Two Sigma Advisers, Lp | 0 | -100,00 | 0 | |||||
| 2025-07-07 | 13F | Northwest & Ethical Investments L.P. | 0 | -100,00 | 0 | -100,00 | ||||
| 2025-08-14 | 13F | Bennbridge Ltd | 917.510 | -20,42 | 11.854 | -32,36 | ||||
| 2025-08-13 | 13F | Marshall Wace, Llp | 255.380 | 83,78 | 3.300 | 56,20 | ||||
| 2025-06-26 | NP | DAADX - Emerging Markets ex China Core Equity Portfolio Institutional Class | 5.028 | 0,00 | 77 | 24,59 | ||||
| 2025-08-13 | 13F | Arrowstreet Capital, Limited Partnership | 166.244 | 386,65 | 2.148 | 313,68 | ||||
| 2025-08-08 | 13F | Pnc Financial Services Group, Inc. | 78 | 44,44 | 1 | |||||
| 2025-08-29 | NP | MFEM - PIMCO RAFI Dynamic Multi-Factor Emerging Markets Equity ETF | 10.550 | 0,00 | 69 | -13,92 | ||||
| 2025-08-14 | 13F | State Street Corp | 162.060 | 44,62 | 2.094 | 22,90 | ||||
| 2025-08-14 | 13F | Cubist Systematic Strategies, LLC | 132.197 | 429,57 | 1.708 | 350,40 | ||||
| 2025-08-15 | 13F | Morgan Stanley | 126.667 | 3,86 | 1.637 | -11,71 | ||||
| 2025-07-25 | 13F | Cwm, Llc | 138 | 0 | ||||||
| 2025-08-12 | 13F | Dimensional Fund Advisors Lp | 171.396 | 11,07 | 2.214 | -5,59 | ||||
| 2025-08-13 | 13F | Renaissance Technologies Llc | 391.065 | -4,52 | 5.053 | -18,84 | ||||
| 2025-08-14 | 13F | Ieq Capital, Llc | 15.271 | 197 | ||||||
| 2025-08-12 | 13F | SRS Capital Advisors, Inc. | 90 | 1 | ||||||
| 2025-08-14 | 13F | Mariner, LLC | 66.408 | 8,11 | 858 | -8,15 | ||||
| 2025-06-26 | NP | HILAX - The Hartford International Value Fund Class A | 1.355.255 | 0,00 | 20.627 | 25,37 | ||||
| 2025-08-13 | 13F | Northern Trust Corp | 98.115 | -13,52 | 1.268 | -26,51 | ||||
| 2025-08-14 | 13F | BTG Pactual Asset Management US LLC | 14.656 | 189 | ||||||
| 2025-07-30 | 13F | Ethic Inc. | 12.255 | -2,61 | 158 | -18,65 | ||||
| 2025-08-12 | 13F | Proequities, Inc. | 0 | 0 | ||||||
| 2025-07-24 | 13F | Us Bancorp \de\ | 947 | 0,00 | 12 | -14,29 | ||||
| 2025-07-31 | 13F | R Squared Ltd | 29.605 | 49,45 | 382 | 26,91 | ||||
| 2025-08-11 | 13F | Principal Securities, Inc. | 85 | 214,81 | 1 | |||||
| 2025-08-14 | 13F | Royal Bank Of Canada | 124.778 | 237,85 | 1.612 | 187,34 | ||||
| 2025-08-14 | 13F | Raymond James Financial Inc | 1.212 | 16 | ||||||
| 2025-08-15 | 13F | WealthCollab, LLC | 202 | 0,00 | 3 | -33,33 | ||||
| 2025-08-14 | 13F | Two Sigma Investments, Lp | 66.555 | 29,78 | 860 | 10,27 | ||||
| 2025-08-07 | 13F | Acadian Asset Management Llc | 487.149 | 130,10 | 6 | 100,00 | ||||
| 2025-08-13 | 13F | Channing Global Advisors, Llc | 9.058 | -39,94 | 117 | -48,91 | ||||
| 2025-08-12 | 13F | O'shaughnessy Asset Management, Llc | 18.159 | 235 | ||||||
| 2025-08-13 | 13F | Natixis Advisors, L.p. | 15.549 | 0 | ||||||
| 2025-07-24 | 13F | Ronald Blue Trust, Inc. | 25.295 | 4,30 | 327 | -11,41 | ||||
| 2025-07-15 | 13F | Ballentine Partners, LLC | 13.372 | -1,19 | 173 | -16,10 | ||||
| 2025-08-21 | NP | MEMSX - Mercer Emerging Markets Equity Fund Class I | 86.587 | -2,70 | 1.119 | -17,31 | ||||
| 2025-08-06 | 13F | Stokes Family Office, LLC | 25.000 | 0,00 | 323 | -15,00 | ||||
| 2025-05-28 | NP | QCSTRX - Stock Account Class R1 | 105.958 | 20,03 | 803 | 57,76 | ||||
| 2025-06-27 | NP | SGOVX - First Eagle Overseas Fund Class A | 9.392.572 | 0,00 | 142.955 | 25,37 | ||||
| 2025-08-29 | NP | FRDM - Freedom 100 Emerging Markets ETF | 442.501 | 16,75 | 5.717 | -0,76 | ||||
| 2025-08-11 | 13F | Nomura Asset Management Co Ltd | 1.500 | 0,00 | 19 | -13,64 | ||||
| 2025-08-14 | 13F | Wellington Management Group Llp | 1.934.547 | -0,52 | 24.994 | -15,44 | ||||
| 2025-07-28 | NP | AVSE - Avantis Responsible Emerging Markets Equity ETF | 4.253 | 153,31 | 58 | 147,83 | ||||
| 2025-07-30 | NP | APIE - ActivePassive International Equity ETF | 46.854 | 1,04 | 639 | -1,24 | ||||
| 2025-08-25 | NP | EITEX - Parametric Tax-Managed Emerging Markets Fund Institutional Class | 23.700 | 0,00 | 306 | -15,00 | ||||
| 2025-05-05 | 13F | Lindbrook Capital, Llc | 1.014 | -3,43 | 15 | 36,36 | ||||
| 2025-07-21 | 13F | Qrg Capital Management, Inc. | 11.251 | 3,59 | 145 | -12,12 | ||||
| 2025-08-14 | 13F | Citadel Advisors Llc | 0 | -100,00 | 0 | |||||
| 2025-07-28 | NP | AVXC - Avantis Emerging Markets ex-China Equity ETF | 3.569 | 37,43 | 49 | 33,33 | ||||
| 2025-08-12 | 13F | Coldstream Capital Management Inc | 0 | -100,00 | 0 | |||||
| 2025-08-12 | 13F | American Century Companies Inc | 173.672 | 172,19 | 2.244 | 131,48 | ||||
| 2025-08-12 | 13F | MAI Capital Management | 1.336 | 17 | ||||||
| 2025-08-01 | 13F | Envestnet Asset Management Inc | 78.043 | 6,87 | 1.008 | -9,11 | ||||
| 2025-07-18 | 13F | Naples Global Advisors, Llc | 31.200 | 0,00 | 403 | -14,98 | ||||
| 2025-06-26 | NP | Dfa Investment Trust Co - The Emerging Markets Small Cap Series This fund is a listed as child fund of Dimensional Fund Advisors Lp and if that institution has disclosed ownership in this security, then these positions will not be double counted when calculating total shares and total value | 17.960 | 0,00 | 273 | 25,23 | ||||
| 2025-04-25 | 13F | KBC Group NV | 0 | -100,00 | 0 | |||||
| 2025-08-13 | 13F | Russell Investments Group, Ltd. | 12.703 | 164 | ||||||
| 2025-07-14 | 13F | GAMMA Investing LLC | 2.616 | 0,62 | 34 | -15,38 | ||||
| 2025-05-14 | 13F | Huntington National Bank | 0 | -100,00 | 0 | |||||
| 2025-08-14 | 13F | Wells Fargo & Company/mn | 34.688 | 41,90 | 448 | 20,75 | ||||
| 2025-08-14 | 13F | Aquatic Capital Management LLC | 28.837 | 161,54 | 373 | 122,75 | ||||
| 2025-08-14 | 13F | Macquarie Group Ltd | 559.389 | 3,41 | 7.227 | -12,10 | ||||
| 2025-08-13 | 13F | EverSource Wealth Advisors, LLC | 3.233 | 1.252,72 | 42 | 1.266,67 | ||||
| 2025-08-14 | 13F | Prelude Capital Management, Llc | 0 | -100,00 | 0 | |||||
| 2025-08-12 | 13F | Discerene Group LP | 2.517.157 | 0,00 | 32.522 | -15,00 |
Other Listings
| DE:CVU | 10,40 € |