Grundlæggende statistik
| Institutionelle ejere | 67 total, 67 long only, 0 short only, 0 long/short - change of 0,00% MRQ |
| Gennemsnitlig porteføljeallokering | 0.4703 % - change of 10,90% MRQ |
| Institutionelle aktier (lange) | 65.386.377 (ex 13D/G) - change of 10,43MM shares 18,97% MRQ |
| Institutionel værdi (lang) | $ 864.033 USD ($1000) |
Institutionelt ejerskab og aktionærer
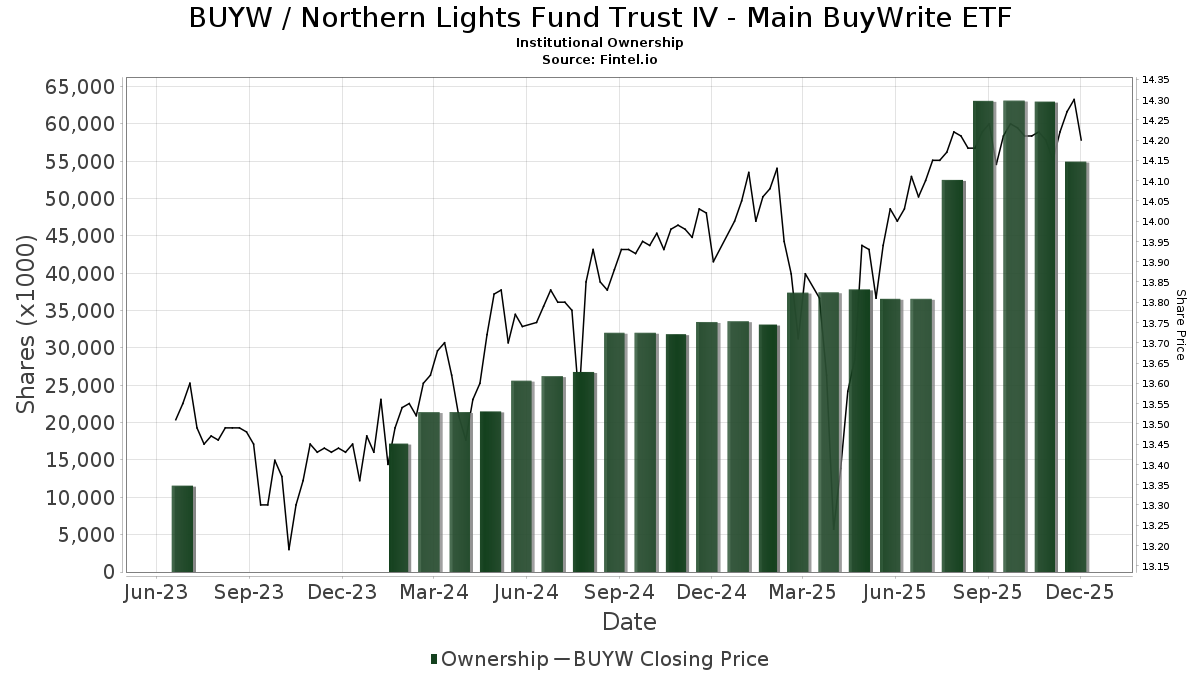
Northern Lights Fund Trust IV - Main BuyWrite ETF (US:BUYW) har 67 institutionelle ejere og aktionærer, der har indsendt 13D/G- eller 13F-formularer til Securities Exchange Commission (SEC). Disse institutioner har i alt 65,386,377 aktier. Største aktionærer omfatter Brinker Capital Investments, LLC, LPL Financial LLC, Main Management LLC, Advisor Group Holdings, Inc., Envestnet Asset Management Inc, Encompass More Asset Management, Virtue Capital Management, LLC, Cwm, Llc, San Luis Wealth Advisors LLC, and Potomac Fund Management Inc /adv .
Northern Lights Fund Trust IV - Main BuyWrite ETF (BATS:BUYW) institutionel ejerskabsstruktur viser aktuelle positioner i virksomheden efter institutioner og fonde, samt seneste ændringer i positionsstørrelse. Større aktionærer kan omfatte individuelle investorer, investeringsforeninger, hedgefonde eller institutioner. Skema 13D angiver, at investoren besidder (eller besidder) mere end 5 % af virksomheden og har til hensigt (eller har til hensigt at) aktivt at forfølge en ændring i forretningsstrategi. Skema 13G indikerer en passiv investering på over 5%.
The share price as of March 5, 2026 is 14,24 / share. Previously, on March 6, 2025, the share price was 13,74 / share. This represents an increase of 3,64% over that period.
Fondens stemningsscore
Fund Sentiment Score (fka Ownership Accumulation Score) finder de aktier, der bliver mest købt af fonde. Det er resultatet af en sofistikeret, multi-faktor kvantitativ model, der identificerer virksomheder med de højeste niveauer af institutionel akkumulering. Scoringsmodellen bruger en kombination af den samlede stigning i oplyste ejere, ændringerne i porteføljeallokeringer i disse ejere og andre målinger. Tallet går fra 0 til 100, hvor højere tal indikerer et højere niveau af akkumulering for sine jævnaldrende, og 50 er gennemsnittet.
Opdateringsfrekvens: Dagligt
Se Ownership Explorer, som giver en liste over højest rangerende virksomheder.
AI+ Ask Fintel’s AI assistant about Northern Lights Fund Trust IV - Main BuyWrite ETF.
Select a question to share a public post with an AI-crafted answer.
Thinking of good questions…
Institutionel Put/Call-forhold
Ud over at indberette standardaktie- og gældsudstedelser skal institutter med mere end 100 mill. aktiver under forvaltning også oplyse deres put- og call-optionsbeholdninger. Da salgsoptioner generelt indikerer negativ stemning, og købsoptioner indikerer positiv stemning, kan vi få en fornemmelse af den overordnede institutionelle stemning ved at plotte forholdet mellem put og kald. Diagrammet til højre viser det historiske put/call-forhold for dette instrument.
Brug af Put/Call Ratio som en indikator for investorernes stemning overvinder en af de vigtigste mangler ved at bruge totalt institutionelt ejerskab, som er, at en betydelig mængde af aktiver under forvaltning investeres passivt for at spore indekser. Passivt forvaltede fonde køber typisk ikke optioner, så indikatoren for put/call-forholdet følger mere nøje følelsen af aktivt forvaltede fonde.
13F og NPORT arkivering
Detaljer om 13F-arkivering er gratis. Detaljer om NP-ansøgninger kræver et premium-medlemskab. Grønne rækker angiver nye positioner. Røde rækker angiver lukkede positioner. Klik på linket ikon for at se den fulde transaktionshistorik.
Opgrader
for at låse premium-data op og eksportere til Excel ![]() .
.
| Fil dato | Kilde | Investor | Type | Gennemsnitlig pris (Øst) |
Aktier | Δ Aktier (%) |
Rapporteret Værdi ($1000) |
Δ Værdi (%) |
Port Alloc (%) |
|
|---|---|---|---|---|---|---|---|---|---|---|
| 2026-02-18 | 13F/A | Virtue Capital Management, LLC | 1.240.039 | 1.441.805,81 | 17.708 | 8.753,50 | ||||
| 2026-02-17 | 13F | Old Mission Capital Llc | 33.886 | 485 | ||||||
| 2026-02-17 | 13F | Raymond James Financial Inc | 13.547 | -0,38 | 194 | 0,00 | ||||
| 2026-02-11 | 13F | Gwn Securities Inc. | 243.877 | 15,00 | 3.492 | 15,86 | ||||
| 2026-02-05 | 13F | Cambridge Investment Research Advisors, Inc. | 152.565 | 72,32 | 2 | 100,00 | ||||
| 2026-01-26 | 13F | United Advisor Group, LLC | 59.480 | 13,43 | 852 | 14,23 | ||||
| 2026-02-10 | 13F | Root Financial Partners, LLC | 115 | 0,00 | 2 | 0,00 | ||||
| 2026-02-09 | 13F | Integrity Alliance, Llc. | 154.385 | -8,10 | 2.211 | -7,42 | ||||
| 2026-02-10 | 13F | Goldman Sachs Group Inc | 0 | -100,00 | 0 | |||||
| 2026-02-12 | 13F | Principal Securities, Inc. | 0 | -100,00 | 0 | |||||
| 2026-02-10 | 13F | Envestnet Asset Management Inc | 2.538.709 | 14,98 | 36.354 | 15,87 | ||||
| 2026-01-26 | 13F | Cwm, Llc | 939.710 | 6,52 | 13 | 8,33 | ||||
| 2026-02-13 | 13F | Morgan Stanley | 0 | -100,00 | 0 | |||||
| 2026-02-13 | 13F | Wells Fargo & Company/mn | 2 | 100,00 | 0 | |||||
| 2025-11-14 | 13F | Jane Street Group, Llc | 0 | -100,00 | 0 | |||||
| 2026-01-22 | 13F | Madrona Financial Services, LLC | 328.498 | 1,47 | 4.704 | 2,26 | ||||
| 2026-02-09 | 13F | Integrity Advisory Solutions, LLC | 15.104 | 41,13 | 216 | 42,11 | ||||
| 2026-02-10 | 13F | Foundations Investment Advisors, LLC | 241.115 | 90,88 | 3.453 | 92,42 | ||||
| 2026-02-06 | 13F | Echo45 Advisors LLC | 310.407 | 1,74 | 4.445 | 2,54 | ||||
| 2026-02-03 | 13F | Koshinski Asset Management, Inc. | 24.134 | 2,51 | 346 | 3,29 | ||||
| 2026-02-13 | 13F | Kestra Advisory Services, LLC | 0 | -100,00 | 0 | |||||
| 2026-02-17 | 13F | Bank Of America Corp /de/ | 10.316 | 3.185,35 | 148 | 3.575,00 | ||||
| 2026-01-23 | 13F | Gibbs Wealth Management | 27.887 | 4,78 | 399 | 5,56 | ||||
| 2026-02-05 | 13F | Atria Investments Llc | 0 | -100,00 | 0 | |||||
| 2026-02-05 | 13F | Northwestern Mutual Wealth Management Co | 500.318 | 110.102,20 | 65.557 | 1.092.500,00 | ||||
| 2026-02-09 | 13F | Coldstream Capital Management Inc | 44.032 | 96,15 | 631 | 98,11 | ||||
| 2026-01-23 | 13F | Farther Finance Advisors, LLC | 1.038 | 0,00 | 15 | 0,00 | ||||
| 2026-02-04 | 13F | Pensionmark Financial Group, Llc | 241.349 | 3.456 | ||||||
| 2026-02-10 | 13F | CFS Investment Advisory Services, LLC | 80.210 | 5,16 | 1.149 | 6,00 | ||||
| 2026-02-14 | 13F | Silver Grove Financial Group, Inc. | 75.803 | 14,09 | 1.086 | 14,94 | ||||
| 2026-02-05 | 13F | Allworth Financial LP | 195 | 0,00 | 3 | 0,00 | ||||
| 2026-01-09 | 13F | Dynamic Advisor Solutions LLC | 130.234 | 14,19 | 1.865 | 15,06 | ||||
| 2026-02-12 | 13F | Brinker Capital Investments, LLC | 21.709.890 | 14,13 | 310.886 | 15,02 | ||||
| 2026-02-06 | 13F | Mach-1 Financial Group, Inc. | 0 | -100,00 | 0 | |||||
| 2026-01-13 | 13F | CoreCap Advisors, LLC | 1.274 | 0,00 | 18 | 0,00 | ||||
| 2025-10-27 | 13F | WealthPLAN Partners, LLC | 0 | -100,00 | 0 | |||||
| 2026-02-17 | 13F | Advisory Services Network, LLC | 0 | -100,00 | 0 | |||||
| 2026-02-12 | 13F | IFC & Insurance Marketing, Inc. | 104 | 0 | ||||||
| 2026-02-14 | 13F | Copley Financial Group, Inc. | 222.894 | 11,41 | 3.192 | 12,28 | ||||
| 2026-02-12 | 13F | Tripletail Wealth Management, LLC | 0 | -100,00 | 0 | |||||
| 2026-02-17 | 13F | Advisor Group Holdings, Inc. | 7.510.759 | 5,21 | 107.554 | 6,03 | ||||
| 2026-01-26 | 13F | San Luis Wealth Advisors LLC | 789.794 | 87,47 | 11.310 | 88,92 | ||||
| 2026-01-29 | 13F | Nbc Securities, Inc. | 55 | 0,00 | 1 | |||||
| 2025-10-31 | 13F | Whittier Trust Co Of Nevada Inc | 0 | -100,00 | 0 | |||||
| 2026-02-02 | 13F | Mutual Advisors, LLC | 51.668 | 11,71 | 740 | 11,97 | ||||
| 2026-01-28 | 13F | Kingswood Wealth Advisors, Llc | 30.692 | 6,02 | 440 | 6,81 | ||||
| 2026-02-10 | 13F | Florida Financial Advisors, Llc | 11.256 | 161 | ||||||
| 2026-01-30 | 13F | Sigma Planning Corp | 20.972 | 88,73 | 300 | 91,08 | ||||
| 2026-01-12 | 13F | VisionPoint Advisory Group, LLC | 17.966 | 257 | ||||||
| 2026-02-06 | 13F | Envestnet Portfolio Solutions, Inc. | 36.692 | 7,11 | 525 | 8,02 | ||||
| 2026-01-20 | 13F | Partners Wealth Management, Llc | 13.827 | -58,14 | 198 | -57,78 | ||||
| 2026-01-15 | 13F | SILVER OAK SECURITIES, Inc | 116.078 | 59,92 | 1.663 | 61,30 | ||||
| 2026-01-29 | 13F | Ashton Thomas Private Wealth, LLC | 102.369 | 1.466 | ||||||
| 2026-01-29 | 13F | UBS Group AG | 1.244 | -71,66 | 18 | -72,58 | ||||
| 2026-02-13 | 13F | Potomac Fund Management Inc /adv | 703.090 | 27,85 | 10.068 | 28,85 | ||||
| 2026-02-10 | 13F | Main Management LLC | 8.036.358 | 5,29 | 115 | 6,48 | ||||
| 2025-10-15 | 13F | Defined Financial Planning LLC | 147.399 | 4,14 | 2.099 | 5,06 | ||||
| 2026-02-06 | 13F | IFP Advisors, Inc | 145 | 17,89 | 2 | 100,00 | ||||
| 2026-02-23 | 13F | Sonoma Allocations LLC | 76.886 | 1.103 | ||||||
| 2026-02-09 | 13F | Harbour Investments, Inc. | 5.719 | 5,07 | 82 | 5,19 | ||||
| 2026-02-06 | 13F | Global Retirement Partners, LLC | 167.572 | 26,69 | 2.400 | 27,67 | ||||
| 2026-02-11 | 13F | LPL Financial LLC | 14.725.588 | 35,88 | 210.870 | 36,93 | ||||
| 2026-02-24 | 13F | Astoria Portfolio Advisors LLC. | 72.944 | 1.037 | ||||||
| 2026-01-09 | 13F | Tactive Advisors, LLC | 203.290 | 5,99 | 2.911 | 6,83 | ||||
| 2026-02-06 | 13F | GPS Wealth Strategies Group, LLC | 0 | -100,00 | 0 | |||||
| 2026-02-06 | 13F | Fortis Group Advisors, LLC | 74 | 1 | ||||||
| 2026-02-13 | 13F | Change Path, LLC | 101.271 | 9,65 | 1.450 | 10,52 | ||||
| 2026-02-17 | 13F | Cetera Investment Advisers | 245.723 | 20,59 | 3.519 | 21,52 | ||||
| 2026-01-23 | 13F | Assetmark, Inc | 44 | 0,00 | 1 | |||||
| 2026-01-27 | 13F | Oak Harvest Investment Services | 13.383 | 192 | ||||||
| 2026-02-13 | 13F | Ausdal Financial Partners, Inc. | 69.445 | 8,12 | 994 | 8,99 | ||||
| 2026-02-06 | 13F | EverSource Wealth Advisors, LLC | 445 | -2,20 | 6 | 0,00 | ||||
| 2026-02-17 | 13F | GeoWealth Management, LLC | 85.745 | 4,45 | 1.228 | 5,23 | ||||
| 2026-02-03 | 13F | Encompass More Asset Management | 2.418.219 | 53,34 | 34.629 | 54,53 | ||||
| 2026-02-13 | 13F | Pine Valley Investments Ltd Liability Co | 148.883 | 17,80 | 2.132 | 18,77 | ||||
| 2026-01-22 | 13F | Columbia Advisory Partners Llc | 13.683 | -14,37 | 196 | -14,10 | ||||
| 2026-02-04 | 13F | Money Concepts Capital Corp | 24.293 | -15,19 | 348 | -14,74 | ||||
| 2026-01-26 | 13F | AE Wealth Management LLC | 9.958 | -17,31 | 143 | -16,96 | ||||
| 2026-01-27 | 13F | PFG Advisors | 71.731 | 7,57 | 1.027 | 8,45 |