Grundlæggende statistik
| Institutionelle ejere | 193 total, 193 long only, 0 short only, 0 long/short - change of 6,63% MRQ |
| Gennemsnitlig porteføljeallokering | 0.4276 % - change of 15,39% MRQ |
| Institutionelle aktier (lange) | 33.957.902 (ex 13D/G) - change of 0,32MM shares 0,96% MRQ |
| Institutionel værdi (lang) | $ 760.897 USD ($1000) |
Institutionelt ejerskab og aktionærer
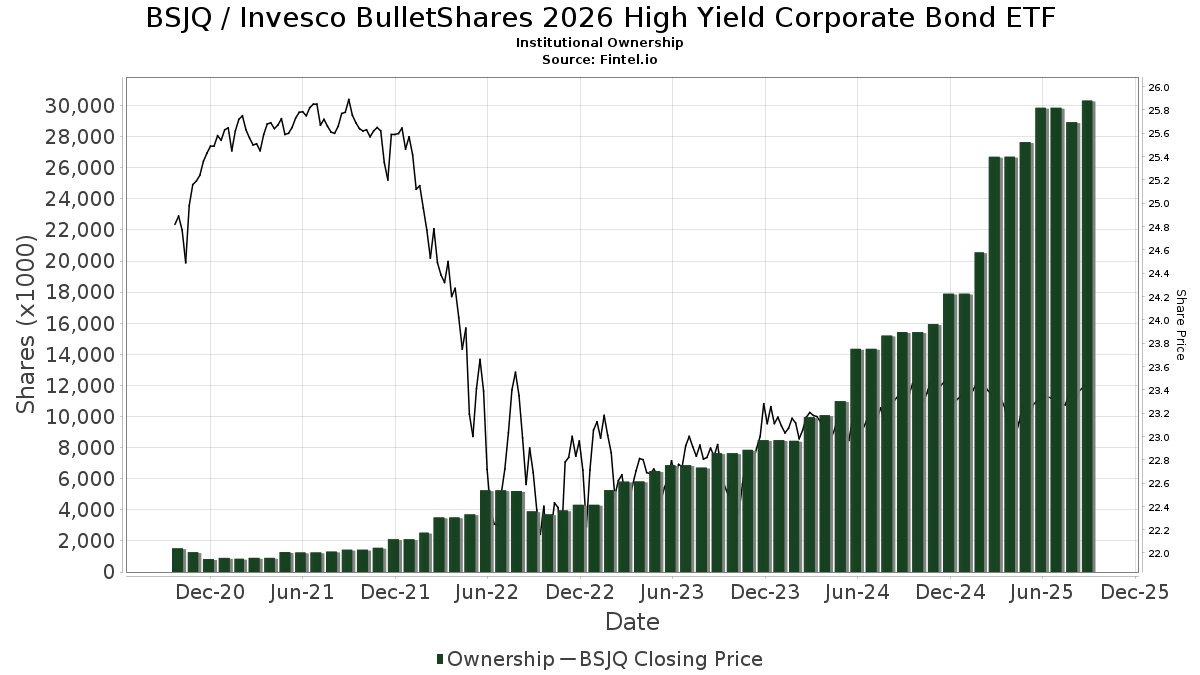
Invesco BulletShares 2026 High Yield Corporate Bond ETF (US:BSJQ) har 193 institutionelle ejere og aktionærer, der har indsendt 13D/G- eller 13F-formularer til Securities Exchange Commission (SEC). Disse institutioner har i alt 33,957,902 aktier. Største aktionærer omfatter Mirador Capital Partners LP, LPL Financial LLC, UBS Group AG, Morgan Stanley, Cetera Investment Advisers, Raymond James Financial Inc, Wells Fargo & Company/mn, Delta Investment Management, LLC, Jaffetilchin Investment Partners, LLC, and Collective Family Office Llc .
Invesco BulletShares 2026 High Yield Corporate Bond ETF (NasdaqGM:BSJQ) institutionel ejerskabsstruktur viser aktuelle positioner i virksomheden efter institutioner og fonde, samt seneste ændringer i positionsstørrelse. Større aktionærer kan omfatte individuelle investorer, investeringsforeninger, hedgefonde eller institutioner. Skema 13D angiver, at investoren besidder (eller besidder) mere end 5 % af virksomheden og har til hensigt (eller har til hensigt at) aktivt at forfølge en ændring i forretningsstrategi. Skema 13G indikerer en passiv investering på over 5%.
The share price as of April 10, 2026 is 23,24 / share. Previously, on April 14, 2025, the share price was 22,96 / share. This represents an increase of 1,26% over that period.
Fondens stemningsscore
Fund Sentiment Score (fka Ownership Accumulation Score) finder de aktier, der bliver mest købt af fonde. Det er resultatet af en sofistikeret, multi-faktor kvantitativ model, der identificerer virksomheder med de højeste niveauer af institutionel akkumulering. Scoringsmodellen bruger en kombination af den samlede stigning i oplyste ejere, ændringerne i porteføljeallokeringer i disse ejere og andre målinger. Tallet går fra 0 til 100, hvor højere tal indikerer et højere niveau af akkumulering for sine jævnaldrende, og 50 er gennemsnittet.
Opdateringsfrekvens: Dagligt
Se Ownership Explorer, som giver en liste over højest rangerende virksomheder.
AI+ Ask Fintel’s AI assistant about Invesco BulletShares 2026 High Yield Corporate Bond ETF.
Select a question to share a public post with an AI-crafted answer.
Thinking of good questions…
Institutionel Put/Call-forhold
Ud over at indberette standardaktie- og gældsudstedelser skal institutter med mere end 100 mill. aktiver under forvaltning også oplyse deres put- og call-optionsbeholdninger. Da salgsoptioner generelt indikerer negativ stemning, og købsoptioner indikerer positiv stemning, kan vi få en fornemmelse af den overordnede institutionelle stemning ved at plotte forholdet mellem put og kald. Diagrammet til højre viser det historiske put/call-forhold for dette instrument.
Brug af Put/Call Ratio som en indikator for investorernes stemning overvinder en af de vigtigste mangler ved at bruge totalt institutionelt ejerskab, som er, at en betydelig mængde af aktiver under forvaltning investeres passivt for at spore indekser. Passivt forvaltede fonde køber typisk ikke optioner, så indikatoren for put/call-forholdet følger mere nøje følelsen af aktivt forvaltede fonde.
13F og NPORT arkivering
Detaljer om 13F-arkivering er gratis. Detaljer om NP-ansøgninger kræver et premium-medlemskab. Grønne rækker angiver nye positioner. Røde rækker angiver lukkede positioner. Klik på linket ikon for at se den fulde transaktionshistorik.
Opgrader
for at låse premium-data op og eksportere til Excel ![]() .
.
| Fil dato | Kilde | Investor | Type | Gennemsnitlig pris (Øst) |
Aktier | Δ Aktier (%) |
Rapporteret Værdi ($1000) |
Δ Værdi (%) |
Port Alloc (%) |
|
|---|---|---|---|---|---|---|---|---|---|---|
| 2026-04-07 | 13F | CoreCap Advisors, LLC | 3.819 | 0,00 | 89 | -1,12 | ||||
| 2026-02-13 | 13F | SRS Capital Advisors, Inc. | 421 | 10 | ||||||
| 2026-04-06 | 13F | GAMMA Investing LLC | 0 | -100,00 | 0 | |||||
| 2026-02-10 | 13F | Parkway Wealth Management Group, LLC | 387.381 | 9.041 | ||||||
| 2026-02-13 | 13F | Kestra Advisory Services, LLC | 0 | -100,00 | 0 | |||||
| 2026-01-14 | 13F | WESPAC Advisors, LLC | 12.190 | -2,73 | 285 | -3,07 | ||||
| 2026-03-12 | 13F | Nalls Sherbakoff Group, Llc | 10.834 | 295,83 | 253 | 300,00 | ||||
| 2026-04-09 | 13F | Nelson, Van Denburg & Campbell Wealth Management Group, LLC | 358.722 | 2,19 | 8.313 | 1,46 | ||||
| 2026-02-02 | 13F | Vantage Point Financial LLC | 63.866 | -4,03 | 1.491 | -4,30 | ||||
| 2026-02-17 | 13F | Jones Financial Companies Lllp | 192.645 | 11,43 | 4.496 | 11,26 | ||||
| 2025-10-24 | 13F | MorganRosel Wealth Management, LLC | 0 | -100,00 | 0 | |||||
| 2026-02-09 | 13F | Harbour Investments, Inc. | 426 | 10 | ||||||
| 2026-01-09 | 13F | Dynamic Advisor Solutions LLC | 0 | -100,00 | 0 | |||||
| 2026-02-17 | 13F | Mercer Global Advisors Inc /adv | 435.713 | 6,33 | 10.170 | 6,04 | ||||
| 2026-01-26 | 13F | Farnam Financial LLC | 8.582 | 200 | ||||||
| 2026-02-18 | 13F | NFP Retirement, Inc. | 47.031 | 2,51 | 1.098 | 2,24 | ||||
| 2026-01-28 | 13F | Migdal Insurance & Financial Holdings Ltd. | 539.160 | 5,73 | 13 | 9,09 | ||||
| 2026-02-09 | 13F | Keating Financial Advisory Services, Inc. | 7.450 | 174 | ||||||
| 2026-02-17 | 13F | Ameriprise Financial Inc | 279.064 | 26,06 | 6.513 | 25,71 | ||||
| 2026-02-05 | 13F | Tennessee Valley Asset Management Partners | 8.655 | 202 | ||||||
| 2026-01-09 | 13F | S.E.E.D. Planning Group LLC | 71.999 | -5,18 | 1.680 | -5,46 | ||||
| 2026-02-17 | 13F | Bank Of America Corp /de/ | 447.508 | -0,28 | 10.445 | -0,55 | ||||
| 2026-02-05 | 13F | SFE Investment Counsel | 300.632 | -3,41 | 7.017 | -3,68 | ||||
| 2026-01-22 | 13F | Iron Financial, LLC | 31.906 | 23,46 | 745 | 23,18 | ||||
| 2026-04-09 | 13F | CRA Financial Services, LLC | 20.553 | 13,23 | 476 | 12,53 | ||||
| 2026-02-17 | 13F | TCG Advisory Services, LLC | 125.392 | -26,68 | 2.927 | -26,89 | ||||
| 2026-01-08 | 13F | Gradient Investments LLC | 24.773 | -17,46 | 578 | -17,66 | ||||
| 2026-01-30 | 13F | Sound Stewardship, LLC | 56.306 | 6,61 | 1.314 | 6,31 | ||||
| 2026-04-02 | 13F | Horizons Wealth Management | 119.356 | -0,94 | 2.766 | -1,64 | ||||
| 2026-01-14 | 13F | Eastern Bank | 0 | -100,00 | 0 | |||||
| 2026-02-17 | 13F | Aqr Capital Management Llc | 9.446 | -1,59 | 220 | -1,79 | ||||
| 2025-11-26 | 13F/A | Jpmorgan Chase & Co | 802 | 19 | ||||||
| 2026-02-13 | 13F | Integrated Wealth Concepts LLC | 159.079 | -4,87 | 3.713 | -5,14 | ||||
| 2026-02-17 | 13F | Insight Wealth Partners, LLC | 12.786 | -48,44 | 298 | -48,62 | ||||
| 2026-01-26 | 13F | AE Wealth Management LLC | 184 | -23,97 | 4 | -20,00 | ||||
| 2025-10-23 | 13F | Strategic Blueprint, LLC | 0 | -100,00 | 0 | |||||
| 2026-02-09 | 13F | CBIZ Investment Advisory Services, LLC | 499 | 1,42 | 12 | 0,00 | ||||
| 2026-02-10 | 13F | Lido Advisors, LLC | 352.683 | 20,73 | 8.232 | 20,40 | ||||
| 2026-02-12 | 13F | RPg Family Wealth Advisory, LLC | 155.245 | -2,08 | 3.623 | -2,35 | ||||
| 2026-02-20 | 13F | Kovitz Investment Group Partners, LLC | 0 | -100,00 | 0 | |||||
| 2026-01-14 | 13F | Net Worth Advisory Group | 25.991 | 47,26 | 607 | 46,73 | ||||
| 2026-01-26 | 13F | Cwm, Llc | 298.271 | -29,60 | 7 | -33,33 | ||||
| 2026-01-30 | 13F | Verity Asset Management, Inc. | 308.433 | -3,08 | 7.199 | -3,36 | ||||
| 2026-01-14 | 13F | Quad-Cities Investment Group, LLC | 20.172 | 31,69 | 471 | 31,28 | ||||
| 2026-01-28 | 13F | Hobbs Group Advisors, LLC | 0 | -100,00 | 0 | |||||
| 2026-01-06 | 13F | E Six Thirteen, Llc | 94.964 | 0,00 | 2.216 | -0,27 | ||||
| 2026-02-12 | 13F | BlackRock, Inc. | 5.096 | 44,24 | 119 | 43,90 | ||||
| 2026-01-23 | 13F | Meridian Financial, LLC | 9.219 | -2,64 | 215 | -2,71 | ||||
| 2026-01-20 | 13F | Semitam Bonam Llc | 32.752 | 7,84 | 764 | 7,61 | ||||
| 2026-02-10 | 13F | Koss-Olinger Consulting, LLC | 19.431 | 16,44 | 454 | 16,71 | ||||
| 2026-01-14 | 13F | Redhawk Wealth Advisors, Inc. | 13.818 | -0,31 | 323 | -0,62 | ||||
| 2026-02-04 | 13F | Ameritas Advisory Services, LLC | 0 | -100,00 | 0 | |||||
| 2026-01-15 | 13F | Ironwood Financial, llc | 426.770 | -9,62 | 9.963 | -9,85 | ||||
| 2026-04-08 | 13F | Mirador Capital Partners LP | 3.225.071 | -3,15 | 74.741 | -3,84 | ||||
| 2026-02-02 | 13F | Mutual Advisors, LLC | 8.616 | -10,24 | 201 | -10,27 | ||||
| 2026-02-13 | 13F | Aptus Capital Advisors, LLC | 1.999 | -1,09 | 47 | -2,13 | ||||
| 2026-02-09 | 13F | Financial Advisory Corp /ut/ /adv | 215.408 | -12,89 | 5 | 0,00 | ||||
| 2026-02-11 | 13F | Capital Analysts, Inc. | 30.287 | -10,76 | 1 | |||||
| 2026-01-14 | 13F | Hennion & Walsh Asset Management, Inc. | 0 | -100,00 | 0 | |||||
| 2025-11-14 | 13F | Goldman Sachs Group Inc | 0 | -100,00 | 0 | |||||
| 2026-01-27 | 13F | TD Waterhouse Canada Inc. | 62.369 | -20,44 | 1.455 | -20,71 | ||||
| 2026-02-12 | 13F | Principal Securities, Inc. | 0 | -100,00 | 0 | -100,00 | ||||
| 2026-01-30 | 13F | Delta Investment Management, LLC | 992.580 | -2,60 | 23.167 | -2,87 | ||||
| 2026-02-18 | 13F | Ark Wealth Advisors LLC | 277.039 | 6.466 | ||||||
| 2026-02-04 | 13F | Atlantic Union Bankshares Corp | 24.636 | 9,56 | 575 | 9,32 | ||||
| 2026-02-17 | 13F | Raymond James Financial Inc | 1.116.321 | -17,24 | 26.055 | -17,47 | ||||
| 2026-02-06 | 13F | Larson Financial Group LLC | 517.592 | -5,45 | 12.081 | -5,71 | ||||
| 2026-02-03 | 13F | Diversify Wealth Management, Llc | 23.377 | -2,77 | 546 | -2,85 | ||||
| 2026-02-11 | 13F | Bradley & Co. Private Wealth Management, LLC | 645 | 0,00 | 15 | 0,00 | ||||
| 2026-01-26 | 13F | River Street Advisors LLC | 132.921 | -6,64 | 3.102 | -6,90 | ||||
| 2026-01-15 | 13F | Private Advisory Group LLC | 24.308 | -0,61 | 567 | -0,87 | ||||
| 2026-02-13 | 13F | Ausdal Financial Partners, Inc. | 34.749 | 41,61 | 811 | 41,29 | ||||
| 2025-10-21 | 13F | McElhenny Sheffield Capital Management, LLC | 0 | -100,00 | 0 | -100,00 | ||||
| 2026-01-16 | 13F | Ledgewood Wealth Advisors, LLC | 54.719 | 0,21 | 1.277 | -0,08 | ||||
| 2026-02-03 | 13F | International Assets Investment Management, Llc | 200 | 5 | ||||||
| 2026-02-10 | 13F/A | Northwestern Mutual Wealth Management Co | 3.604 | -17,00 | 84 | -16,83 | ||||
| 2026-01-12 | 13F | Horizon Financial Services, Llc | 11.425 | 30,87 | 267 | 30,39 | ||||
| 2026-01-29 | 13F | Segment Wealth Management, LLC | 55.010 | -2,64 | 1.284 | -2,95 | ||||
| 2026-02-13 | 13F | Axim Planning & Wealth | 29.897 | 15,24 | 698 | 14,83 | ||||
| 2026-02-17 | 13F | United Capital Financial Advisers, Llc | 408.944 | 16,07 | 9.545 | 15,76 | ||||
| 2026-01-28 | 13F | HB Wealth Management, LLC | 153.494 | 279,82 | 3.583 | 279,05 | ||||
| 2026-02-12 | 13F | Insigneo Advisory Services, Llc | 9.000 | 210 | ||||||
| 2026-02-11 | 13F | LPL Financial LLC | 2.389.972 | 9,95 | 55.782 | 9,64 | ||||
| 2026-01-29 | 13F | Howard Wealth Management, Llc | 178.097 | 42,56 | 4.157 | 42,18 | ||||
| 2026-02-12 | 13F | Commonwealth Equity Services, Llc | 299.198 | 5,43 | 6.983 | 116.283,33 | ||||
| 2026-02-09 | 13F | Key FInancial Inc | 58.568 | 16,10 | 1.367 | 15,66 | ||||
| 2026-02-12 | 13F | Federation des caisses Desjardins du Quebec | 1.710 | 40 | ||||||
| 2026-01-23 | 13F | Carnegie Capital Asset Management, LLC | 10.965 | -71,60 | 256 | -71,76 | ||||
| 2026-01-20 | 13F | Stratos Wealth Partners, LTD. | 16.025 | 4,57 | 374 | 4,47 | ||||
| 2026-01-29 | 13F | Camelot Portfolios, LLC | 106.704 | -13,69 | 2.490 | -13,93 | ||||
| 2026-02-02 | 13F | Ashton Thomas Securities, Llc | 2.359 | -67,53 | 55 | -67,65 | ||||
| 2026-02-26 | 13F | Anchor Investment Management, LLC | 400 | 0,00 | 9 | 0,00 | ||||
| 2026-02-04 | 13F | 49 Wealth Management, Llc | 166.212 | 4,56 | 3.879 | 4,27 | ||||
| 2026-02-13 | 13F | Brown Advisory Inc | 45.180 | 0,00 | 1.055 | -0,28 | ||||
| 2026-04-07 | 13F | Farther Finance Advisors, LLC | 15.773 | -19,79 | 366 | -20,31 | ||||
| 2026-01-28 | 13F | Milestone Asset Management, Llc | 168.676 | 3.937 | ||||||
| 2026-04-08 | 13F | Community Financial Services Group, LLC | 125 | 3 | ||||||
| 2026-02-12 | 13F | Oder Investment Management, LLC | 203.835 | -0,60 | 4.758 | -0,88 | ||||
| 2026-02-04 | 13F | Strait & Sound Wealth Management LLC | 85.679 | 17,14 | 2.000 | 16,83 | ||||
| 2026-02-02 | 13F | AlphaStar Capital Management, LLC | 18.637 | -11,68 | 435 | -11,97 | ||||
| 2026-02-17 | 13F | WFA of San Diego, LLC | 0 | -100,00 | 0 | |||||
| 2026-02-13 | 13F | Mml Investors Services, Llc | 302.627 | 11,47 | 7.063 | 11,16 | ||||
| 2026-02-19 | 13F | Invesco Ltd. | 82.636 | 0,58 | 1.929 | 0,31 | ||||
| 2026-01-13 | 13F | Stablepoint Partners, LLC | 180.256 | 10,08 | 4.207 | 9,79 | ||||
| 2026-02-12 | 13F | Steward Partners Investment Advisory, Llc | 31.052 | -2,16 | 725 | -2,43 | ||||
| 2026-02-17 | 13F | Modern Wealth Management, LLC | 15.503 | 0,05 | 362 | -0,28 | ||||
| 2026-01-16 | 13F | Evexia Wealth Llc | 52.457 | -61,12 | 1.225 | -61,22 | ||||
| 2026-02-17 | 13F | Private Advisor Group, LLC | 150.472 | -2,04 | 3.512 | -2,31 | ||||
| 2026-04-02 | 13F | Collective Family Office Llc | 759.334 | 3,24 | 17.598 | 2,50 | ||||
| 2026-02-17 | 13F | Cetera Investment Advisers | 1.198.512 | -23,28 | 27.973 | -23,50 | ||||
| 2026-02-04 | 13F | MONECO Advisors, LLC | 13.635 | 2,58 | 318 | 2,25 | ||||
| 2026-04-06 | 13F | CX Institutional | 2.042 | 1,39 | 0 | |||||
| 2026-02-09 | 13F | Rhl Group, Llc | 640 | 15 | ||||||
| 2026-02-13 | 13F | Stifel Financial Corp | 172.510 | 70,52 | 4.026 | 70,09 | ||||
| 2026-02-13 | 13F | Wells Fargo & Company/mn | 1.033.370 | -4,18 | 24.119 | -4,45 | ||||
| 2025-11-03 | 13F | Summit Investment Advisory Services, LLC | 0 | -100,00 | 0 | |||||
| 2026-02-12 | 13F | Livet Wealth, LLC | 29.407 | 686 | ||||||
| 2026-02-03 | 13F | Ballast Advisors Llc | 0 | -100,00 | 0 | -100,00 | ||||
| 2026-02-13 | 13F | Mariner, LLC | 461.927 | 7,67 | 10.781 | 7,37 | ||||
| 2026-04-08 | 13F | Wealth Enhancement Advisory Services, Llc | 21.612 | -50,32 | 501 | -50,64 | ||||
| 2026-02-17 | 13F | Creative Planning | 9.836 | 230 | ||||||
| 2026-04-09 | 13F | Meriwether Wealth & Planning, LLC | 25.239 | -0,74 | 585 | -1,52 | ||||
| 2026-02-13 | 13F | Northwest Bancshares, Inc. | 90.831 | -1,31 | 2.120 | -1,62 | ||||
| 2026-02-13 | 13F | Morgan Stanley | 1.549.518 | -1,34 | 36.166 | -1,61 | ||||
| 2026-01-20 | 13F | Independence Bank of Kentucky | 101 | 0,00 | 2 | 0,00 | ||||
| 2026-02-17 | 13F/A | Sentinus, LLC | 12.475 | 291 | ||||||
| 2026-02-12 | 13F | Cloud Capital Management, LLC | 26.496 | 1 | ||||||
| 2026-01-14 | 13F | AA Financial Advisors, LLC | 85.397 | 9,49 | 1.993 | 9,21 | ||||
| 2026-02-06 | 13F | Advisory Alpha, LLC | 428.950 | -0,24 | 10.012 | -0,59 | ||||
| 2026-02-17 | 13F | Fmr Llc | 2.687 | 1.999,22 | 63 | 3.000,00 | ||||
| 2026-01-29 | 13F | UBS Group AG | 2.365.051 | -1,71 | 55.200 | -1,98 | ||||
| 2026-02-09 | 13F | Banta Asset Management Lp | 293.985 | 56,01 | 6.862 | 57,43 | ||||
| 2026-02-02 | 13F | Cornerstone Planning Group LLC | 90 | 2,27 | 2 | 0,00 | ||||
| 2026-02-17 | 13F | Advisory Services Network, LLC | 0 | -100,00 | 0 | |||||
| 2026-02-02 | 13F | Altrius Capital Management Inc | 52.955 | -4,53 | 1.236 | -4,85 | ||||
| 2026-02-05 | 13F | Thrivent Financial For Lutherans | 92.918 | 2 | ||||||
| 2026-01-16 | 13F | Empirical Financial Services, LLC d.b.a. Empirical Wealth Management | 33.242 | 2,76 | 776 | 2,38 | ||||
| 2026-02-13 | 13F | Alerus Financial Na | 2.570 | 0,00 | 60 | -1,67 | ||||
| 2026-02-17 | 13F | Warren Averett Asset Management, LLC | 9.143 | 4,32 | 213 | 3,90 | ||||
| 2026-01-22 | 13F | Glass Jacobson Investment Advisors llc | 136.955 | 12,67 | 3.197 | 12,38 | ||||
| 2026-01-20 | 13F | BXM Wealth LLC | 31.686 | 91,14 | 740 | 90,96 | ||||
| 2025-10-15 | 13F | Atwood & Palmer Inc | 0 | -100,00 | 0 | |||||
| 2025-11-14 | 13F | Fca Corp /tx | 0 | -100,00 | 0 | -100,00 | ||||
| 2026-01-29 | 13F | Comerica Bank | 16.809 | 0,00 | 392 | -0,25 | ||||
| 2026-02-17 | 13F | VestGen Advisors, LLC | 18.723 | -36,44 | 437 | -36,72 | ||||
| 2026-02-17 | 13F | Royal Bank Of Canada | 94.009 | -0,99 | 2.194 | -1,26 | ||||
| 2026-04-02 | 13F | Aspect Partners, LLC | 273 | 0,00 | 6 | 0,00 | ||||
| 2026-02-10 | 13F | Foundations Investment Advisors, LLC | 180.803 | 3,11 | 4.220 | 2,80 | ||||
| 2026-02-13 | 13F | Tassel Capital Management, Inc. | 13.547 | 32,20 | 316 | 32,22 | ||||
| 2026-02-11 | 13F | Montis Financial, LLC | 58.733 | 12,02 | 1.371 | 11,65 | ||||
| 2026-02-14 | 13F | Rockefeller Capital Management L.P. | 6.402 | 0,00 | 149 | 0,00 | ||||
| 2026-02-17 | 13F | Tower Research Capital LLC (TRC) | 44.716 | -83,89 | 1.044 | -83,94 | ||||
| 2026-02-05 | 13F | Intrua Financial, LLC | 201.095 | -12,96 | 4.694 | -13,21 | ||||
| 2025-11-14 | 13F | Guardian Wealth Advisors, Llc / Nc | 0 | -100,00 | 0 | |||||
| 2026-01-21 | 13F | Wilkins Miller Wealth Management, LLC | 29.351 | -10,18 | 685 | -10,34 | ||||
| 2026-02-05 | 13F | Atria Investments Llc | 497.895 | 16,62 | 11.621 | 16,29 | ||||
| 2026-02-18 | 13F | GWM Advisors LLC | 76.888 | 1,51 | 1.795 | 1,24 | ||||
| 2026-02-11 | 13F | Janney Montgomery Scott LLC | 17.578 | -21,20 | 0 | |||||
| 2026-03-17 | 13F | Cornerstone Planning, LLC | 436.296 | 10.193 | ||||||
| 2026-01-27 | 13F | Werba Rubin Papier Wealth Management | 61.989 | 0,27 | 1.447 | -0,07 | ||||
| 2026-02-12 | 13F | Triumph Capital Management | 1.447 | 34 | ||||||
| 2026-02-11 | 13F | J.w. Cole Advisors, Inc. | 35.116 | 7,12 | 805 | 4,95 | ||||
| 2026-02-09 | 13F | Prospera Financial Services Inc | 169.882 | 2,39 | 3.965 | 2,11 | ||||
| 2026-01-14 | 13F | Chatham Capital Group, Inc. | 177.299 | 5,50 | 4.138 | 5,21 | ||||
| 2026-01-23 | 13F | Diversify Advisory Services, LLC | 0 | -100,00 | 0 | |||||
| 2026-01-26 | 13F | BCS Wealth Management | 22.932 | 117,57 | 535 | 117,48 | ||||
| 2026-01-27 | 13F | Old Second National Bank Of Aurora | 231.893 | 9,09 | 5.412 | 8,78 | ||||
| 2026-02-17 | 13F | Advisor Group Holdings, Inc. | 669.888 | -1,26 | 15.636 | -1,47 | ||||
| 2026-02-13 | 13F | Arete Wealth Advisors, LLC | 13.013 | 0,00 | 0 | |||||
| 2026-01-14 | 13F | Accurate Wealth Management, LLC | 137.514 | 22,34 | 3.210 | 21,88 | ||||
| 2026-02-17 | 13F | Old Mission Capital Llc | 80.947 | 58,62 | 1.889 | 58,21 | ||||
| 2026-02-17 | 13F | Citadel Advisors Llc | 55.940 | -54,89 | 1.306 | -55,03 | ||||
| 2026-02-17 | 13F/A | Kovack Advisors, Inc. | 43.004 | 1.004 | ||||||
| 2026-02-09 | 13F | Pacific Wealth Strategies Group, Inc. | 125.580 | 24,95 | 2.931 | 24,62 | ||||
| 2026-02-12 | 13F | Brinker Capital Investments, LLC | 72.910 | 14,45 | 1.702 | 14,08 | ||||
| 2025-11-13 | 13F | Quadrature Capital Ltd | 0 | -100,00 | 0 | |||||
| 2026-03-20 | 13F | Purpose Unlimited Inc. | 400 | 9 | ||||||
| 2026-01-29 | 13F | Ashton Thomas Private Wealth, LLC | 715.471 | 0,10 | 16.699 | -0,18 | ||||
| 2026-02-17 | 13F | Captrust Financial Advisors | 19.862 | 4,55 | 464 | 4,28 | ||||
| 2026-02-05 | 13F | Flavin Financial Services, Inc. | 21.714 | -29,18 | 507 | -29,43 | ||||
| 2026-02-13 | 13F | Colony Group, LLC | 169.490 | 3.956 | ||||||
| 2026-01-20 | 13F | AdvisorNet Financial, Inc | 13.272 | -2,46 | 310 | -2,83 | ||||
| 2026-02-10 | 13F | Envestnet Asset Management Inc | 69.661 | -82,90 | 1.626 | -82,95 | ||||
| 2026-02-05 | 13F | Legacy Financial Group LLC | 335.035 | -54,25 | 7.796 | -54,51 | ||||
| 2026-02-05 | 13F | Stephens Inc /ar/ | 13.479 | -1,18 | 315 | -1,57 | ||||
| 2026-01-23 | 13F | Retirement Guys Formula Llc | 0 | -100,00 | 0 | |||||
| 2026-01-26 | 13F | Asset Dedication, LLC | 3.950 | 0,00 | 92 | 0,00 | ||||
| 2026-01-30 | 13F | United Community Bank | 0 | -100,00 | 0 | |||||
| 2026-01-14 | 13F | Wolff Wiese Magana Llc | 129 | 0,00 | 3 | 0,00 | ||||
| 2026-01-20 | 13F | Voisard Asset Management Group, Inc. | 25.152 | 20,30 | 587 | 20,04 | ||||
| 2026-02-03 | 13F | RFG Advisory, LLC | 0 | -100,00 | 0 | |||||
| 2026-01-26 | 13F | Private Trust Co Na | 8.804 | -9,36 | 205 | -9,69 | ||||
| 2026-02-12 | 13F | Sbe Llc Dba Cedar Cove Wealth Partners | 99.693 | 2.327 | ||||||
| 2026-01-21 | 13F | Leo Wealth, LLC | 363.358 | 8.481 | ||||||
| 2026-02-19 | 13F | Atomi Financial Group, Inc. | 12.189 | -92,48 | 284 | -92,52 | ||||
| 2026-02-10 | 13F | Sarver Vrooman Wealth Advisors | 1.227 | 0,00 | 29 | 0,00 | ||||
| 2026-01-15 | 13F | Brookstone Capital Management | 38.344 | 21,17 | 895 | 20,81 | ||||
| 2026-02-10 | 13F | Beto Financial Group, Llc | 125.896 | 2.931 | ||||||
| 2026-01-15 | 13F | Jaffetilchin Investment Partners, LLC | 906.565 | 1,88 | 21.159 | 1,59 | ||||
| 2026-02-11 | 13F | OneAscent Financial Services LLC | 18.185 | 424 | ||||||
| 2025-11-10 | 13F | Siligmueller & Norvid Wealth Advisors LLC | 0 | -100,00 | 0 | |||||
| 2026-02-12 | 13F | Jane Street Group, Llc | 0 | -100,00 | 0 | |||||
| 2026-02-17 | 13F | IHT Wealth Management, LLC | 344.061 | 27,56 | 8.030 | 27,20 | ||||
| 2025-11-03 | 13F | Absolute Capital Management, LLC | 0 | -100,00 | 0 | |||||
| 2026-04-09 | 13F | Wealth Quarterback LLC | 11.035 | 13,52 | 256 | 12,83 | ||||
| 2026-01-28 | 13F | Geneos Wealth Management Inc. | 67.858 | 1,59 | 1.584 | 1,28 | ||||
| 2026-04-10 | 13F | Ballew Advisors, Inc | 42.049 | 0,00 | 977 | -0,51 | ||||
| 2026-02-06 | 13F | Global Retirement Partners, LLC | 4.762 | 70,31 | 111 | 70,77 | ||||
| 2026-02-17 | 13F | Equitable Holdings, Inc. | 24.292 | -28,77 | 567 | -29,07 | ||||
| 2026-02-24 | 13F | Astoria Portfolio Advisors LLC. | 0 | -100,00 | 0 | |||||
| 2026-01-29 | 13F | 4Thought Financial Group Inc. | 22.154 | 5,75 | 517 | 5,51 | ||||
| 2026-02-13 | 13F | FF Advisors,LLC | 0 | -100,00 | 0 | |||||
| 2026-02-12 | 13F | Wagner Wealth Management, Corp | 35.584 | 831 | ||||||
| 2026-02-09 | 13F | Shufro Rose & Co Llc | 21.500 | 4,88 | 502 | 5,47 | ||||
| 2026-02-18 | 13F | SkyView Investment Advisors, LLC | 25.000 | 0,00 | 1 | |||||
| 2026-02-05 | 13F | Allworth Financial LP | 52.384 | -1,14 | 1.223 | -1,45 | ||||
| 2026-02-09 | 13F | Valtinson Bruner Financial Planning LLC | 17.902 | -1,23 | 418 | -1,65 | ||||
| 2026-02-18 | 13F | Beacon Pointe Advisors, LLC | 20.923 | 488 | ||||||
| 2026-02-05 | 13F | Cambridge Investment Research Advisors, Inc. | 60.518 | 8,14 | 1 | 0,00 | ||||
| 2026-02-03 | 13F | We Are One Seven, LLC | 199.664 | 13,99 | 4.660 | 13,69 | ||||
| 2026-02-17 | 13F | Claro Advisors LLC | 11.597 | 27,38 | 271 | 26,76 | ||||
| 2026-01-27 | 13F | Friedenthal Financial | 20 | -99,74 | 0 | -100,00 | ||||
| 2026-01-27 | 13F | Richards, Merrill & Peterson, Inc. | 1.783 | 0,00 | 42 | 0,00 |