Grundlæggende statistik
| Institutionelle ejere | 80 total, 80 long only, 0 short only, 0 long/short - change of -8,99% MRQ |
| Gennemsnitlig porteføljeallokering | 0.1113 % - change of 14,88% MRQ |
| Institutionelle aktier (lange) | 7.347.034 (ex 13D/G) - change of -0,15MM shares -2,05% MRQ |
| Institutionel værdi (lang) | $ 102.324 USD ($1000) |
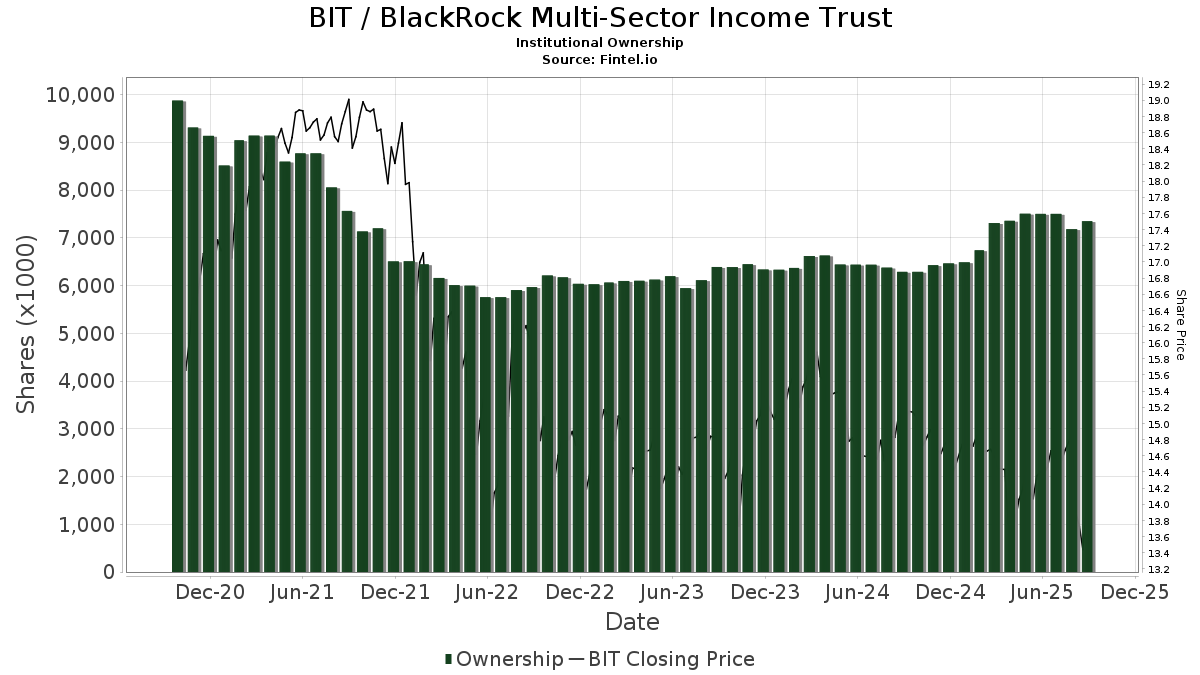
Institutionelt ejerskab og aktionærer
BlackRock Multi-Sector Income Trust (US:BIT) har 80 institutionelle ejere og aktionærer, der har indsendt 13D/G- eller 13F-formularer til Securities Exchange Commission (SEC). Disse institutioner har i alt 7,347,034 aktier. Største aktionærer omfatter Morgan Stanley, Cyndeo Wealth Partners, LLC, LPL Financial LLC, Ameriprise Financial Inc, Invesco Ltd., PCEF - Invesco CEF Income Composite ETF, Raymond James Financial Inc, Envestnet Asset Management Inc, UBS Group AG, and Guggenheim Capital Llc .
BlackRock Multi-Sector Income Trust (NYSE:BIT) institutionel ejerskabsstruktur viser aktuelle positioner i virksomheden efter institutioner og fonde, samt seneste ændringer i positionsstørrelse. Større aktionærer kan omfatte individuelle investorer, investeringsforeninger, hedgefonde eller institutioner. Skema 13D angiver, at investoren besidder (eller besidder) mere end 5 % af virksomheden og har til hensigt (eller har til hensigt at) aktivt at forfølge en ændring i forretningsstrategi. Skema 13G indikerer en passiv investering på over 5%.
The share price as of September 9, 2025 is 13,84 / share. Previously, on September 10, 2024, the share price was 15,01 / share. This represents a decline of 7,79% over that period.
Fondens stemningsscore
Fund Sentiment Score (fka Ownership Accumulation Score) finder de aktier, der bliver mest købt af fonde. Det er resultatet af en sofistikeret, multi-faktor kvantitativ model, der identificerer virksomheder med de højeste niveauer af institutionel akkumulering. Scoringsmodellen bruger en kombination af den samlede stigning i oplyste ejere, ændringerne i porteføljeallokeringer i disse ejere og andre målinger. Tallet går fra 0 til 100, hvor højere tal indikerer et højere niveau af akkumulering for sine jævnaldrende, og 50 er gennemsnittet.
Opdateringsfrekvens: Dagligt
Se Ownership Explorer, som giver en liste over højest rangerende virksomheder.
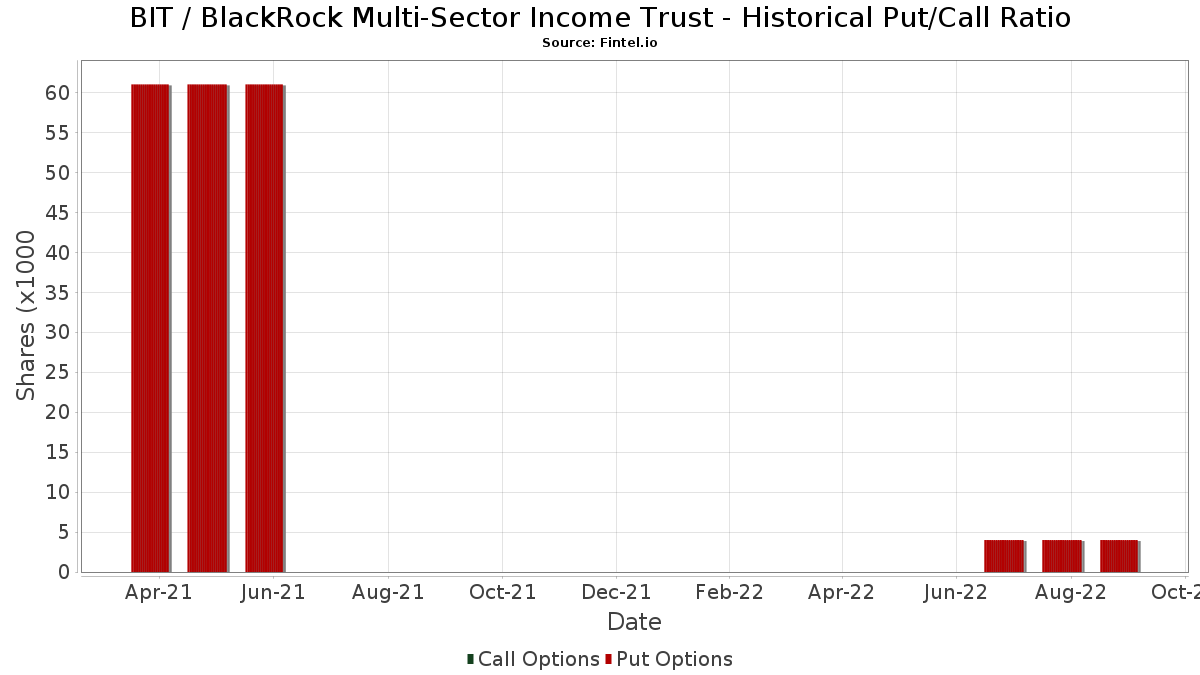
Institutionel Put/Call-forhold
Ud over at indberette standardaktie- og gældsudstedelser skal institutter med mere end 100 mill. aktiver under forvaltning også oplyse deres put- og call-optionsbeholdninger. Da salgsoptioner generelt indikerer negativ stemning, og købsoptioner indikerer positiv stemning, kan vi få en fornemmelse af den overordnede institutionelle stemning ved at plotte forholdet mellem put og kald. Diagrammet til højre viser det historiske put/call-forhold for dette instrument.
Brug af Put/Call Ratio som en indikator for investorernes stemning overvinder en af de vigtigste mangler ved at bruge totalt institutionelt ejerskab, som er, at en betydelig mængde af aktiver under forvaltning investeres passivt for at spore indekser. Passivt forvaltede fonde køber typisk ikke optioner, så indikatoren for put/call-forholdet følger mere nøje følelsen af aktivt forvaltede fonde.
13F og NPORT arkivering
Detaljer om 13F-arkivering er gratis. Detaljer om NP-ansøgninger kræver et premium-medlemskab. Grønne rækker angiver nye positioner. Røde rækker angiver lukkede positioner. Klik på linket ikon for at se den fulde transaktionshistorik.
Opgrader
for at låse premium-data op og eksportere til Excel ![]() .
.
| Fil dato | Kilde | Investor | Type | Gennemsnitlig pris (Øst) |
Aktier | Δ Aktier (%) |
Rapporteret Værdi ($1000) |
Δ Værdi (%) |
Port Alloc (%) |
|
|---|---|---|---|---|---|---|---|---|---|---|
| 2025-08-29 | NP | GraniteShares ETF Trust - GraniteShares HIPS US High Income ETF | 191.623 | 6,67 | 2.798 | 7,54 | ||||
| 2025-08-27 | NP | THRIVENT SERIES FUND INC - Thrivent Diversified Income Plus Portfolio Class A | 11.523 | 0,00 | 168 | 1,20 | ||||
| 2025-08-06 | 13F | Smh Capital Advisors Inc | 12.416 | -1,57 | 181 | -0,55 | ||||
| 2025-07-31 | 13F | Curio Wealth, Llc | 0 | -100,00 | 0 | |||||
| 2025-08-01 | 13F | Envestnet Asset Management Inc | 290.990 | 9,21 | 4.248 | 10,11 | ||||
| 2025-07-11 | 13F | Farther Finance Advisors, LLC | 391 | 0,00 | 6 | 0,00 | ||||
| 2025-08-14 | 13F | Stifel Financial Corp | 18.305 | 1,25 | 267 | 2,30 | ||||
| 2025-08-11 | 13F | Western Wealth Management, LLC | 11.609 | 0,00 | 169 | 0,60 | ||||
| 2025-08-14 | 13F | Comerica Bank | 6.950 | 7,75 | 101 | 8,60 | ||||
| 2025-08-05 | 13F | Fourth Dimension Wealth, LLC | 1.000 | 0,00 | 15 | 0,00 | ||||
| 2025-09-04 | 13F/A | Advisor Group Holdings, Inc. | 119.618 | -3,31 | 1.746 | -2,51 | ||||
| 2025-08-06 | 13F | Walkner Condon Financial Advisors LLC | 14.243 | 0,00 | 208 | 0,49 | ||||
| 2025-08-14 | 13F | Royal Bank Of Canada | 217.447 | -4,76 | 3.174 | -3,96 | ||||
| 2025-08-06 | 13F | Pekin Hardy Strauss, Inc. | 70.365 | 189,99 | 1.027 | 192,59 | ||||
| 2025-07-25 | NP | FCEF - First Trust CEF Income Opportunity ETF This fund is a listed as child fund of First Trust Advisors Lp and if that institution has disclosed ownership in this security, then these positions will not be double counted when calculating total shares and total value | 23.030 | 16,00 | 328 | 12,37 | ||||
| 2025-07-10 | 13F | Contravisory Investment Management, Inc. | 0 | -100,00 | 0 | |||||
| 2025-07-24 | 13F | Us Bancorp \de\ | 0 | -100,00 | 0 | |||||
| 2025-04-21 | 13F | ORG Partners LLC | 0 | -100,00 | 0 | |||||
| 2025-08-13 | 13F | WCG Wealth Advisors LLC | 29.375 | 429 | ||||||
| 2025-08-14 | 13F | Sunbelt Securities, Inc. | 0 | -100,00 | 0 | |||||
| 2025-05-15 | 13F | WPG Advisers, LLC | 0 | -100,00 | 0 | |||||
| 2025-08-12 | 13F | LPL Financial LLC | 514.672 | 71,95 | 7.514 | 73,37 | ||||
| 2025-07-11 | 13F/A | Umb Bank N A/mo | 500 | 0,00 | 7 | 0,00 | ||||
| 2025-07-24 | 13F | Cyndeo Wealth Partners, LLC | 668.770 | -8,87 | 9.764 | -8,11 | ||||
| 2025-08-14 | 13F | Mariner, LLC | 103.697 | 26,46 | 1.514 | 27,46 | ||||
| 2025-05-16 | 13F | Coppell Advisory Solutions LLC | 0 | -100,00 | 0 | |||||
| 2025-08-26 | 13F/A | Thrivent Financial For Lutherans | 152.795 | 0,00 | 2 | 0,00 | ||||
| 2025-08-08 | 13F | Cetera Investment Advisers | 59.446 | 3,22 | 868 | 4,08 | ||||
| 2025-07-22 | 13F | DAVENPORT & Co LLC | 29.345 | -8,99 | 428 | -8,15 | ||||
| 2025-08-06 | 13F | Golden State Wealth Management, LLC | 1.120 | 2,00 | 16 | 6,67 | ||||
| 2025-08-14 | 13F | LaSalle St. Investment Advisors, LLC | 0 | -100,00 | 0 | |||||
| 2025-08-14 | 13F | Wells Fargo & Company/mn | 89.094 | -13,48 | 1.301 | -12,81 | ||||
| 2025-08-14 | 13F | GWM Advisors LLC | 84.429 | 2,03 | 1.233 | 2,84 | ||||
| 2025-08-11 | 13F | Semus Wealth Partners LLC | 26.118 | -4,53 | 381 | -3,79 | ||||
| 2025-08-18 | 13F | Geneos Wealth Management Inc. | 500 | 0,00 | 7 | 0,00 | ||||
| 2025-05-14 | 13F | Jane Street Group, Llc | 0 | -100,00 | 0 | |||||
| 2025-07-17 | 13F | Janney Montgomery Scott LLC | 65.493 | 11,65 | 1 | |||||
| 2025-07-31 | 13F | Cambridge Investment Research Advisors, Inc. | 67.734 | -44,09 | 1 | -100,00 | ||||
| 2025-08-14 | 13F | Ameriprise Financial Inc | 435.963 | -28,88 | 6.365 | -28,17 | ||||
| 2025-08-07 | 13F | Readystate Asset Management Lp | 0 | -100,00 | 0 | |||||
| 2025-08-05 | 13F | GPS Wealth Strategies Group, LLC | 1.900 | 0,00 | 28 | 0,00 | ||||
| 2025-08-08 | 13F | Pnc Financial Services Group, Inc. | 500 | 0,00 | 7 | 0,00 | ||||
| 2025-08-01 | 13F | Gwn Securities Inc. | 14.620 | 213 | ||||||
| 2025-08-27 | NP | THRIVENT SERIES FUND INC - Thrivent Balanced Income Plus Portfolio Class A | 4.532 | 0,00 | 66 | 1,54 | ||||
| 2025-08-14 | 13F | CoreCap Advisors, LLC | 4.400 | -18,52 | 64 | -17,95 | ||||
| 2025-07-21 | 13F | Ameritas Advisory Services, LLC | 580 | 8 | ||||||
| 2025-08-07 | 13F | Allworth Financial LP | 100 | 0,00 | 1 | 0,00 | ||||
| 2025-08-06 | 13F | Wedbush Securities Inc | 14.491 | 0 | ||||||
| 2025-07-18 | 13F | Truist Financial Corp | 116.774 | 8,09 | 1.705 | 8,95 | ||||
| 2025-07-14 | 13F | AdvisorNet Financial, Inc | 1.045 | 15 | ||||||
| 2025-07-17 | 13F | GraniteShares Advisors LLC | 191.623 | 6,67 | 2.798 | 7,54 | ||||
| 2025-05-05 | 13F | Transce3nd, LLC | 0 | -100,00 | 0 | |||||
| 2025-07-23 | 13F | Clear Creek Financial Management, LLC | 0 | -100,00 | 0 | |||||
| 2025-08-13 | 13F | Northwestern Mutual Wealth Management Co | 9.980 | 0,00 | 146 | 0,69 | ||||
| 2025-04-30 | 13F | Ramiah Investment Group | 34.274 | 496 | ||||||
| 2025-08-27 | NP | AAHYX - Thrivent Diversified Income Plus Fund Class A | 18.346 | 0,00 | 268 | 0,75 | ||||
| 2025-07-10 | 13F | Wealth Enhancement Advisory Services, Llc | 0 | -100,00 | 0 | |||||
| 2025-08-14 | 13F/A | Rockefeller Capital Management L.P. | 46.484 | 12,04 | 679 | 13,00 | ||||
| 2025-08-14 | 13F | Raymond James Financial Inc | 344.499 | -8,64 | 5.030 | -7,89 | ||||
| 2025-08-13 | 13F | Cerity Partners LLC | 53.209 | 0,01 | 777 | 0,78 | ||||
| 2025-08-13 | 13F | Guggenheim Capital Llc | 271.427 | 65,99 | 3.963 | 67,38 | ||||
| 2025-08-13 | 13F | First Trust Advisors Lp | 61.478 | 7,09 | 898 | 7,94 | ||||
| 2025-08-11 | 13F | HighTower Advisors, LLC | 12.510 | -4,57 | 183 | -3,70 | ||||
| 2025-07-29 | 13F | Private Trust Co Na | 5.242 | 0,00 | 77 | 1,33 | ||||
| 2025-08-27 | NP | THRIVENT SERIES FUND INC - Thrivent Opportunity Income Plus Portfolio Class A | 8.813 | 0,00 | 129 | 0,79 | ||||
| 2025-07-16 | 13F | ORG Wealth Partners, LLC | 3.343 | 0,00 | 49 | 0,00 | ||||
| 2025-07-23 | 13F | Elm3 Financial Group, LLC | 27.261 | 6,76 | 398 | 7,86 | ||||
| 2025-08-05 | 13F | Shaker Financial Services, LLC | 0 | -100,00 | 0 | |||||
| 2025-08-15 | 13F | Morgan Stanley | 1.286.694 | -4,82 | 18.786 | -4,03 | ||||
| 2025-06-26 | NP | AAINX - Thrivent Opportunity Income Plus Fund Class A | 39.295 | 0,00 | 552 | -4,83 | ||||
| 2025-07-08 | 13F | Webster Bank, N. A. | 2.255 | 0,00 | 33 | 0,00 | ||||
| 2025-08-12 | 13F | Steward Partners Investment Advisory, Llc | 100.237 | 13,49 | 1.463 | 14,48 | ||||
| 2025-08-13 | 13F | Invesco Ltd. | 351.527 | -1,00 | 5.132 | -0,18 | ||||
| 2025-07-29 | 13F | Stratos Wealth Partners, LTD. | 14.385 | 210 | ||||||
| 2025-08-04 | 13F | Spire Wealth Management | 10.000 | 0,00 | 146 | 1,39 | ||||
| 2025-07-25 | 13F | Concurrent Investment Advisors, LLC | 14.069 | 15,13 | 205 | 16,48 | ||||
| 2025-08-11 | 13F | Elequin Capital Lp | 0 | -100,00 | 0 | |||||
| 2025-08-11 | 13F | Principal Securities, Inc. | 9.165 | 1,04 | 134 | 0,76 | ||||
| 2025-08-15 | 13F | Tower Research Capital LLC (TRC) | 7 | 0 | ||||||
| 2025-07-25 | 13F | Atria Wealth Solutions, Inc. | 0 | -100,00 | 0 | |||||
| 2025-07-28 | NP | PCEF - Invesco CEF Income Composite ETF This fund is a listed as child fund of Invesco Ltd. and if that institution has disclosed ownership in this security, then these positions will not be double counted when calculating total shares and total value | 348.196 | 2,15 | 4.955 | -1,06 | ||||
| 2025-08-14 | 13F | UBS Group AG | 280.667 | -0,20 | 4.098 | 0,61 | ||||
| 2025-04-09 | 13F | St Germain D J Co Inc | 0 | 0 | ||||||
| 2025-08-07 | 13F | Evoke Wealth, Llc | 79.506 | 0,00 | 1.161 | 0,78 | ||||
| 2025-08-14 | 13F | Snowden Capital Advisors LLC | 29.688 | -2,08 | 433 | -1,37 | ||||
| 2025-06-26 | NP | AABFX - Thrivent Balanced Income Plus Fund Class A | 4.902 | 0,00 | 69 | -5,56 | ||||
| 2025-04-16 | 13F | West Oak Capital, LLC | 0 | -100,00 | 0 | |||||
| 2025-08-05 | 13F | Bank of New York Mellon Corp | 132.289 | 1.931 | ||||||
| 2025-08-19 | 13F | Advisory Services Network, LLC | 21.472 | -4,45 | 315 | -3,08 | ||||
| 2025-07-14 | 13F | E&G Advisors, LP | 78.400 | -1,38 | 1.145 | -0,61 | ||||
| 2025-08-05 | 13F | Westside Investment Management, Inc. | 0 | -100,00 | 0 | |||||
| 2025-08-04 | 13F | Creekmur Asset Management LLC | 4.719 | 161,44 | 69 | 161,54 | ||||
| 2025-07-14 | 13F | U.S. Capital Wealth Advisors, LLC | 0 | -100,00 | 0 | |||||
| 2025-08-06 | 13F | Commonwealth Equity Services, Llc | 33.719 | 4,05 | 0 | |||||
| 2025-08-12 | 13F | Proequities, Inc. | 0 | 0 | ||||||
| 2025-07-07 | 13F | First Citizens Financial Corp | 15.603 | 0,00 | 228 | 0,89 | ||||
| 2025-05-12 | 13F | Virtu Financial LLC | 0 | -100,00 | 0 | |||||
| 2025-08-12 | 13F | Founders Financial Alliance, LLC | 0 | -100,00 | 0 | |||||
| 2025-04-24 | 13F | Primoris Wealth Advisors, Llc | 0 | -100,00 | 0 | |||||
| 2025-05-12 | 13F | Wolverine Asset Management Llc | 0 | -100,00 | 0 | |||||
| 2025-05-14 | 13F | Landscape Capital Management, L.l.c. | 0 | -100,00 | 0 | |||||
| 2025-07-28 | 13F | Harbour Investments, Inc. | 1.276 | 0,00 | 19 | 0,00 | ||||
| 2025-05-13 | 13F | Verus Capital Partners, Llc | 0 | -100,00 | 0 | |||||
| 2025-08-14 | 13F | EP Wealth Advisors, Inc. | 10.479 | -4,55 | 153 | -3,80 | ||||
| 2025-08-14 | 13F | Bank Of America Corp /de/ | 216.549 | -1,94 | 3.162 | -1,13 | ||||
| 2025-08-11 | 13F | Private Advisor Group, LLC | 54.061 | -17,15 | 789 | -16,42 | ||||
| 2025-08-12 | 13F | Boreal Capital Management LLC | 0 | 455 | ||||||
| 2025-08-14 | 13F | Wiley Bros.-aintree Capital, Llc | 13.108 | 6,60 | 191 | 7,91 | ||||
| 2025-08-13 | 13F | StoneX Group Inc. | 0 | -100,00 | 0 | -100,00 |