Grundlæggende statistik
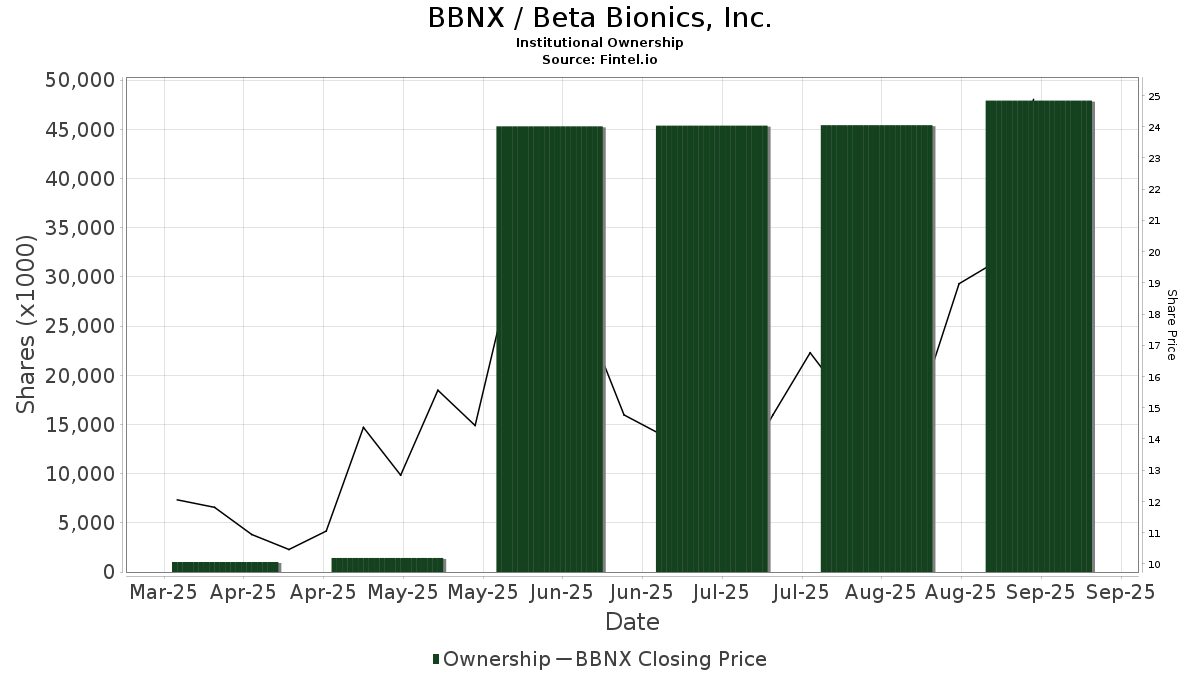
| Institutionelle aktier (lange) | 47.576.281 - 107,20% (ex 13D/G) - change of -3,76MM shares -7,33% MRQ |
| Institutionel værdi (lang) | $ 1.408.481 USD ($1000) |
Institutionelt ejerskab og aktionærer
Beta Bionics, Inc. (US:BBNX) har 179 institutionelle ejere og aktionærer, der har indsendt 13D/G- eller 13F-formularer til Securities Exchange Commission (SEC). Disse institutioner har i alt 47,576,281 aktier. Største aktionærer omfatter Eventide Asset Management, Llc, Farallon Capital Management Llc, Sands Capital Ventures, LLC, Morgan Stanley, BlackRock, Inc., Soleus Capital Management, L.P., Rtw Investments, Lp, Vanguard Group Inc, Healthcare Of Ontario Pension Plan Trust Fund, and Omega Fund Management, LLC .
Beta Bionics, Inc. (NasdaqGM:BBNX) institutionel ejerskabsstruktur viser aktuelle positioner i virksomheden efter institutioner og fonde, samt seneste ændringer i positionsstørrelse. Større aktionærer kan omfatte individuelle investorer, investeringsforeninger, hedgefonde eller institutioner. Skema 13D angiver, at investoren besidder (eller besidder) mere end 5 % af virksomheden og har til hensigt (eller har til hensigt at) aktivt at forfølge en ændring i forretningsstrategi. Skema 13G indikerer en passiv investering på over 5%.
The share price as of March 12, 2026 is 10,11 / share. Previously, on March 13, 2025, the share price was 14,04 / share. This represents a decline of 27,99% over that period.
Fondens stemningsscore
Fund Sentiment Score (fka Ownership Accumulation Score) finder de aktier, der bliver mest købt af fonde. Det er resultatet af en sofistikeret, multi-faktor kvantitativ model, der identificerer virksomheder med de højeste niveauer af institutionel akkumulering. Scoringsmodellen bruger en kombination af den samlede stigning i oplyste ejere, ændringerne i porteføljeallokeringer i disse ejere og andre målinger. Tallet går fra 0 til 100, hvor højere tal indikerer et højere niveau af akkumulering for sine jævnaldrende, og 50 er gennemsnittet.
Opdateringsfrekvens: Dagligt
Se Ownership Explorer, som giver en liste over højest rangerende virksomheder.
AI+ Ask Fintel’s AI assistant about Beta Bionics, Inc..
Select a question to share a public post with an AI-crafted answer.
Thinking of good questions…
Institutionel Put/Call-forhold
Ud over at indberette standardaktie- og gældsudstedelser skal institutter med mere end 100 mill. aktiver under forvaltning også oplyse deres put- og call-optionsbeholdninger. Da salgsoptioner generelt indikerer negativ stemning, og købsoptioner indikerer positiv stemning, kan vi få en fornemmelse af den overordnede institutionelle stemning ved at plotte forholdet mellem put og kald. Diagrammet til højre viser det historiske put/call-forhold for dette instrument.
Brug af Put/Call Ratio som en indikator for investorernes stemning overvinder en af de vigtigste mangler ved at bruge totalt institutionelt ejerskab, som er, at en betydelig mængde af aktiver under forvaltning investeres passivt for at spore indekser. Passivt forvaltede fonde køber typisk ikke optioner, så indikatoren for put/call-forholdet følger mere nøje følelsen af aktivt forvaltede fonde.
13D/G-arkivering
Vi præsenterer 13D/G ansøgninger separat fra 13F ansøgninger på grund af den forskellige behandling af SEC. 13D/G-ansøgninger kan indgives af grupper af investorer (med én ledende), hvorimod 13F-ansøgninger ikke kan. Dette resulterer i situationer, hvor en investor kan indsende en 13D/G, der rapporterer én værdi for de samlede aktier (der repræsenterer alle de aktier, der ejes af investorgruppen), men derefter indsender en 13F, der rapporterer en anden værdi for de samlede aktier (der udelukkende repræsenterer deres egne) ejendomsret). Det betyder, at aktieejerskab af 13D/G-arkiver og 13F-arkiveringer ofte ikke er direkte sammenlignelige, så vi præsenterer dem separat.
Bemærk: Fra den 16. maj 2021 viser vi ikke længere ejere, der ikke har indsendt en 13D/G inden for det seneste år. Tidligere viste vi den fulde historie af 13D/G-arkiver. Generelt skal enheder, der er forpligtet til at indgive 13D/G-ansøgninger, indgive mindst årligt, før de indsender en afsluttende ansøgning. Dog forlader fonde nogle gange positioner uden at indsende en afsluttende ansøgning (dvs. de afvikler), så visning af den fulde historie resulterede nogle gange i forvirring om det nuværende ejerskab. For at undgå forvirring viser vi nu kun 'aktuelle' ejere - det vil sige - ejere, der har anmeldt inden for det seneste år.
Upgrade to unlock premium data.
| Fil dato | Form | Investor | Forrige Aktier |
Seneste Aktier |
Δ Aktier (Procent) |
Ejendomsret (Procent) |
Δ Ejerskab (Procent) |
|
|---|---|---|---|---|---|---|---|---|
| 2026-02-23 | Point72 Asset Management, L.P. | 2,290,023 | 5.20 | |||||
| 2026-02-17 | RTW INVESTMENTS, LP | 3,299,869 | 2,500,000 | -24.24 | 5.70 | -25.00 | ||
| 2026-02-12 | Soleus BB SPV, LLC | 3,795,341 | 2,534,565 | -33.22 | 5.80 | -34.09 | ||
| 2026-02-10 | WELLINGTON MANAGEMENT GROUP LLP | 3,901,599 | 0 | -100.00 | 0.00 | -100.00 | ||
| 2026-02-10 | Wellington Hadley Harbor Aggregator IV, L.P. | 3,901,599 | 0 | -100.00 | 0.00 | -100.00 | ||
| 2026-02-09 | Farallon Capital Partners, L.P. | 4,203,920 | 4,379,920 | 4.19 | 9.90 | 2.06 | ||
| 2025-11-12 | Zone Healthcare Holdings, LLC | 3,427,220 | 4,313,920 | 25.87 | 9.90 | 25.32 | ||
| 2025-11-07 | MORGAN STANLEY | 2,928,838 | 3,739,567 | 27.68 | 8.60 | 26.47 | ||
| 2025-10-30 | VANGUARD GROUP INC | 2,216,185 | 5.09 | |||||
| 2025-10-17 | BlackRock, Inc. | 2,778,764 | 6.40 | |||||
| 2025-10-16 | MILLENNIUM MANAGEMENT LLC | 2,286,728 | 796,964 | -65.15 | 1.80 | -66.04 | ||
| 2025-08-13 | Sands Capital Life Sciences Pulse Fund II, L.P. | 3,154,409 | 3,570,113 | 13.18 | 8.20 | 12.33 | ||
| 2025-08-07 | PERCEPTIVE ADVISORS LLC | 2,203,840 | 1,593,608 | -27.69 | 3.68 | -27.84 |
13F og NPORT arkivering
Detaljer om 13F-arkivering er gratis. Detaljer om NP-ansøgninger kræver et premium-medlemskab. Grønne rækker angiver nye positioner. Røde rækker angiver lukkede positioner. Klik på linket ikon for at se den fulde transaktionshistorik.
Opgrader
for at låse premium-data op og eksportere til Excel ![]() .
.
| Fil dato | Kilde | Investor | Type | Gennemsnitlig pris (Øst) |
Aktier | Δ Aktier (%) |
Rapporteret Værdi ($1000) |
Δ Værdi (%) |
Port Alloc (%) |
|
|---|---|---|---|---|---|---|---|---|---|---|
| 2026-02-17 | 13F | Dark Forest Capital Management Lp | 20.906 | -62,84 | 637 | -42,97 | ||||
| 2026-02-17 | 13F | Man Group plc | 11.321 | 345 | ||||||
| 2025-09-24 | NP | PPNMX - SmallCap Growth Fund I R-3 | 613 | -99,52 | 10 | -99,30 | ||||
| 2026-02-13 | 13F | Police & Firemen's Retirement System of New Jersey | 10.346 | 0,00 | 315 | 53,66 | ||||
| 2025-11-10 | 13F | Hartland & Co., LLC | 0 | -100,00 | 0 | |||||
| 2026-02-17 | 13F | Raymond James Financial Inc | 197.939 | -3,11 | 6.318 | 55,65 | ||||
| 2026-01-28 | 13F | CAPROCK Group, Inc. | 12.117 | 17,10 | 369 | 90,21 | ||||
| 2026-02-20 | 13F | Sunbelt Securities, Inc. | 29 | 0,00 | 1 | |||||
| 2026-01-08 | 13F | Versant Capital Management, Inc | 1.143 | 0,00 | 35 | 54,55 | ||||
| 2025-10-30 | 13F | Jennison Associates Llc | 0 | -100,00 | 0 | |||||
| 2026-01-29 | 13F | Comerica Bank | 95 | -2,06 | 3 | 100,00 | ||||
| 2026-01-09 | 13F | SG Americas Securities, LLC | 150.277 | 5 | ||||||
| 2026-02-19 | 13F | Invesco Ltd. | 117.360 | 140,89 | 3.576 | 269,32 | ||||
| 2026-02-12 | 13F | Voya Investment Management Llc | 30.366 | 925 | ||||||
| 2026-02-13 | 13F | Rhumbline Advisers | 42.858 | -9,04 | 1.306 | 39,42 | ||||
| 2025-09-26 | NP | USMIX - Extended Market Index Fund | 3.861 | 65 | ||||||
| 2026-02-12 | 13F | Renaissance Technologies Llc | 0 | -100,00 | 0 | |||||
| 2026-02-13 | 13F | Lord, Abbett & Co. Llc | 430.403 | 18,10 | 13 | 85,71 | ||||
| 2026-02-13 | 13F | MAI Capital Management | 625 | 0,00 | 19 | 58,33 | ||||
| 2026-02-17 | 13F | Two Sigma Investments, Lp | 410.603 | 150,73 | 12.511 | 284,60 | ||||
| 2026-02-13 | 13F | Morgan Stanley | 3.459.453 | -8,03 | 105.410 | 41,03 | ||||
| 2026-02-10 | 13F | Intech Investment Management Llc | 12.891 | 393 | ||||||
| 2026-02-17 | 13F | Vestal Point Capital, LP | 600.000 | 0,00 | 18.282 | 53,35 | ||||
| 2025-09-26 | NP | SLPIX - Small-cap Profund Investor Class | 12 | -7,69 | 0 | |||||
| 2026-02-05 | 13F | Amalgamated Bank | 1.223 | 168,20 | 0 | |||||
| 2026-02-17 | 13F | Alliancebernstein L.p. | 35.400 | 44,49 | 1.079 | 121,81 | ||||
| 2025-09-29 | NP | LAMGX - Lord Abbett Micro-Cap Growth Fund Class A | 102.505 | 96,81 | 1.721 | 199,30 | ||||
| 2026-02-17 | 13F | California State Teachers Retirement System | 2.397 | -5,63 | 73 | 46,00 | ||||
| 2026-01-30 | 13F | Sigma Planning Corp | 13.500 | 411 | ||||||
| 2026-02-17 | 13F | Driehaus Capital Management Llc | 956.784 | -9,65 | 29.153 | 38,55 | ||||
| 2026-02-17 | 13F | Freestone Grove Partners LP | 138.138 | 4.209 | ||||||
| 2026-02-13 | 13F | Vontobel Holding Ltd. | 24.152 | 736 | ||||||
| 2026-02-17 | 13F | Brevan Howard Capital Management LP | 9.607 | 293 | ||||||
| 2026-02-13 | 13F | SRS Capital Advisors, Inc. | 45 | -95,14 | 1 | -94,44 | ||||
| 2026-02-17 | 13F | Susquehanna International Group, Llp | 14.833 | 452 | ||||||
| 2025-09-24 | NP | PJARX - SmallCap Value Fund II R-3 | 110 | -61,40 | 2 | -66,67 | ||||
| 2026-02-17 | 13F | Longaeva Partners L.P. | 0 | -100,00 | 0 | |||||
| 2026-02-17 | 13F | Ameriprise Financial Inc | 32.409 | -8,68 | 988 | 40,00 | ||||
| 2025-09-29 | NP | SUNAMERICA SERIES TRUST - SA Small Cap Index Portfolio Class 1 | 1.342 | -10,83 | 23 | 37,50 | ||||
| 2026-02-13 | 13F | Walleye Capital LLC | 646.539 | 9,36 | 19.700 | 67,72 | ||||
| 2025-09-26 | NP | PCSGX - PACE Small/Medium Co Growth Equity Investments Class P | 12.828 | 215 | ||||||
| 2026-02-06 | 13F | ProShare Advisors LLC | 7.115 | 217 | ||||||
| 2026-02-17 | 13F | Fmr Llc | 17.111 | 1,79 | 521 | 55,99 | ||||
| 2026-02-17 | 13F | Farallon Capital Management Llc | 4.313.920 | 0,00 | 131.445 | 53,35 | ||||
| 2025-11-14 | 13F | Woodline Partners LP | 0 | -100,00 | 0 | |||||
| 2026-01-08 | 13F | True Wealth Design, LLC | 106 | 0,00 | 3 | 50,00 | ||||
| 2026-02-17 | 13F | Rakuten Investment Management, Inc. | 0 | -100,00 | 0 | |||||
| 2026-02-04 | 13F | First Eagle Investment Management, LLC | 253.702 | 8,79 | 7.730 | 66,85 | ||||
| 2025-09-25 | NP | QUASX - AB Small Cap Growth Portfolio Class A | 0 | -100,00 | 0 | -100,00 | ||||
| 2026-02-06 | 13F | IFP Advisors, Inc | 20 | 0,00 | 1 | |||||
| 2026-02-13 | 13F | Brown Advisory Inc | 11.946 | 0,00 | 364 | 53,16 | ||||
| 2026-02-17 | 13F | ArrowMark Colorado Holdings LLC | 9.083 | 277 | ||||||
| 2026-02-17 | 13F | Clear Street Markets Llc | 1.697 | 52 | ||||||
| 2026-02-06 | 13F | Pnc Financial Services Group, Inc. | 100 | 100,00 | 3 | |||||
| 2026-02-06 | 13F | Larson Financial Group LLC | 277 | 8 | ||||||
| 2026-02-17 | 13F | Granahan Investment Management Inc/ma | 0 | -100,00 | 0 | |||||
| 2026-02-13 | 13F | Manufacturers Life Insurance Company, The | 0 | -100,00 | 0 | |||||
| 2026-02-17 | 13F | Caisse De Depot Et Placement Du Quebec | 0 | -100,00 | 0 | |||||
| 2025-09-26 | NP | TISBX - TIAA-CREF Small-Cap Blend Index Fund Institutional Class | 17.044 | 0,00 | 286 | 52,13 | ||||
| 2026-01-23 | 13F | Farther Finance Advisors, LLC | 292 | 0,69 | 9 | 60,00 | ||||
| 2026-02-17 | 13F | Citadel Advisors Llc | 320.880 | 9.777 | ||||||
| 2026-02-17 | 13F | Advisor Group Holdings, Inc. | 48.100 | 2.453,08 | 1.465 | 4.085,71 | ||||
| 2026-02-17 | 13F | Citadel Advisors Llc | Call | 10.300 | 314 | |||||
| 2026-02-17 | 13F | Quantinno Capital Management LP | 31.883 | 19,82 | 971 | 83,90 | ||||
| 2026-02-17 | 13F | Lykos Global Management, LP | 10.000 | 305 | ||||||
| 2026-01-29 | 13F | Calamos Advisors LLC | 36.091 | 11,73 | 1.100 | 71,45 | ||||
| 2026-02-17 | 13F | Engineers Gate Manager LP | 8.247 | 251 | ||||||
| 2026-02-17 | 13F | XTX Topco Ltd | 43.990 | 1.340 | ||||||
| 2026-02-17 | 13F | Eversept Partners, LP | 678.262 | 20.667 | ||||||
| 2026-02-05 | 13F | Baader Bank INC | 11.000 | 335 | ||||||
| 2025-11-17 | 13F | Alyeska Investment Group, L.P. | 0 | -100,00 | 0 | -100,00 | ||||
| 2026-01-30 | 13F | Values First Advisors, Inc. | 35.191 | -13,03 | 1.072 | 33,33 | ||||
| 2026-02-17 | 13F | Russell Investments Group, Ltd. | 205.837 | 118,45 | 6.272 | 234,99 | ||||
| 2025-11-14 | 13F | Ra Capital Management, L.p. | 0 | -100,00 | 0 | |||||
| 2026-02-17 | 13F | Tower Research Capital LLC (TRC) | 7.474 | 490,83 | 228 | 808,00 | ||||
| 2026-02-17 | 13F | Ghisallo Capital Management LLC | 0 | -100,00 | 0 | |||||
| 2026-02-05 | 13F | Allworth Financial LP | 19 | 850,00 | 1 | |||||
| 2025-11-14 | 13F | Kent Lake PR LLC | 125.000 | 2.484 | ||||||
| 2025-09-26 | NP | FSSNX - Fidelity Small Cap Index Fund This fund is a listed as child fund of Fmr Llc and if that institution has disclosed ownership in this security, then these positions will not be double counted when calculating total shares and total value | 131.748 | -2,12 | 2.212 | 48,76 | ||||
| 2026-02-12 | 13F | CIBC Private Wealth Group, LLC | 6.301 | 630.000,00 | 192 | |||||
| 2026-02-17 | 13F | Qube Research & Technologies Ltd | 17.378 | 530 | ||||||
| 2026-02-12 | 13F | New York State Common Retirement Fund | 12.200 | 0,00 | 372 | 53,31 | ||||
| 2026-02-17 | 13F | Bank Of America Corp /de/ | 432.340 | 118,68 | 13.173 | 235,36 | ||||
| 2026-01-15 | 13F | Zevenbergen Capital Investments Llc | 13.350 | 407 | ||||||
| 2026-01-26 | 13F | Private Trust Co Na | 0 | -100,00 | 0 | |||||
| 2026-02-17 | 13F | Numerai GP LLC | 34.285 | 1.045 | ||||||
| 2026-02-17 | 13F | Omega Fund Management, LLC | 1.316.183 | -31,45 | 40.104 | 5,12 | ||||
| 2026-02-13 | 13F | Caitong International Asset Management Co., Ltd | 657 | 288,76 | 20 | 566,67 | ||||
| 2025-11-14 | 13F | Sandia Investment Management LP | 0 | -100,00 | 0 | -100,00 | ||||
| 2026-02-17 | 13F | Balyasny Asset Management Llc | 84.973 | 3.278,65 | 2.589 | 5.183,67 | ||||
| 2026-02-10 | 13F | Td Asset Management Inc | 65.876 | 9,65 | 2.007 | 68,23 | ||||
| 2026-02-13 | 13F | Eventide Asset Management, Llc | 4.994.728 | 0,76 | 152.233 | 54,55 | ||||
| 2026-02-17 | 13F | MIRAE ASSET GLOBAL ETFS HOLDINGS Ltd. | 54.541 | -1,31 | 1.662 | 51,28 | ||||
| 2026-02-12 | 13F | Jane Street Group, Llc | 140.592 | 306,17 | 4.284 | 523,44 | ||||
| 2026-02-13 | 13F | Transamerica Financial Advisors, Inc. | 3 | 0 | ||||||
| 2026-02-05 | 13F | Td Private Client Wealth Llc | 66 | 0,00 | 2 | 100,00 | ||||
| 2025-09-26 | NP | UAPIX - Ultrasmall-cap Profund Investor Class | 145 | 7,41 | 2 | 100,00 | ||||
| 2026-02-17 | 13F | Voloridge Investment Management, Llc | 151.647 | 549,56 | 4.621 | 897,84 | ||||
| 2026-02-10 | 13F | Rothschild Investment Llc | 17 | 240,00 | 1 | |||||
| 2026-02-12 | 13F | Soleus Capital Management, L.P. | 2.534.565 | -34,51 | 77.228 | 0,43 | ||||
| 2026-01-27 | 13F | Hamilton Capital Partners, Llc | 9.860 | 300 | ||||||
| 2026-02-17 | 13F | Schonfeld Strategic Advisors LLC | 0 | -100,00 | 0 | |||||
| 2026-02-13 | 13F | Centiva Capital, LP | 0 | -100,00 | 0 | |||||
| 2026-02-17 | 13F | Bellevue Group AG | 72.285 | 12,45 | 2.203 | 72,44 | ||||
| 2026-02-10 | 13F | Bank of New York Mellon Corp | 99.783 | 10,72 | 3.040 | 69,83 | ||||
| 2026-02-13 | 13F | Sterling Capital Management LLC | 500 | 23,46 | 15 | 87,50 | ||||
| 2026-02-10 | 13F | Bnp Paribas Arbitrage, Sa | 201.892 | 2.483,39 | 6.152 | 3.868,39 | ||||
| 2026-02-11 | 13F | Jpmorgan Chase & Co | 348.671 | 69,29 | 10.624 | 159,63 | ||||
| 2026-02-17 | 13F | Advisory Services Network, LLC | 0 | -100,00 | 0 | |||||
| 2026-02-10 | 13F | Quantbot Technologies LP | 89.405 | 521,13 | 2.724 | 852,45 | ||||
| 2026-02-17 | 13F | D. E. Shaw & Co., Inc. | 13.142 | 400 | ||||||
| 2025-09-24 | NP | BLACKROCK FUNDS - iShares Russell Small/Mid-Cap Index Fund Investor A | 1.792 | 0,00 | 30 | 57,89 | ||||
| 2026-02-13 | 13F | Wells Fargo & Company/mn | 50.312 | 57,45 | 1.533 | 141,80 | ||||
| 2026-01-29 | 13F | Concord Wealth Partners | 11 | 0,00 | 0 | |||||
| 2026-02-17 | 13F | Trexquant Investment LP | 115.761 | 3.527 | ||||||
| 2026-02-17 | 13F | Jump Financial, LLC | 86.504 | 2.636 | ||||||
| 2026-01-16 | 13F | Ronald Blue Trust, Inc. | 47 | 0,00 | 1 | |||||
| 2026-02-12 | 13F | Steward Partners Investment Advisory, Llc | 2.024 | 33,60 | 62 | 103,33 | ||||
| 2026-02-17 | 13F | Gladstone Institutional Advisory LLC | 14.200 | 0,00 | 433 | 53,19 | ||||
| 2026-02-17 | 13F | Aqr Capital Management Llc | 50.405 | -3,09 | 1.536 | 48,60 | ||||
| 2026-01-30 | 13F | Us Bancorp \de\ | 29 | 1 | ||||||
| 2025-11-14 | 13F | First Turn Management, LLC | 0 | -100,00 | 0 | -100,00 | ||||
| 2026-02-13 | 13F | Divisadero Street Capital Management, LP | 39.606 | 1.207 | ||||||
| 2026-02-12 | 13F | Nuveen, LLC | 85.379 | 59,62 | 2.601 | 144,92 | ||||
| 2026-02-13 | 13F | Colony Group, LLC | 10.663 | -9,07 | 325 | 39,66 | ||||
| 2026-02-13 | 13F | Verition Fund Management LLC | 82.862 | 75,19 | 2.525 | 168,80 | ||||
| 2026-02-17 | 13F | Tudor Investment Corp Et Al | 259.632 | 572,74 | 7.911 | 932,64 | ||||
| 2026-02-13 | 13F | Pura Vida Investments, Llc | 281.250 | 0,00 | 8.570 | 53,35 | ||||
| 2026-01-30 | 13F | Torren Management, LLC | 136 | 4 | ||||||
| 2025-10-02 | 13F | Bank of New Hampshire | 680 | 0,00 | 14 | 44,44 | ||||
| 2026-02-17 | 13F | Price T Rowe Associates Inc /md/ | 532.749 | 9,25 | 16 | 77,78 | ||||
| 2026-01-26 | 13F | Cwm, Llc | 3.430 | 0,68 | 0 | |||||
| 2025-10-17 | 13F | Fortitude Family Office, LLC | 0 | -100,00 | 0 | |||||
| 2026-02-17 | 13F | 12 West Capital Management LP | 575.000 | 17.520 | ||||||
| 2025-09-17 | NP | GMRAX - Nationwide Small Cap Index Fund Class A | 1.038 | 0,00 | 17 | 54,55 | ||||
| 2026-02-17 | 13F | Rtw Investments, Lp | 2.500.000 | -24,22 | 76.175 | 16,20 | ||||
| 2026-02-09 | 13F | Geode Capital Management, Llc | 921.464 | 0,43 | 28.084 | 54,01 | ||||
| 2026-02-17 | 13F | Aster Capital Management (DIFC) Ltd | 97 | -77,95 | 3 | -75,00 | ||||
| 2026-02-13 | 13F | Ubs Asset Management Americas Inc | 105 | 3 | ||||||
| 2026-02-06 | 13F | Legato Capital Management LLC | 85.660 | 34,63 | 2.610 | 106,49 | ||||
| 2025-11-14 | 13F | Soros Fund Management Llc | 0 | -100,00 | 0 | |||||
| 2026-01-28 | 13F | WPG Advisers, LLC | 186 | 0,00 | 6 | 66,67 | ||||
| 2026-02-11 | 13F | LPL Financial LLC | 10.698 | -49,13 | 326 | -22,06 | ||||
| 2026-02-13 | 13F | State Street Corp | 863.133 | 4,46 | 26.300 | 60,18 | ||||
| 2026-02-14 | 13F | Rockefeller Capital Management L.P. | 43 | 1 | ||||||
| 2026-01-13 | 13F | CoreCap Advisors, LLC | 381 | -20,79 | 12 | 22,22 | ||||
| 2026-02-17 | 13F | Kotler Kevin | 8.216 | 250 | ||||||
| 2026-02-13 | 13F | Essex Investment Management Co Llc | 217.796 | -2,16 | 6.636 | 50,03 | ||||
| 2026-01-05 | 13F | GAMMA Investing LLC | 779 | 24,84 | 24 | 91,67 | ||||
| 2026-01-29 | 13F | Vanguard Group Inc | 2.218.238 | 0,09 | 67.590 | 53,49 | ||||
| 2026-02-12 | 13F | MetLife Investment Management, LLC | 22.720 | 0,00 | 692 | 53,44 | ||||
| 2026-02-13 | 13F | Sands Capital Ventures, LLC | 3.570.113 | 0,00 | 108.781 | 53,35 | ||||
| 2025-09-23 | NP | LMARX - ClearBridge Small Cap Fund Class R This fund is a listed as child fund of Clearbridge, Llc and if that institution has disclosed ownership in this security, then these positions will not be double counted when calculating total shares and total value | 216.100 | -18,82 | 3.628 | 23,36 | ||||
| 2025-09-24 | NP | SWSSX - Schwab Small-Cap Index Fund This fund is a listed as child fund of Charles Schwab Investment Management Inc and if that institution has disclosed ownership in this security, then these positions will not be double counted when calculating total shares and total value | 32.110 | 1,25 | 539 | 54,00 | ||||
| 2026-02-17 | 13F | Deerfield Management Company, L.p. (series C) | 938.308 | -19,69 | 28.590 | 23,15 | ||||
| 2026-02-12 | 13F | BlackRock, Inc. | 2.913.920 | 4,77 | 88.787 | 60,66 | ||||
| 2026-02-13 | 13F | Barclays Plc | 60.664 | 11,49 | 1.848 | 70,95 | ||||
| 2026-02-17 | 13F | Janus Henderson Group Plc | 0 | -100,00 | 0 | |||||
| 2026-02-17 | 13F | Meridiem Capital Partners LP | 0 | -100,00 | 0 | |||||
| 2026-02-17 | 13F | Wellington Management Group Llp | 0 | -100,00 | 0 | -100,00 | ||||
| 2026-02-17 | 13F | Holocene Advisors, LP | 71.777 | 2.187 | ||||||
| 2026-02-11 | 13F | Clearbridge Investments, LLC | 0 | -100,00 | 0 | |||||
| 2026-02-17 | 13F | Gilder Gagnon Howe & Co Llc | 0 | -100,00 | 0 | |||||
| 2026-01-12 | 13F | Evanson Asset Management, LLC | 31.272 | -7,40 | 953 | 41,88 | ||||
| 2026-02-10 | 13F | Goldman Sachs Group Inc | 405.408 | 1,54 | 12.353 | 55,70 | ||||
| 2025-09-24 | NP | ESCKX - 1290 Essex Small Cap Growth Fund Class R | 38.514 | 647 | ||||||
| 2025-09-26 | NP | FLXSX - Fidelity Flex Small Cap Index Fund This fund is a listed as child fund of Fmr Llc and if that institution has disclosed ownership in this security, then these positions will not be double counted when calculating total shares and total value | 0 | -100,00 | 0 | -100,00 | ||||
| 2026-02-09 | 13F | Jefferies Financial Group Inc. | 51.400 | 1.566 | ||||||
| 2026-02-13 | 13F | Mariner, LLC | 20.671 | -3,35 | 630 | 48,35 | ||||
| 2026-02-06 | 13F | Gsa Capital Partners Llp | 18.744 | 26,17 | 1 | |||||
| 2026-02-06 | 13F | EverSource Wealth Advisors, LLC | 2.503 | 5,30 | 76 | 61,70 | ||||
| 2026-02-13 | 13F | Citigroup Inc | 1.944 | 31,26 | 59 | 103,45 | ||||
| 2025-09-24 | NP | SWTSX - Schwab Total Stock Market Index Fund This fund is a listed as child fund of Charles Schwab Investment Management Inc and if that institution has disclosed ownership in this security, then these positions will not be double counted when calculating total shares and total value | 5.770 | 0,00 | 97 | 52,38 | ||||
| 2026-02-11 | 13F | Deutsche Bank Ag\ | 39.300 | 3,41 | 1.197 | 58,54 | ||||
| 2026-02-23 | 13F | Virtu Financial LLC | 0 | -100,00 | 0 | |||||
| 2026-02-17 | 13F | Jones Financial Companies Lllp | 837 | 21,83 | 26 | 92,31 | ||||
| 2026-02-13 | 13F | Sei Investments Co | 48.074 | 1.465 | ||||||
| 2026-02-13 | 13F | Squarepoint Ops LLC | 83.421 | 2.542 | ||||||
| 2026-02-09 | 13F | Legal & General Group Plc | 6.534 | -1,51 | 199 | 51,91 | ||||
| 2026-02-13 | 13F | Y-Intercept (Hong Kong) Ltd | 11.203 | 341 | ||||||
| 2026-02-17 | 13F | Perceptive Advisors Llc | 602.944 | 116,93 | 18.372 | 232,69 | ||||
| 2026-02-17 | 13F | Millennium Management Llc | 945.461 | 18,63 | 28.808 | 81,93 | ||||
| 2026-01-29 | 13F | UBS Group AG | 251.438 | 96,58 | 7.661 | 201,50 | ||||
| 2026-02-17 | 13F | Two Sigma Advisers, Lp | 137.200 | 354,30 | 4.180 | 596,67 | ||||
| 2026-02-09 | 13F | Lisanti Capital Growth, LLC | 42.985 | 1.310 | ||||||
| 2026-02-11 | 13F | Ameritas Investment Partners, Inc. | 3.202 | 98 | ||||||
| 2026-02-17 | 13F | Point72 Asset Management, L.P. | 987.351 | 30.085 | ||||||
| 2026-01-21 | 13F | Palumbo Wealth Management LLC | 8.729 | 266 | ||||||
| 2026-02-17 | 13F | Creative Planning | 6.698 | 204 | ||||||
| 2026-02-17 | 13F | Royal Bank Of Canada | 8.409 | -88,90 | 256 | -83,00 | ||||
| 2026-02-17 | 13F | Northern Trust Corp | 284.453 | -4,57 | 8.667 | 46,35 | ||||
| 2026-02-13 | 13F | Jacobs Levy Equity Management, Inc | 37.374 | -4,15 | 1.139 | 47,03 | ||||
| 2026-02-13 | 13F | American Century Companies Inc | 12.024 | 366 | ||||||
| 2026-02-06 | 13F | Global Retirement Partners, LLC | 41 | -49,38 | 1 | 0,00 | ||||
| 2026-02-13 | 13F | Healthcare Of Ontario Pension Plan Trust Fund | 1.327.100 | 40.437 | ||||||
| 2026-02-13 | 13F | Charles Schwab Investment Management Inc | 331.623 | 0,28 | 10.105 | 53,79 | ||||
| 2025-09-29 | NP | RSSL - Global X Russell 2000 ETF | 6.968 | -11,12 | 117 | 34,88 | ||||
| 2026-02-17 | 13F | Lighthouse Investment Partners, LLC | 35.000 | 1.066 | ||||||
| 2026-02-10 | 13F | Norges Bank | 339.300 | 10.338 | ||||||
| 2026-01-15 | 13F | Nisa Investment Advisors, Llc | 421 | 378,41 | 13 | 1.100,00 | ||||
| 2026-02-06 | 13F | GPS Wealth Strategies Group, LLC | 0 | -100,00 | 0 | |||||
| 2026-02-13 | 13F | Marshall Wace, Llp | 227.956 | 6.946 | ||||||
| 2026-02-12 | 13F | Bank Of Montreal /can/ | 12.861 | 25,78 | 392 | 92,61 |