Grundlæggende statistik
| Institutionelle ejere | 232 total, 232 long only, 0 short only, 0 long/short - change of 7,37% MRQ |
| Gennemsnitlig porteføljeallokering | 0.0691 % - change of 3,23% MRQ |
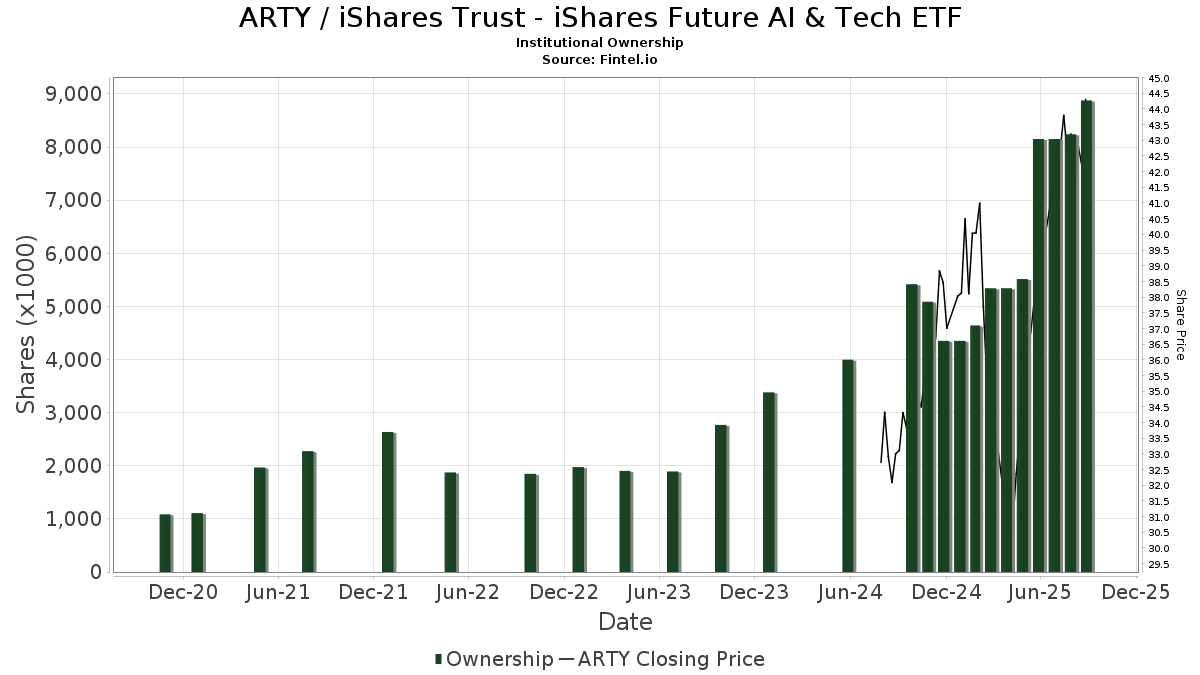
| Institutionelle aktier (lange) | 8.876.306 (ex 13D/G) - change of 0,72MM shares 8,88% MRQ |
| Institutionel værdi (lang) | $ 312.052 USD ($1000) |
Institutionelt ejerskab og aktionærer
iShares Trust - iShares Future AI & Tech ETF (US:ARTY) har 232 institutionelle ejere og aktionærer, der har indsendt 13D/G- eller 13F-formularer til Securities Exchange Commission (SEC). Disse institutioner har i alt 8,876,306 aktier. Største aktionærer omfatter Morgan Stanley, Wharton Business Group, LLC, Bank Of America Corp /de/, Ameriprise Financial Inc, LPL Financial LLC, TD Waterhouse Canada Inc., UBS Group AG, Advisor Group Holdings, Inc., Raymond James Financial Inc, and Jones Financial Companies Lllp .
iShares Trust - iShares Future AI & Tech ETF (ARCA:ARTY) institutionel ejerskabsstruktur viser aktuelle positioner i virksomheden efter institutioner og fonde, samt seneste ændringer i positionsstørrelse. Større aktionærer kan omfatte individuelle investorer, investeringsforeninger, hedgefonde eller institutioner. Skema 13D angiver, at investoren besidder (eller besidder) mere end 5 % af virksomheden og har til hensigt (eller har til hensigt at) aktivt at forfølge en ændring i forretningsstrategi. Skema 13G indikerer en passiv investering på over 5%.
The share price as of September 8, 2025 is 43,06 / share. Previously, on September 9, 2024, the share price was 31,71 / share. This represents an increase of 35,79% over that period.
Fondens stemningsscore
Fund Sentiment Score (fka Ownership Accumulation Score) finder de aktier, der bliver mest købt af fonde. Det er resultatet af en sofistikeret, multi-faktor kvantitativ model, der identificerer virksomheder med de højeste niveauer af institutionel akkumulering. Scoringsmodellen bruger en kombination af den samlede stigning i oplyste ejere, ændringerne i porteføljeallokeringer i disse ejere og andre målinger. Tallet går fra 0 til 100, hvor højere tal indikerer et højere niveau af akkumulering for sine jævnaldrende, og 50 er gennemsnittet.
Opdateringsfrekvens: Dagligt
Se Ownership Explorer, som giver en liste over højest rangerende virksomheder.
Institutionel Put/Call-forhold
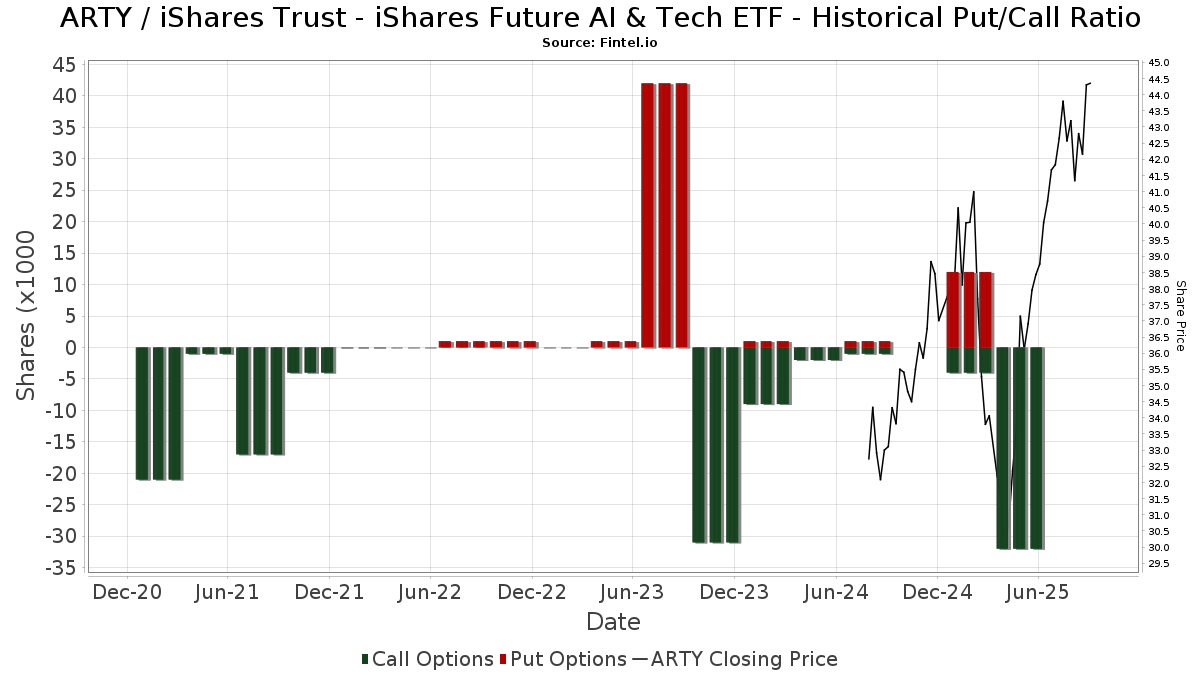
Ud over at indberette standardaktie- og gældsudstedelser skal institutter med mere end 100 mill. aktiver under forvaltning også oplyse deres put- og call-optionsbeholdninger. Da salgsoptioner generelt indikerer negativ stemning, og købsoptioner indikerer positiv stemning, kan vi få en fornemmelse af den overordnede institutionelle stemning ved at plotte forholdet mellem put og kald. Diagrammet til højre viser det historiske put/call-forhold for dette instrument.
Brug af Put/Call Ratio som en indikator for investorernes stemning overvinder en af de vigtigste mangler ved at bruge totalt institutionelt ejerskab, som er, at en betydelig mængde af aktiver under forvaltning investeres passivt for at spore indekser. Passivt forvaltede fonde køber typisk ikke optioner, så indikatoren for put/call-forholdet følger mere nøje følelsen af aktivt forvaltede fonde.
13F og NPORT arkivering
Detaljer om 13F-arkivering er gratis. Detaljer om NP-ansøgninger kræver et premium-medlemskab. Grønne rækker angiver nye positioner. Røde rækker angiver lukkede positioner. Klik på linket ikon for at se den fulde transaktionshistorik.
Opgrader
for at låse premium-data op og eksportere til Excel ![]() .
.
| Fil dato | Kilde | Investor | Type | Gennemsnitlig pris (Øst) |
Aktier | Δ Aktier (%) |
Rapporteret Værdi ($1000) |
Δ Værdi (%) |
Port Alloc (%) |
|
|---|---|---|---|---|---|---|---|---|---|---|
| 2025-08-08 | 13F | Hudock, Inc. | 26.792 | 10,49 | 1.098 | 44,09 | ||||
| 2025-08-13 | 13F | Quadrature Capital Ltd | 8.634 | 354 | ||||||
| 2025-08-04 | 13F | Creative Financial Designs Inc /adv | 1.892 | -9,69 | 78 | 18,46 | ||||
| 2025-08-15 | 13F | Captrust Financial Advisors | 15.973 | 655 | ||||||
| 2025-08-19 | 13F | Advisory Services Network, LLC | 6.277 | -30,29 | 273 | -3,89 | ||||
| 2025-07-16 | 13F | Signaturefd, Llc | 1.125 | 21,62 | 46 | 58,62 | ||||
| 2025-08-14 | 13F | Wells Fargo & Company/mn | 995 | -44,54 | 41 | -28,57 | ||||
| 2025-07-29 | 13F | Stratos Wealth Partners, LTD. | 17.087 | -2,05 | 701 | 27,74 | ||||
| 2025-07-28 | 13F | Private Wealth Asset Management, LLC | 60 | 0,00 | 2 | 100,00 | ||||
| 2025-08-12 | 13F | Coston, McIsaac & Partners | 572 | 4,38 | 0 | |||||
| 2025-08-05 | 13F | GHP Investment Advisors, Inc. | 200 | 8 | ||||||
| 2025-08-14 | 13F | Jane Street Group, Llc | 56.879 | 21,01 | 2.332 | 57,78 | ||||
| 2025-07-25 | 13F | Community Bank, N.A. | 13.000 | 0,00 | 533 | 30,64 | ||||
| 2025-08-08 | 13F | Glassman Wealth Services | 2.224 | 0,00 | 91 | 31,88 | ||||
| 2025-08-05 | 13F | Key FInancial Inc | 126 | 0,00 | 5 | 66,67 | ||||
| 2025-08-12 | 13F | BlackRock, Inc. | 429 | -49,94 | 18 | -34,62 | ||||
| 2025-04-24 | 13F | Wingate Wealth Advisors, Inc. | 0 | -100,00 | 0 | |||||
| 2025-08-08 | 13F | Larson Financial Group LLC | 47 | 0,00 | 2 | 0,00 | ||||
| 2025-07-16 | 13F | Crowley Wealth Management, Inc. | 4.380 | 71,76 | 185 | 130,00 | ||||
| 2025-07-30 | 13F | IMG Wealth Management, Inc. | 179 | 0,00 | 7 | 40,00 | ||||
| 2025-08-07 | 13F | Allworth Financial LP | 2.287 | 19,24 | 94 | 52,46 | ||||
| 2025-07-14 | 13F | UMA Financial Services, Inc. | 3.599 | 0,00 | 148 | 30,09 | ||||
| 2025-08-11 | 13F | Copperleaf Capital, LLC | 23.350 | -0,76 | 957 | 29,32 | ||||
| 2025-08-13 | 13F | Continuum Advisory, LLC | 0 | -100,00 | 0 | -100,00 | ||||
| 2025-07-15 | 13F | Cora Capital Advisors Llc | 53.558 | -5,64 | 2.196 | 22,97 | ||||
| 2025-07-18 | 13F | Union Bancaire Privee, UBP SA | 1.243 | 0,00 | 43 | 19,44 | ||||
| 2025-08-06 | 13F | Commonwealth Equity Services, Llc | 95.032 | -16,11 | 4 | 0,00 | ||||
| 2025-08-14 | 13F | Mml Investors Services, Llc | 48.347 | -7,11 | 2 | 0,00 | ||||
| 2025-07-24 | 13F | Ronald Blue Trust, Inc. | 506 | 0,00 | 21 | 33,33 | ||||
| 2025-08-15 | 13F | WFA of San Diego, LLC | 300 | -25,93 | 12 | -7,69 | ||||
| 2025-07-15 | 13F | Fifth Third Bancorp | 31 | 1 | ||||||
| 2025-08-14 | 13F | Mercer Global Advisors Inc /adv | 33.265 | -15,58 | 1.364 | 10,01 | ||||
| 2025-07-29 | 13F | Chicago Partners Investment Group LLC | 5.735 | 245 | ||||||
| 2025-08-12 | 13F | AlphaCore Capital LLC | 2.162 | 0,00 | 89 | 31,34 | ||||
| 2025-08-14 | 13F | Mariner, LLC | 28.394 | 12,03 | 1.164 | 46,05 | ||||
| 2025-08-05 | 13F | GPS Wealth Strategies Group, LLC | 2.110 | -6,72 | 87 | 21,13 | ||||
| 2025-07-22 | 13F | Partners Wealth Management, Llc | 6.530 | 0,00 | 208 | 0,98 | ||||
| 2025-07-30 | 13F | Crewe Advisors LLC | 3.093 | 0,00 | 127 | 29,90 | ||||
| 2025-08-05 | 13F | Atlas Private Wealth Advisors | 19.940 | 0,00 | 818 | 30,30 | ||||
| 2025-08-08 | 13F | Kingsview Wealth Management, LLC | 5.294 | 217 | ||||||
| 2025-08-14 | 13F | D. E. Shaw & Co., Inc. | 7.428 | 0,00 | 305 | 30,47 | ||||
| 2025-08-01 | 13F | Gwn Securities Inc. | 26.808 | 10,21 | 1.099 | 43,66 | ||||
| 2025-07-24 | 13F | Leo Wealth, LLC | 5.075 | 208 | ||||||
| 2025-08-04 | 13F | JDM Financial Group LLC | 163 | 0,00 | 7 | 20,00 | ||||
| 2025-08-12 | 13F | Steward Partners Investment Advisory, Llc | 14.441 | 64,66 | 592 | 115,27 | ||||
| 2025-07-31 | 13F | Waldron Private Wealth LLC | 6.670 | 273 | ||||||
| 2025-08-01 | 13F | First Command Advisory Services, Inc. | 522 | 0,00 | 21 | 31,25 | ||||
| 2025-07-23 | 13F | Valmark Advisers, Inc. | 5.824 | 239 | ||||||
| 2025-08-13 | 13F | Russell Investments Group, Ltd. | 2.256 | 92 | ||||||
| 2025-08-08 | 13F | Creative Planning | 67.888 | 0,31 | 2.783 | 30,78 | ||||
| 2025-07-14 | 13F | Abound Wealth Management | 0 | -100,00 | 0 | |||||
| 2025-08-14 | 13F | Strategic Wealth Designers | 4.053 | -93,33 | 166 | -92,63 | ||||
| 2025-05-15 | 13F | Vermillion & White Wealth Management Group, LLC | 0 | -100,00 | 0 | |||||
| 2025-07-31 | 13F | Glass Jacobson Investment Advisors llc | 14.367 | 13,47 | 589 | 25,59 | ||||
| 2025-08-05 | 13F | Simplex Trading, Llc | 0 | -100,00 | 0 | |||||
| 2025-04-17 | 13F | Dynamic Advisor Solutions LLC | 0 | -100,00 | 0 | |||||
| 2025-08-14 | 13F | CIBC World Markets Inc. | 15.740 | 4,93 | 645 | 36,94 | ||||
| 2025-07-14 | 13F | Proathlete Wealth Management Llc | 13 | 116,67 | 1 | |||||
| 2025-08-14 | 13F | Wharton Business Group, LLC | 966.302 | 13,37 | 40 | 50,00 | ||||
| 2025-08-12 | 13F | J.w. Cole Advisors, Inc. | 7.718 | 316 | ||||||
| 2025-08-14 | 13F | Stifel Financial Corp | 30.221 | -42,32 | 1.239 | -24,82 | ||||
| 2025-07-25 | 13F | Cwm, Llc | 32.979 | 3,86 | 1 | |||||
| 2025-08-14 | 13F | Old Mission Capital Llc | 6.154 | -58,48 | 252 | -45,92 | ||||
| 2025-04-28 | 13F | Strategic Financial Concepts, LLC | 0 | -100,00 | 0 | -100,00 | ||||
| 2025-08-07 | 13F | PFG Advisors | 12.849 | -15,23 | 527 | 10,50 | ||||
| 2025-08-12 | 13F | Minot DeBlois Advisors LLC | 165 | 0,00 | 7 | 20,00 | ||||
| 2025-07-31 | 13F | Cambridge Investment Research Advisors, Inc. | 25.926 | 9,80 | 1 | |||||
| 2025-08-12 | 13F | Pathstone Holdings, LLC | 0 | -100,00 | 0 | |||||
| 2025-08-08 | 13F | Hartland & Co., LLC | 12 | 0,00 | 0 | |||||
| 2025-08-15 | 13F | Provenance Wealth Advisors, LLC | 441 | 0,00 | 18 | 38,46 | ||||
| 2025-07-17 | 13F | HB Wealth Management, LLC | 7.920 | -16,67 | 325 | 8,72 | ||||
| 2025-07-25 | 13F | NorthRock Partners, LLC | 233 | 10 | ||||||
| 2025-04-23 | 13F | Gimbal Financial | 0 | -100,00 | 0 | -100,00 | ||||
| 2025-08-05 | 13F | Dunhill Financial, LLC | 126 | -0,79 | 5 | 66,67 | ||||
| 2025-08-13 | 13F | Kilter Group LLC | 852 | 35 | ||||||
| 2025-08-12 | 13F | Richard W. Paul & Associates, LLC | 336 | 14 | ||||||
| 2025-07-14 | 13F | Toth Financial Advisory Corp | 210 | 0,00 | 9 | 33,33 | ||||
| 2025-08-14 | 13F | Comerica Bank | 3.683 | -7,30 | 151 | 21,77 | ||||
| 2025-07-03 | 13F | Garde Capital, Inc. | 460 | 0,00 | 19 | 28,57 | ||||
| 2025-07-07 | 13F | Versant Capital Management, Inc | 143 | 0,00 | 6 | 25,00 | ||||
| 2025-07-21 | 13F | Ameriflex Group, Inc. | 23 | 0,00 | 1 | |||||
| 2025-07-22 | 13F | Gemmer Asset Management LLC | 16.014 | 148,28 | 657 | 224,75 | ||||
| 2025-08-08 | 13F | Phoenix Wealth Advisors | 23.398 | -1,26 | 959 | 28,72 | ||||
| 2025-08-12 | 13F | MAI Capital Management | 197 | 12,57 | 8 | 60,00 | ||||
| 2025-08-13 | 13F | Baird Financial Group, Inc. | 6.669 | -5,55 | 273 | 22,97 | ||||
| 2025-09-04 | 13F/A | Advisor Group Holdings, Inc. | 230.740 | 111,31 | 9.321 | 171,40 | ||||
| 2025-08-19 | 13F | Asset Dedication, LLC | 100 | 0,00 | 4 | 33,33 | ||||
| 2025-07-23 | 13F | Stephen J. Garry & Associates, Llc | 18.415 | 755 | ||||||
| 2025-08-01 | 13F | Envestnet Asset Management Inc | 40.059 | -66,22 | 1.642 | -55,97 | ||||
| 2025-07-25 | 13F | Stonehage Fleming Financial Services Holdings Ltd | 10.000 | 0,00 | 410 | 30,57 | ||||
| 2025-08-05 | 13F | Lord & Richards Wealth Management, LLC | 0 | -100,00 | 0 | |||||
| 2025-08-13 | 13F | WCG Wealth Advisors LLC | 11.908 | -0,23 | 488 | 30,13 | ||||
| 2025-05-12 | 13F | C2P Capital Advisory Group, LLC d.b.a. Prosperity Capital Advisors | 0 | -100,00 | 0 | -100,00 | ||||
| 2025-07-23 | 13F | Matisse Capital | 12.961 | -2,48 | 531 | 27,03 | ||||
| 2025-07-17 | 13F | Halbert Hargrove Global Advisors, Llc | 2.040 | 84 | ||||||
| 2025-07-17 | 13F | Beacon Capital Management, LLC | 40 | 0,00 | 2 | 0,00 | ||||
| 2025-08-13 | 13F | Cerity Partners LLC | 22.418 | 2,28 | 919 | 33,38 | ||||
| 2025-07-22 | 13F | Team Financial Group, LLC | 1.818 | 75 | ||||||
| 2025-07-28 | 13F | Mowery & Schoenfeld Wealth Management, LLC | 0 | -100,00 | 0 | |||||
| 2025-07-30 | 13F | Ardent Capital Management, Inc. | 38.329 | -1,11 | 1.571 | 28,88 | ||||
| 2025-05-09 | 13F | Advyzon Investment Management, LLC | 0 | -100,00 | 0 | |||||
| 2025-08-13 | 13F | Congress Wealth Management LLC / DE / | 16.532 | 678 | ||||||
| 2025-08-14 | 13F | Bnp Paribas Arbitrage, Sa | 6.023 | 47,84 | 247 | 92,19 | ||||
| 2025-08-12 | 13F | O'shaughnessy Asset Management, Llc | 1.909 | 0,00 | 78 | 30,00 | ||||
| 2025-08-08 | 13F | Cetera Investment Advisers | 88.977 | -0,39 | 3.648 | 29,87 | ||||
| 2025-07-11 | 13F | Farther Finance Advisors, LLC | 7.658 | 1,62 | 314 | 30,96 | ||||
| 2025-08-14 | 13F | Colony Group, LLC | 6.281 | 258 | ||||||
| 2025-08-12 | 13F | Insigneo Advisory Services, Llc | 12.107 | -56,16 | 496 | -42,86 | ||||
| 2025-08-18 | 13F | Geneos Wealth Management Inc. | 3.928 | 36,20 | 161 | 78,89 | ||||
| 2025-08-12 | 13F | LPL Financial LLC | 543.679 | -15,52 | 22.291 | 10,13 | ||||
| 2025-07-07 | 13F | Global Wealth Strategies & Associates | 156 | 0,00 | 6 | 50,00 | ||||
| 2025-07-07 | 13F | Roxbury Financial LLC | 7 | 0,00 | 0 | |||||
| 2025-07-18 | 13F | Trust Co Of Vermont | 160 | 0,00 | 7 | 20,00 | ||||
| 2025-08-14 | 13F | Raymond James Financial Inc | 215.591 | 71,74 | 8.839 | 123,89 | ||||
| 2025-08-13 | 13F | Northwestern Mutual Wealth Management Co | 142.775 | 566,43 | 5.854 | 769,69 | ||||
| 2025-08-18 | 13F/A | National Bank Of Canada /fi/ | 244 | -33,88 | 10 | -9,09 | ||||
| 2025-08-13 | 13F | Natixis | 4.172 | 172 | ||||||
| 2025-08-05 | 13F | Bank Of Montreal /can/ | 2.224 | 4,71 | 91 | 37,88 | ||||
| 2025-07-17 | 13F | Janney Montgomery Scott LLC | 37.245 | -4,10 | 2 | 0,00 | ||||
| 2025-07-21 | 13F | Quent Capital, LLC | 0 | -100,00 | 0 | |||||
| 2025-07-28 | 13F | Mitchell Mcleod Pugh & Williams Inc | 7.294 | 0,00 | 299 | 30,57 | ||||
| 2025-08-04 | 13F | Arkadios Wealth Advisors | 44.860 | -81,61 | 1.839 | -76,02 | ||||
| 2025-08-05 | 13F | Huntington National Bank | 67 | 272,22 | ||||||
| 2025-08-05 | 13F | Tsfg, Llc | 4.998 | -83,28 | 0 | |||||
| 2025-07-24 | 13F | Us Bancorp \de\ | 2.024 | -26,08 | 83 | -4,65 | ||||
| 2025-08-29 | 13F | Total Investment Management Inc | 639 | 26 | ||||||
| 2025-08-12 | 13F | Park Square Financial Group, LLC | 228 | 5,56 | 9 | 50,00 | ||||
| 2025-08-13 | 13F | BCJ Capital Management, LLC | 124.878 | 21,89 | 5.120 | 58,88 | ||||
| 2025-07-24 | 13F | Eastern Bank | 30 | 1 | ||||||
| 2025-08-11 | 13F | HighTower Advisors, LLC | 13.931 | -2,23 | 571 | 27,46 | ||||
| 2025-08-12 | 13F | Franklin Resources Inc | 1.300 | 53 | ||||||
| 2025-08-12 | 13F | Coldstream Capital Management Inc | 0 | -100,00 | 0 | |||||
| 2025-07-21 | 13F | Ameritas Advisory Services, LLC | 1.234 | 51 | ||||||
| 2025-07-25 | 13F | Concurrent Investment Advisors, LLC | 8.812 | -1,32 | 361 | 28,93 | ||||
| 2025-07-28 | 13F | Harbour Investments, Inc. | 5.544 | -1,86 | 227 | 28,25 | ||||
| 2025-08-12 | 13F | Jefferies Financial Group Inc. | 8.249 | 24,42 | 338 | 62,50 | ||||
| 2025-08-04 | 13F | Spire Wealth Management | 150 | 50,00 | 6 | 100,00 | ||||
| 2025-08-11 | 13F | Banque Cantonale Vaudoise | 1.100 | 0,00 | 0 | |||||
| 2025-08-12 | 13F | Clearwater Capital Advisors, LLC | 6.009 | -7,95 | 246 | 20,00 | ||||
| 2025-07-25 | 13F | LRI Investments, LLC | 97.797 | 3,91 | 4.010 | 35,48 | ||||
| 2025-08-06 | 13F | AE Wealth Management LLC | 32.819 | 4,08 | 1.346 | 35,72 | ||||
| 2025-08-14 | 13F | Peapack Gladstone Financial Corp | 17.000 | 0,00 | 1 | |||||
| 2025-08-11 | 13F | Aptus Capital Advisors, LLC | 448 | 4,92 | 18 | 38,46 | ||||
| 2025-08-07 | 13F | Prudent Man Investment Management, Inc. | 333 | 0,00 | 12 | 0,00 | ||||
| 2025-08-19 | 13F | Anchor Investment Management, LLC | 75 | 3 | ||||||
| 2025-07-21 | 13F | Patriot Financial Group Insurance Agency, LLC | 18.636 | 1,23 | 764 | 31,95 | ||||
| 2025-07-22 | 13F | Mascoma Wealth Management LLC | 162 | 0,00 | 7 | 20,00 | ||||
| 2025-08-14 | 13F | Great Valley Advisor Group, Inc. | 8.591 | 352 | ||||||
| 2025-07-16 | 13F | PFS Partners, LLC | 698 | -22,53 | 29 | 0,00 | ||||
| 2025-07-08 | 13F | Lowe Wealth Advisors, LLC | 11 | 0,00 | 0 | |||||
| 2025-08-15 | 13F | Kestra Advisory Services, LLC | 63.336 | 73,48 | 2.597 | 126,13 | ||||
| 2025-07-16 | 13F/A | CX Institutional | 16.925 | 58,55 | 1 | |||||
| 2025-08-08 | 13F | Intrua Financial, LLC | 41.685 | 2,57 | 1.709 | 33,72 | ||||
| 2025-08-14 | 13F | Sunbelt Securities, Inc. | 2.042 | -10,99 | 76 | 4,17 | ||||
| 2025-07-31 | 13F | Brighton Jones Llc | 9.731 | 399 | ||||||
| 2025-08-06 | 13F | First Horizon Advisors, Inc. | 8.655 | 0,00 | 355 | 30,15 | ||||
| 2025-08-12 | 13F | Waddell & Associates, Llc | 30.735 | 0,00 | 1.260 | 30,43 | ||||
| 2025-08-14 | 13F | Federation des caisses Desjardins du Quebec | 4.558 | 4,59 | 187 | 35,77 | ||||
| 2025-08-14 | 13F | Ameriprise Financial Inc | 715.518 | 109,49 | 29.318 | 172,82 | ||||
| 2025-07-28 | 13F | Moran Wealth Management, LLC | 15.507 | 90,55 | 636 | 149,02 | ||||
| 2025-07-08 | 13F | Goldstone Financial Group, LLC | 20.158 | 17,98 | 833 | 54,93 | ||||
| 2025-07-14 | 13F | Painted Porch Advisors LLC | 0 | -100,00 | 0 | -100,00 | ||||
| 2025-07-15 | 13F | Cranbrook Wealth Management, LLC | 457 | 0,00 | 19 | 28,57 | ||||
| 2025-07-23 | 13F | Nbt Bank N A /ny | 387 | 0,00 | 16 | 25,00 | ||||
| 2025-08-14 | 13F | Fmr Llc | 2.261 | 104,06 | 93 | 170,59 | ||||
| 2025-08-13 | 13F | Berbice Capital Management LLC | 9.354 | 384 | ||||||
| 2025-07-29 | 13F | Private Trust Co Na | 0 | -100,00 | 0 | |||||
| 2025-07-08 | 13F | Nbc Securities, Inc. | 140 | -33,33 | 0 | |||||
| 2025-08-08 | 13F | New England Capital Financial Advisors LLC | 297 | 0,00 | 12 | 33,33 | ||||
| 2025-07-18 | 13F | Bartlett & Co. Wealth Management Llc | 1.200 | 0,00 | 49 | 32,43 | ||||
| 2025-07-28 | 13F | Eq Wealth Advisors, Llc | 0 | -100,00 | 0 | |||||
| 2025-07-30 | 13F | Princeton Global Asset Management LLC | 55 | 0,00 | 2 | 100,00 | ||||
| 2025-07-24 | 13F | IFP Advisors, Inc | 20.178 | 1.179,52 | 827 | 1.587,76 | ||||
| 2025-08-15 | 13F | Morgan Stanley | 1.280.336 | 28,63 | 52.494 | 67,68 | ||||
| 2025-07-18 | 13F | SOA Wealth Advisors, LLC. | 147 | 0,00 | 6 | 50,00 | ||||
| 2025-08-12 | 13F | Jpmorgan Chase & Co | 0 | -100,00 | 0 | |||||
| 2025-08-11 | 13F | TD Waterhouse Canada Inc. | 314.996 | 0,83 | 12.720 | 28,29 | ||||
| 2025-08-04 | 13F | Pensionmark Financial Group, Llc | 9.752 | -3,67 | 400 | 25,47 | ||||
| 2025-08-04 | 13F | Amplius Wealth Advisors, LLC | 31.126 | 41,74 | 1.276 | 84,93 | ||||
| 2025-08-08 | 13F | Avantax Advisory Services, Inc. | 8.380 | -10,18 | 344 | 17,06 | ||||
| 2025-08-13 | 13F | IAG Wealth Partners, LLC | 4.479 | 4.821,98 | 184 | 9.050,00 | ||||
| 2025-08-14 | 13F | Murphy & Mullick Capital Management Corp | 400 | 0,00 | 16 | 33,33 | ||||
| 2025-08-14 | 13F | Citadel Advisors Llc | Call | 32.800 | 662,79 | 1.345 | 895,56 | |||
| 2025-08-14 | 13F | Royal Bank Of Canada | 143.082 | 9,67 | 5.867 | 42,96 | ||||
| 2025-08-14 | 13F | Citadel Advisors Llc | 84.858 | 189,25 | 3.479 | 277,33 | ||||
| 2025-08-14 | 13F | Gen-Wealth Partners Inc | 514 | -61,56 | 21 | -50,00 | ||||
| 2025-08-12 | 13F | SRS Capital Advisors, Inc. | 547 | 0,00 | 22 | 29,41 | ||||
| 2025-08-14 | 13F/A | Rockefeller Capital Management L.P. | 107.227 | 1,65 | 4.396 | 32,53 | ||||
| 2025-05-19 | 13F | Heck Capital Advisors, LLC | 0 | -100,00 | 0 | -100,00 | ||||
| 2025-08-13 | 13F | Hsbc Holdings Plc | 15.500 | 636 | 150,00 | |||||
| 2025-05-06 | 13F | Advisors Preferred, LLC | 0 | -100,00 | 0 | |||||
| 2025-08-12 | 13F | Proequities, Inc. | 0 | 0 | ||||||
| 2025-05-14 | 13F | Van Hulzen Asset Management, LLC | 0 | -100,00 | 0 | |||||
| 2025-08-12 | 13F | Howe & Rusling Inc | 100 | 0,00 | 4 | 33,33 | ||||
| 2025-08-15 | 13F | CI Private Wealth, LLC | 18.646 | 3,10 | 765 | 34,51 | ||||
| 2025-08-04 | 13F | Center for Financial Planning, Inc. | 3.222 | 205,69 | 132 | 300,00 | ||||
| 2025-07-14 | 13F | Park Avenue Securities Llc | 0 | -100,00 | 0 | |||||
| 2025-07-25 | 13F | Concord Wealth Partners | 2.419 | 0,00 | 99 | 30,26 | ||||
| 2025-07-30 | 13F | Phillips Financial Management, Llc | 10 | 0,00 | 0 | |||||
| 2025-07-16 | 13F | St Germain D J Co Inc | 290 | 0,00 | 12 | 22,22 | ||||
| 2025-08-08 | 13F | Gts Securities Llc | 11.168 | -59,21 | 458 | -46,92 | ||||
| 2025-07-24 | 13F | Cascade Investment Group, Inc. | 28.902 | 0,87 | 1.185 | 31,41 | ||||
| 2025-08-13 | 13F | Jones Financial Companies Lllp | 149.818 | 35,84 | 6.089 | 73,94 | ||||
| 2025-08-14 | 13F | Bank Of America Corp /de/ | 850.544 | 26,06 | 34.872 | 64,34 | ||||
| 2025-08-11 | 13F | United Capital Financial Advisers, Llc | 0 | -100,00 | 0 | |||||
| 2025-07-15 | 13F | Herbst Group, Llc | 5.000 | 205 | ||||||
| 2025-07-17 | 13F | Virginia Wealth Management Group, Inc. | 5.000 | 205 | ||||||
| 2025-07-28 | 13F | 5th Street Advisors, LLC | 75.132 | -2,38 | 3.080 | 27,27 | ||||
| 2025-04-18 | 13F | Wolf Group Capital Advisors | 8.923 | -31,71 | 281 | -35,03 | ||||
| 2025-05-12 | 13F | Independent Advisor Alliance | 0 | -100,00 | 0 | |||||
| 2025-07-30 | 13F | Sonata Capital Group Inc | 5.525 | 0 | ||||||
| 2025-08-04 | 13F | Assetmark, Inc | 44.747 | 73,35 | 1.835 | 126,14 | ||||
| 2025-08-11 | 13F | Cladis Investment Advisory, LLC | 20.255 | 23,85 | 830 | 61,48 | ||||
| 2025-08-13 | 13F | Flow Traders U.s. Llc | 0 | -100,00 | 0 | |||||
| 2025-08-14 | 13F | Susquehanna International Group, Llp | 0 | -100,00 | 0 | |||||
| 2025-07-08 | 13F | Ehrlich Financial Group | 6.496 | 266 | ||||||
| 2025-08-06 | 13F | True Wealth Design, LLC | 368 | 0,00 | 15 | 36,36 | ||||
| 2025-07-21 | 13F | Barrett & Company, Inc. | 150 | 0,00 | 6 | 50,00 | ||||
| 2025-08-14 | 13F | Citadel Advisors Llc | Put | 0 | -100,00 | 0 | ||||
| 2025-08-14 | 13F | Integrated Wealth Concepts LLC | 5.131 | 210 | ||||||
| 2025-05-05 | 13F | CBIZ Investment Advisory Services, LLC | 0 | -100,00 | 0 | |||||
| 2025-07-03 | 13F | Fiduciary Financial Group, Llc | 12.335 | 21,73 | 499 | 64,36 | ||||
| 2025-08-14 | 13F | CoreCap Advisors, LLC | 353 | -27,66 | 14 | -6,67 | ||||
| 2025-08-11 | 13F | Citigroup Inc | 56.042 | 5,36 | 2.298 | 37,38 | ||||
| 2025-08-08 | 13F | Pnc Financial Services Group, Inc. | 3.068 | 0,00 | 126 | 30,21 | ||||
| 2025-08-07 | 13F | Parkside Financial Bank & Trust | 1.462 | 0,00 | 60 | 31,11 | ||||
| 2025-07-31 | 13F | Opus Capital Group, LLC | 0 | -100,00 | 0 | |||||
| 2025-08-11 | 13F | Private Advisor Group, LLC | 90.407 | 3.707 | ||||||
| 2025-08-11 | 13F | Rockbridge Investment Management, LCC | 6.972 | 0,00 | 286 | 30,14 | ||||
| 2025-08-14 | 13F | UBS Group AG | 293.087 | -19,99 | 12.017 | 4,31 | ||||
| 2025-08-12 | 13F | Global Retirement Partners, LLC | 6.142 | 129,09 | 252 | 153,54 | ||||
| 2025-07-10 | 13F | Wealth Enhancement Advisory Services, Llc | 88.504 | 86,12 | 3.655 | 144,48 | ||||
| 2025-08-12 | 13F | CIBC Private Wealth Group, LLC | 2.718 | -1,09 | 111 | 46,05 | ||||
| 2025-04-21 | 13F | ORG Partners LLC | 0 | -100,00 | 0 | |||||
| 2025-06-27 | 13F | Copley Financial Group, Inc. | 63 | 0,00 | 2 | 0,00 | ||||
| 2025-07-25 | 13F | Stephens Consulting, LLC | 17 | -5,56 | 1 | |||||
| 2025-08-04 | 13F | Quaker Wealth Management, LLC | Put | 0 | -100,00 | 0 | ||||
| 2025-07-18 | 13F | TruNorth Capital Management, LLC | 1.055 | 0,00 | 43 | 30,30 | ||||
| 2025-07-30 | 13F | Brookstone Capital Management | 39.246 | 17,84 | 1.609 | 53,68 | ||||
| 2025-07-09 | 13F | Breakwater Investment Management | 1.591 | -11,71 | 65 | 16,07 | ||||
| 2025-07-18 | 13F | Consolidated Portfolio Review Corp | 14.561 | 2,23 | 597 | 33,56 | ||||
| 2025-07-17 | 13F | Vermillion Wealth Management, Inc. | 60 | -96,70 | 2 | -96,49 | ||||
| 2025-08-18 | 13F | Pacific Center for Financial Services | 260 | 0,00 | 11 | 25,00 | ||||
| 2025-07-14 | 13F | Farmers & Merchants Investments Inc | 1.637 | 0,00 | 67 | 31,37 | ||||
| 2025-08-11 | 13F | Principal Securities, Inc. | 4.042 | -9,11 | 166 | 0,61 | ||||
| 2025-08-14 | 13F | Clark Capital Management Group, Inc. | 0 | -100,00 | 0 | |||||
| 2025-08-14 | 13F | Fort Point Capital Partners LLC | 5.518 | 226 | ||||||
| 2025-07-08 | 13F | Strategic Advocates LLC | 39.031 | 5,62 | 1.600 | 37,69 | ||||
| 2025-07-14 | 13F | AdvisorNet Financial, Inc | 696 | 0,00 | 29 | 33,33 | ||||
| 2025-07-15 | 13F | BostonPremier Wealth LLC | 90.563 | 3.713 | ||||||
| 2025-07-22 | 13F | Wealthcare Advisory Partners LLC | 108.011 | 12,60 | 4.428 | 46,82 | ||||
| 2025-08-05 | 13F | Scarborough Advisors, LLC | 322 | 13 | ||||||
| 2025-05-09 | 13F | Atria Wealth Solutions, Inc. | 0 | -100,00 | 0 | |||||
| 2025-07-29 | 13F | Salomon & Ludwin, LLC | 458 | 0,00 | 19 | 28,57 | ||||
| 2025-08-11 | 13F | Rothschild Investment Llc | 7.771 | 0,00 | 319 | 30,33 | ||||
| 2025-08-14 | 13F | Legacy Advisory Services, LLC | 0 | -100,00 | 0 | |||||
| 2025-08-08 | 13F | Capital Investment Advisory Services, LLC | 817 | 0,00 | 33 | 32,00 | ||||
| 2025-07-18 | 13F | Truist Financial Corp | 6.262 | 257 | ||||||
| 2025-08-12 | 13F | Wood Tarver Financial Group, LLC | 322 | 0,00 | 0 | -100,00 | ||||
| 2025-08-06 | 13F | Aspect Partners, LLC | 95 | -17,39 | 4 | 0,00 | ||||
| 2025-08-08 | 13F | Emerald Investment Partners, Llc | 0 | -100,00 | 0 | |||||
| 2025-07-30 | 13F | Bogart Wealth, LLC | 0 | -100,00 | 0 | |||||
| 2025-08-13 | 13F | Cresset Asset Management, LLC | 9.274 | 12,53 | 380 | 46,72 | ||||
| 2025-07-23 | 13F | H&H Retirement Design & Management INC | 28.568 | 6,66 | 1.208 | 55,74 | ||||
| 2025-07-31 | 13F | Curio Wealth, Llc | 10 | 900,00 | 0 | |||||
| 2025-08-14 | 13F | Family Office Research LLC | 10.356 | 0,00 | 425 | 30,46 | ||||
| 2025-08-14 | 13F | Financial Engines Advisors L.L.C. | 12.092 | 0,40 | 496 | 30,87 | ||||
| 2025-07-15 | 13F | Compagnie Lombard Odier SCmA | 2.700 | 0,00 | 111 | 30,95 | ||||
| 2025-07-30 | 13F | Evermay Wealth Management Llc | 200 | 0,00 | 8 | 33,33 | ||||
| 2025-08-07 | 13F | Resources Investment Advisors, LLC. | 26.929 | -6,60 | 1.104 | 21,85 | ||||
| 2025-08-14 | 13F | GWM Advisors LLC | 1.429 | -13,71 | 59 | 11,54 | ||||
| 2025-07-08 | 13F | Parallel Advisors, LLC | 2.619 | -1,43 | 107 | 28,92 |