Grundlæggende statistik
| Institutionelle aktier (lange) | 55.056.899 - 42,32% (ex 13D/G) - change of 8,00MM shares 17,00% MRQ |
| Institutionel værdi (lang) | $ 197.177 USD ($1000) |
Institutionelt ejerskab og aktionærer
Altimmune, Inc. (US:ALT) har 190 institutionelle ejere og aktionærer, der har indsendt 13D/G- eller 13F-formularer til Securities Exchange Commission (SEC). Disse institutioner har i alt 55,056,899 aktier. Største aktionærer omfatter BlackRock, Inc., Vanguard Group Inc, State Street Corp, Geode Capital Management, Llc, Tang Capital Management Llc, Jane Street Group, Llc, Susquehanna International Group, Llp, Susquehanna International Group, Llp, Morgan Stanley, and Goldman Sachs Group Inc .
Altimmune, Inc. (NasdaqGM:ALT) institutionel ejerskabsstruktur viser aktuelle positioner i virksomheden efter institutioner og fonde, samt seneste ændringer i positionsstørrelse. Større aktionærer kan omfatte individuelle investorer, investeringsforeninger, hedgefonde eller institutioner. Skema 13D angiver, at investoren besidder (eller besidder) mere end 5 % af virksomheden og har til hensigt (eller har til hensigt at) aktivt at forfølge en ændring i forretningsstrategi. Skema 13G indikerer en passiv investering på over 5%.
The share price as of April 22, 2026 is 3,47 / share. Previously, on April 23, 2025, the share price was 4,97 / share. This represents a decline of 30,18% over that period.

Fondens stemningsscore
Fund Sentiment Score (fka Ownership Accumulation Score) finder de aktier, der bliver mest købt af fonde. Det er resultatet af en sofistikeret, multi-faktor kvantitativ model, der identificerer virksomheder med de højeste niveauer af institutionel akkumulering. Scoringsmodellen bruger en kombination af den samlede stigning i oplyste ejere, ændringerne i porteføljeallokeringer i disse ejere og andre målinger. Tallet går fra 0 til 100, hvor højere tal indikerer et højere niveau af akkumulering for sine jævnaldrende, og 50 er gennemsnittet.
Opdateringsfrekvens: Dagligt
Se Ownership Explorer, som giver en liste over højest rangerende virksomheder.
AI+ Ask Fintel’s AI assistant about Altimmune, Inc..
Select a question to share a public post with an AI-crafted answer.
Thinking of good questions…
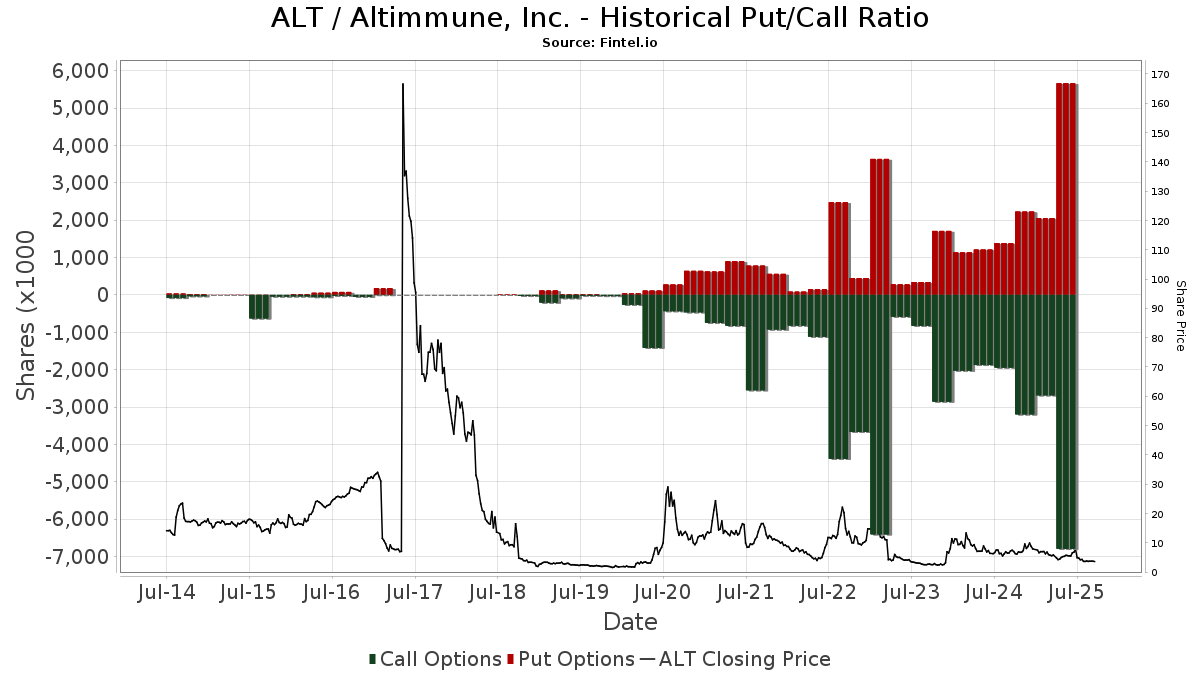
Institutionel Put/Call-forhold
Ud over at indberette standardaktie- og gældsudstedelser skal institutter med mere end 100 mill. aktiver under forvaltning også oplyse deres put- og call-optionsbeholdninger. Da salgsoptioner generelt indikerer negativ stemning, og købsoptioner indikerer positiv stemning, kan vi få en fornemmelse af den overordnede institutionelle stemning ved at plotte forholdet mellem put og kald. Diagrammet til højre viser det historiske put/call-forhold for dette instrument.
Brug af Put/Call Ratio som en indikator for investorernes stemning overvinder en af de vigtigste mangler ved at bruge totalt institutionelt ejerskab, som er, at en betydelig mængde af aktiver under forvaltning investeres passivt for at spore indekser. Passivt forvaltede fonde køber typisk ikke optioner, så indikatoren for put/call-forholdet følger mere nøje følelsen af aktivt forvaltede fonde.
13D/G-arkivering
Vi præsenterer 13D/G ansøgninger separat fra 13F ansøgninger på grund af den forskellige behandling af SEC. 13D/G-ansøgninger kan indgives af grupper af investorer (med én ledende), hvorimod 13F-ansøgninger ikke kan. Dette resulterer i situationer, hvor en investor kan indsende en 13D/G, der rapporterer én værdi for de samlede aktier (der repræsenterer alle de aktier, der ejes af investorgruppen), men derefter indsender en 13F, der rapporterer en anden værdi for de samlede aktier (der udelukkende repræsenterer deres egne) ejendomsret). Det betyder, at aktieejerskab af 13D/G-arkiver og 13F-arkiveringer ofte ikke er direkte sammenlignelige, så vi præsenterer dem separat.
Bemærk: Fra den 16. maj 2021 viser vi ikke længere ejere, der ikke har indsendt en 13D/G inden for det seneste år. Tidligere viste vi den fulde historie af 13D/G-arkiver. Generelt skal enheder, der er forpligtet til at indgive 13D/G-ansøgninger, indgive mindst årligt, før de indsender en afsluttende ansøgning. Dog forlader fonde nogle gange positioner uden at indsende en afsluttende ansøgning (dvs. de afvikler), så visning af den fulde historie resulterede nogle gange i forvirring om det nuværende ejerskab. For at undgå forvirring viser vi nu kun 'aktuelle' ejere - det vil sige - ejere, der har anmeldt inden for det seneste år.
Upgrade to unlock premium data.
| Fil dato | Form | Investor | Forrige Aktier |
Seneste Aktier |
Δ Aktier (Procent) |
Ejendomsret (Procent) |
Δ Ejerskab (Procent) |
|
|---|---|---|---|---|---|---|---|---|
| 2026-03-26 | VANGUARD GROUP INC | 9,491,159 | 0 | -100.00 | 0.00 | -100.00 | ||
| 2025-07-16 | BlackRock, Inc. | 6,159,305 | 6,133,427 | -0.42 | 7.60 | -12.64 | ||
| 2025-05-15 | AMERIPRISE FINANCIAL INC | 5,254,898 | 1,443,932 | -72.52 | 1.90 | -74.32 |
13F og NPORT arkivering
Detaljer om 13F-arkivering er gratis. Detaljer om NP-ansøgninger kræver et premium-medlemskab. Grønne rækker angiver nye positioner. Røde rækker angiver lukkede positioner. Klik på linket ikon for at se den fulde transaktionshistorik.
Opgrader
for at låse premium-data op og eksportere til Excel ![]() .
.
| Fil dato | Kilde | Investor | Type | Gennemsnitlig pris (Øst) |
Aktier | Δ Aktier (%) |
Rapporteret Værdi ($1000) |
Δ Værdi (%) |
Port Alloc (%) |
|
|---|---|---|---|---|---|---|---|---|---|---|
| 2026-02-11 | 13F | Group One Trading, L.p. | Call | 664.200 | 30,75 | 2.398 | 25,17 | |||
| 2026-02-11 | 13F | Group One Trading, L.p. | Put | 423.700 | 85,35 | 1.530 | 77,58 | |||
| 2025-11-14 | 13F | Woodline Partners LP | 0 | -100,00 | 0 | -100,00 | ||||
| 2026-02-17 | 13F | Sig Brokerage, Lp | 0 | -100,00 | 0 | -100,00 | ||||
| 2026-02-02 | 13F | Fifth Third Bancorp | 250 | 0,00 | 1 | |||||
| 2026-02-11 | 13F | Group One Trading, L.p. | 31.372 | -77,63 | 113 | -78,60 | ||||
| 2026-02-13 | 13F | Jacobs Levy Equity Management, Inc | 124.821 | 451 | ||||||
| 2026-02-11 | 13F | Los Angeles Capital Management Llc | 128.529 | 523 | ||||||
| 2026-01-29 | 13F | China Universal Asset Management Co., Ltd. | 17.003 | 9,91 | 61 | 5,17 | ||||
| 2026-02-17 | 13F | Russell Investments Group, Ltd. | 14.537 | 4,36 | 52 | 0,00 | ||||
| 2026-02-06 | 13F | Global Retirement Partners, LLC | 0 | -100,00 | 0 | -100,00 | ||||
| 2026-02-13 | 13F | Walleye Trading LLC | 0 | -100,00 | 0 | -100,00 | ||||
| 2026-02-17 | 13F | Wellington Management Group Llp | 257.271 | -2,84 | 929 | -7,01 | ||||
| 2026-02-17 | 13F | EFG International AG | 16.500 | 60 | ||||||
| 2026-02-09 | 13F | Jefferies Financial Group Inc. | Put | 50.000 | 0,00 | 180 | -4,26 | |||
| 2026-02-17 | 13F | D. E. Shaw & Co., Inc. | 1.343.583 | 272,81 | 4.850 | 257,14 | ||||
| 2026-02-17 | 13F | Tower Research Capital LLC (TRC) | 8.189 | -13,08 | 30 | -17,14 | ||||
| 2026-02-09 | 13F | Hartland & Co., LLC | 40 | 0 | ||||||
| 2026-01-27 | 13F | Zurcher Kantonalbank (Zurich Cantonalbank) | 1.125 | 0,00 | 4 | 0,00 | ||||
| 2026-01-21 | 13F | Kraematon Investment Advisors, Inc | 0 | -100,00 | 0 | -100,00 | ||||
| 2026-02-06 | 13F | Profund Advisors Llc | 72.298 | 114,46 | 261 | 104,72 | ||||
| 2026-02-13 | 13F/A | Virtus ETF Advisers LLC | 0 | -100,00 | 0 | -100,00 | ||||
| 2026-02-13 | 13F | Charles Schwab Investment Management Inc | 283.669 | 38,75 | 1.024 | 32,99 | ||||
| 2025-11-06 | 13F | Baader Bank INC | 0 | -100,00 | 0 | -100,00 | ||||
| 2026-02-12 | 13F | New York State Common Retirement Fund | 21.447 | 0,00 | 77 | -3,75 | ||||
| 2026-02-13 | 13F | Mml Investors Services, Llc | 34.550 | 0,00 | 125 | -4,62 | ||||
| 2026-04-10 | 13F | Country Trust Bank | 0 | -100,00 | 0 | -100,00 | ||||
| 2026-01-30 | 13F | Us Bancorp \de\ | 559 | 996,08 | 2 | |||||
| 2026-02-13 | 13F | Manufacturers Life Insurance Company, The | 27.596 | 6,19 | 100 | 2,06 | ||||
| 2026-02-17 | 13F | National Asset Management, Inc. | 13.955 | -31,86 | 50 | -35,06 | ||||
| 2025-11-14 | 13F | Wolverine Trading, Llc | 21.820 | -52,07 | 83 | -48,43 | ||||
| 2025-11-14 | 13F | Wolverine Trading, Llc | Call | 168.200 | -10,63 | 637 | -3,19 | |||
| 2025-11-14 | 13F | Wolverine Trading, Llc | Put | 43.200 | -57,35 | 164 | -53,95 | |||
| 2026-03-23 | 13F/A | Barclays Plc | Put | 0 | -100,00 | 0 | -100,00 | |||
| 2026-02-06 | 13F | ProShare Advisors LLC | 20.816 | 21,87 | 75 | 17,19 | ||||
| 2026-01-27 | 13F | TD Waterhouse Canada Inc. | 3.500 | 0,00 | 13 | -7,69 | ||||
| 2026-02-17 | 13F | Vines Capital Management, LLC | 17.884 | 65 | ||||||
| 2026-02-12 | 13F | Nuveen, LLC | 1.244.211 | 514,87 | 4.492 | 489,37 | ||||
| 2025-11-06 | 13F | Horizon Wealth Management, LLC | 0 | -100,00 | 0 | -100,00 | ||||
| 2026-04-08 | 13F | Miracle Mile Advisors, LLC | 17.000 | -0,12 | 52 | -14,75 | ||||
| 2026-02-05 | 13F | HighMark Wealth Management LLC | 2.000 | 7 | ||||||
| 2026-02-10 | 13F | Bank of New York Mellon Corp | 354.201 | 3,57 | 1.279 | -0,85 | ||||
| 2025-11-14 | 13F | Millennium Management Llc | Call | 0 | -100,00 | 0 | -100,00 | |||
| 2026-04-20 | 13F | Keudell/Morrison Wealth Management | 18.500 | 0,00 | 57 | -15,15 | ||||
| 2025-11-10 | 13F | Resources Investment Advisors, LLC. | 0 | -100,00 | 0 | -100,00 | ||||
| 2026-02-17 | 13F | Soviero Asset Management, LP | 400.000 | 1.444 | ||||||
| 2025-11-14 | 13F | Millennium Management Llc | Put | 0 | -100,00 | 0 | -100,00 | |||
| 2026-01-29 | 13F | UBS Group AG | Call | 275.500 | -3,64 | 995 | -7,71 | |||
| 2026-02-13 | 13F | Verition Fund Management LLC | Put | 50.000 | 0,00 | 180 | -4,26 | |||
| 2026-02-17 | 13F | Creative Planning | 46.886 | 28,89 | 169 | 23,36 | ||||
| 2026-01-29 | 13F | UBS Group AG | 642.048 | -0,12 | 2.318 | -4,37 | ||||
| 2026-02-13 | 13F | Verition Fund Management LLC | 69.476 | 123,01 | 251 | 113,68 | ||||
| 2026-04-07 | 13F | Farther Finance Advisors, LLC | 141 | 93,15 | 0 | |||||
| 2026-02-17 | 13F | Advisor Group Holdings, Inc. | 18.941 | 6,72 | 68 | 1,49 | ||||
| 2026-02-13 | 13F | SRS Capital Advisors, Inc. | 8.165 | 99,68 | 29 | 93,33 | ||||
| 2026-02-13 | 13F | Baird Financial Group, Inc. | 119.440 | 0,00 | 431 | -4,22 | ||||
| 2025-11-14 | 13F | Diadema Partners Lp | Put | 0 | -100,00 | 0 | -100,00 | |||
| 2026-02-13 | 13F | Morgan Stanley | 1.359.885 | -8,80 | 4.909 | -12,67 | ||||
| 2026-02-12 | 13F | MetLife Investment Management, LLC | 38.193 | -14,24 | 138 | -17,96 | ||||
| 2026-02-12 | 13F | Commonwealth Equity Services, Llc | 181.483 | 4,24 | 655 | |||||
| 2026-02-17 | 13F | Two Sigma Securities, Llc | 12.274 | 9,10 | 44 | 4,76 | ||||
| 2025-11-13 | 13F | Sei Investments Co | 0 | -100,00 | 0 | -100,00 | ||||
| 2026-02-03 | 13F | SBI Securities Co., Ltd. | 8.837 | 27,91 | 32 | 19,23 | ||||
| 2026-02-10 | 13F | Axq Capital, Lp | 25.701 | 25,77 | 93 | 19,48 | ||||
| 2026-02-13 | 13F | Ubs Asset Management Americas Inc | 672 | 2 | ||||||
| 2026-02-17 | 13F | Aqr Capital Management Llc | 21.147 | 76 | ||||||
| 2026-04-22 | 13F | Stone House Investment Management, LLC | 526 | 5,20 | 2 | 0,00 | ||||
| 2026-02-17 | 13F | Persistent Asset Partners Ltd | Call | 1.324 | 24,44 | 0 | -100,00 | |||
| 2025-11-14 | 13F | Avidity Partners Management LP | 0 | -100,00 | 0 | -100,00 | ||||
| 2026-04-14 | 13F | Zrc Wealth Management, Llc | 286 | 0,00 | 1 | -100,00 | ||||
| 2026-02-13 | 13F | Quarry LP | 0 | -100,00 | 0 | -100,00 | ||||
| 2026-02-11 | 13F | Simplex Trading, Llc | 0 | -100,00 | 0 | |||||
| 2026-02-17 | 13F | Caption Management, LLC | 74.438 | -42,74 | 269 | -45,31 | ||||
| 2026-01-29 | 13F | Beirne Wealth Consulting Services, LLC | 376.458 | -8,28 | 1.359 | -12,15 | ||||
| 2025-11-17 | 13F | Vivaldi Capital Management, LLC | 0 | -100,00 | 0 | -100,00 | ||||
| 2026-04-15 | 13F | Gf Fund Management Co. Ltd. | 2.331 | 13,76 | 7 | 0,00 | ||||
| 2026-02-09 | 13F | Jefferies Financial Group Inc. | 157.800 | 215,60 | 570 | 202,66 | ||||
| 2026-01-28 | 13F | Kingswood Wealth Advisors, Llc | 36.000 | 133,77 | 130 | 122,41 | ||||
| 2026-02-13 | 13F | Change Path, LLC | 10.500 | 38 | ||||||
| 2026-01-27 | 13F | Summit Financial Wealth Advisors, LLC | 103.288 | 7,27 | 373 | 0,00 | ||||
| 2026-02-17 | 13F | Caption Management, LLC | Call | 21.200 | 77 | |||||
| 2026-02-06 | 13F | EverSource Wealth Advisors, LLC | 17.683 | 10,29 | 64 | 5,00 | ||||
| 2026-02-17 | 13F | Citadel Advisors Llc | 1.337.927 | 4,36 | 4.830 | -0,08 | ||||
| 2026-02-17 | 13F | Citadel Advisors Llc | Put | 578.500 | 57,72 | 2.088 | 51,09 | |||
| 2026-01-29 | 13F | IMC-Chicago, LLC | 173.130 | 50,08 | 625 | 43,78 | ||||
| 2026-02-17 | 13F | Citadel Advisors Llc | Call | 423.200 | 14,47 | 1.528 | 9,62 | |||
| 2026-01-29 | 13F | IMC-Chicago, LLC | Put | 257.400 | 6,94 | 929 | 2,43 | |||
| 2026-02-13 | 13F | Stifel Financial Corp | 123.416 | 104,29 | 446 | 96,04 | ||||
| 2026-01-29 | 13F | IMC-Chicago, LLC | Call | 274.100 | -11,18 | 990 | -14,96 | |||
| 2026-02-18 | 13F | GWM Advisors LLC | 1.888 | -40,78 | 7 | -50,00 | ||||
| 2026-02-06 | 13F | Gsa Capital Partners Llp | 0 | -100,00 | 0 | |||||
| 2026-02-12 | 13F | DRW Securities, LLC | 22.469 | 81 | ||||||
| 2026-02-11 | 13F | Ameritas Investment Partners, Inc. | 6.955 | 0,00 | 25 | -3,85 | ||||
| 2026-01-16 | 13F | FNY Investment Advisers, LLC | 0 | -100,00 | 0 | |||||
| 2026-02-17 | 13F | ExodusPoint Capital Management, LP | 0 | -100,00 | 0 | -100,00 | ||||
| 2026-01-16 | 13F | FNY Investment Advisers, LLC | Call | 0 | -100,00 | 0 | ||||
| 2025-11-14 | 13F | Point72 (DIFC) Ltd | 8.143 | 31 | ||||||
| 2026-02-04 | 13F | Ameritas Advisory Services, LLC | 0 | -100,00 | 0 | |||||
| 2026-02-13 | 13F | Schroder Investment Management Group | 469.013 | 1.693 | ||||||
| 2026-02-06 | 13F | Leonteq Securities AG | 1.000 | 4 | ||||||
| 2026-02-17 | 13F | Two Sigma Advisers, Lp | 793.900 | -44,42 | 2.866 | -46,80 | ||||
| 2026-02-17 | 13F | Bank Of America Corp /de/ | 383.783 | 19,77 | 1.385 | 14,65 | ||||
| 2025-11-12 | 13F | Principal Securities, Inc. | 0 | -100,00 | 0 | |||||
| 2025-11-26 | 13F/A | Jpmorgan Chase & Co | Call | 0 | -100,00 | 0 | -100,00 | |||
| 2026-02-05 | 13F | Amalgamated Bank | 2.786 | 13,67 | 0 | |||||
| 2025-11-26 | 13F/A | Jpmorgan Chase & Co | Put | 0 | -100,00 | 0 | ||||
| 2026-02-06 | 13F | IFP Advisors, Inc | 0 | -100,00 | 0 | |||||
| 2026-01-14 | 13F | Hennion & Walsh Asset Management, Inc. | 214.632 | 15,66 | 775 | 10,73 | ||||
| 2026-01-16 | 13F | Trust Co Of Vermont | 1.000 | 4 | ||||||
| 2026-02-11 | 13F | Deutsche Bank Ag\ | 79.940 | 3,96 | 289 | -0,35 | ||||
| 2026-02-09 | 13F | Legal & General Group Plc | 9.362 | 8,61 | 34 | 3,13 | ||||
| 2025-11-14 | 13F | Exome Asset Management LLC | Put | 0 | -100,00 | 0 | -100,00 | |||
| 2026-02-11 | 13F | Fox Run Management, L.l.c. | 30.603 | 110 | ||||||
| 2026-02-13 | 13F | Sculptor Capital LP | 276.700 | 0,00 | 999 | -4,31 | ||||
| 2026-02-17 | 13F | Northeast Financial Group, Inc. | 13.393 | 48 | ||||||
| 2025-11-14 | 13F | Peak6 Llc | 0 | -100,00 | 0 | -100,00 | ||||
| 2026-02-17 | 13F | Knoll Capital Management, LLC | 1.121.524 | 0,00 | 4.049 | -4,26 | ||||
| 2026-02-17 | 13F | Jones Financial Companies Lllp | 12.526 | 89,04 | 45 | 73,08 | ||||
| 2026-02-13 | 13F | Sculptor Capital LP | Put | 276.700 | 0,00 | 999 | -4,31 | |||
| 2026-04-07 | 13F | Signaturefd, Llc | 0 | -100,00 | 0 | -100,00 | ||||
| 2026-02-06 | 13F | HighTower Advisors, LLC | 0 | -100,00 | 0 | -100,00 | ||||
| 2026-02-17 | 13F | Virtus Investment Advisers, Inc. | 50.482 | 217,22 | 182 | 208,47 | ||||
| 2026-02-17 | 13F | Schonfeld Strategic Advisors LLC | 13.021 | 47 | ||||||
| 2026-01-30 | 13F | North Star Investment Management Corp. | 8.000 | 0,00 | 29 | -6,67 | ||||
| 2026-02-17 | 13F | Point72 Asset Management, L.P. | 0 | -100,00 | 0 | -100,00 | ||||
| 2025-10-30 | 13F | Parkside Financial Bank & Trust | 0 | -100,00 | 0 | |||||
| 2026-02-13 | 13F | Vontobel Holding Ltd. | 15.000 | 54 | ||||||
| 2026-02-11 | 13F | LPL Financial LLC | 48.626 | -20,96 | 176 | -24,24 | ||||
| 2026-04-21 | 13F | Wealth Effects Llc | 131.950 | 18,08 | 406 | 0,74 | ||||
| 2026-02-11 | 13F | Parallel Advisors, LLC | 40 | 0,00 | 0 | |||||
| 2026-02-17 | 13F | Farallon Capital Management Llc | 27.600 | 0,00 | 100 | -4,81 | ||||
| 2025-11-14 | 13F | Point72 Europe (London) LLP | 5.484 | 21 | ||||||
| 2025-11-07 | 13F | HighTower Advisors, LLC | Call | 0 | -100,00 | 0 | -100,00 | |||
| 2026-02-09 | 13F | Geode Capital Management, Llc | 2.292.410 | 13,63 | 8.278 | 8,81 | ||||
| 2026-02-13 | 13F | Marshall Wace, Llp | 922.777 | 3.331 | ||||||
| 2026-02-06 | 13F | Larson Financial Group LLC | 5.306 | 0,02 | 19 | -5,00 | ||||
| 2026-02-13 | 13F | Walleye Trading LLC | Put | 32.200 | 116 | |||||
| 2025-11-14 | 13F/A | Skopos Labs, Inc. | 0 | -100,00 | 0 | -100,00 | ||||
| 2025-11-14 | 13F | Scientech Research LLC | 0 | -100,00 | 0 | -100,00 | ||||
| 2026-02-13 | 13F | Walleye Trading LLC | Call | 95.800 | 1.068,29 | 346 | 1.050,00 | |||
| 2026-02-13 | 13F | State Street Corp | 5.119.703 | 42,16 | 18.482 | 36,14 | ||||
| 2026-01-26 | 13F | Cwm, Llc | 3.082 | 36,13 | 0 | |||||
| 2026-02-13 | 13F | Wells Fargo & Company/mn | 141.282 | 52,07 | 510 | 45,71 | ||||
| 2026-02-17 | 13F | Diadema Partners Lp | Call | 491.800 | 6,22 | 1.775 | 1,72 | |||
| 2026-02-17 | 13F | Man Group plc | 18.936 | 68 | -54,67 | |||||
| 2026-01-27 | 13F | First Horizon Corp | 3 | 0,00 | 0 | |||||
| 2026-02-17 | 13F | Canada Pension Plan Investment Board | 30.000 | 108 | ||||||
| 2026-04-02 | 13F | Marex Group plc | 25.000 | 0,00 | 125 | -30,56 | ||||
| 2026-02-05 | 13F | Cambridge Investment Research Advisors, Inc. | 0 | -100,00 | 0 | |||||
| 2026-02-17 | 13F | Northern Trust Corp | 715.991 | 8,98 | 2.585 | 4,36 | ||||
| 2026-02-11 | 13F | DCF Advisers, LLC | Call | 158.000 | 570 | |||||
| 2026-02-17 | 13F | Advisory Services Network, LLC | 15.160 | 69,20 | 55 | 63,64 | ||||
| 2026-02-11 | 13F | DCF Advisers, LLC | 18.700 | 68 | ||||||
| 2025-11-13 | 13F | Prudential Financial Inc | 0 | -100,00 | 0 | -100,00 | ||||
| 2026-02-17 | 13F | Brevan Howard Capital Management LP | 114.128 | -48,81 | 412 | -50,95 | ||||
| 2026-01-29 | 13F | Vanguard Group Inc | 9.491.159 | 48,91 | 34.263 | 42,60 | ||||
| 2026-02-13 | 13F | Squarepoint Ops LLC | 34.949 | -94,02 | 126 | -94,28 | ||||
| 2026-02-10 | 13F | Bnp Paribas Arbitrage, Sa | 177.305 | 137,89 | 640 | 128,57 | ||||
| 2026-02-10 | 13F | Rothschild Investment Llc | 1 | 0 | ||||||
| 2026-02-17 | 13F | Cetera Investment Advisers | 29.687 | 46,92 | 107 | 40,79 | ||||
| 2025-10-30 | 13F | Twin Peaks Wealth Advisors, LLC | 0 | -100,00 | 0 | |||||
| 2026-04-22 | 13F | Sterling Capital Management LLC | 847 | 59,81 | 3 | 100,00 | ||||
| 2026-02-11 | 13F | Jpmorgan Chase & Co | 104.532 | 5,38 | 377 | 1,07 | ||||
| 2025-11-14 | 13F | Mercer Global Advisors Inc /adv | 0 | -100,00 | 0 | -100,00 | ||||
| 2026-02-17 | 13F | Bridgeway Capital Management Inc | 50.600 | 0,00 | 183 | -4,21 | ||||
| 2026-02-05 | 13F | Allworth Financial LP | 89 | 0 | ||||||
| 2026-02-17 | 13F | Boothbay Fund Management, Llc | Call | 0 | -100,00 | 0 | -100,00 | |||
| 2026-02-13 | 13F | Macquarie Group Ltd | 0 | -100,00 | 0 | -100,00 | ||||
| 2025-11-05 | 13F | Envestnet Asset Management Inc | 0 | -100,00 | 0 | -100,00 | ||||
| 2026-02-17 | 13F | Delaware Management Holdings, Inc. | 100.000 | 361 | ||||||
| 2026-02-12 | 13F | BlackRock, Inc. | 9.704.298 | 52,27 | 35.033 | 45,80 | ||||
| 2026-02-17 | 13F | Grantham, Mayo, Van Otterloo & Co. LLC | 172.559 | 623 | ||||||
| 2026-02-19 | 13F | Invesco Ltd. | 214.824 | 32,65 | 776 | 27,05 | ||||
| 2026-02-13 | 13F | Victory Capital Management Inc | 11.930 | 18,58 | 43 | 16,22 | ||||
| 2026-02-13 | 13F | Police & Firemen's Retirement System of New Jersey | 23.573 | 0,00 | 85 | -3,41 | ||||
| 2026-02-04 | 13F | LRI Investments, LLC | 123 | 0 | ||||||
| 2026-01-29 | 13F | Comerica Bank | 28 | 0 | ||||||
| 2026-03-16 | 13F/A | Rockefeller Capital Management L.P. | 43.167 | 79.838,89 | 156 | |||||
| 2025-10-27 | 13F | Versant Capital Management, Inc | 0 | -100,00 | 0 | |||||
| 2026-02-09 | 13F | Huntington National Bank | 2 | 0,00 | 0 | |||||
| 2026-02-17 | 13F | California State Teachers Retirement System | 5.461 | 12,74 | 20 | 5,56 | ||||
| 2026-02-17 | 13F | Alliancebernstein L.p. | 71.760 | 0,00 | 259 | -4,07 | ||||
| 2026-02-13 | 13F | Barclays Plc | 400.595 | 17,72 | 1.446 | 12,79 | ||||
| 2026-04-16 | 13F | SG Americas Securities, LLC | 55.625 | 426,00 | 0 | |||||
| 2025-11-14 | 13F | Bayesian Capital Management, LP | 0 | -100,00 | 0 | |||||
| 2026-04-13 | 13F | E Fund Management Co., Ltd. | 29.072 | 155,98 | 90 | 106,98 | ||||
| 2026-02-06 | 13F | HighTower Advisors, LLC | Put | 0 | -100,00 | 0 | -100,00 | |||
| 2026-02-13 | 13F | Rafferty Asset Management, LLC | 195.766 | 25,34 | 707 | 20,07 | ||||
| 2026-02-17 | 13F/A | Kovack Advisors, Inc. | 35.215 | 127 | ||||||
| 2026-02-17 | 13F | Engineers Gate Manager LP | 87.264 | 112,62 | 315 | 104,55 | ||||
| 2026-04-22 | 13F | Gerber, Llc | Call | 2.310 | ||||||
| 2026-02-10 | 13F | Acadian Asset Management Llc | 35.732 | 0 | ||||||
| 2026-02-13 | 13F | Caitong International Asset Management Co., Ltd | 12.322 | 44 | ||||||
| 2026-02-17 | 13F | Silvercrest Asset Management Group Llc | 103.500 | 0,00 | 374 | -4,36 | ||||
| 2026-02-17 | 13F | Raymond James Financial Inc | 55.859 | 101,86 | 202 | 93,27 | ||||
| 2026-02-17 | 13F | Wiley Bros.-aintree Capital, Llc | 15.035 | 54 | ||||||
| 2026-03-20 | 13F/A | Hsbc Holdings Plc | 132.221 | 80,81 | 474 | 74,26 | ||||
| 2026-02-17 | 13F | Susquehanna Portfolio Strategies, LLC | 135.170 | -27,02 | 488 | -30,23 | ||||
| 2026-04-22 | 13F | Janney Montgomery Scott LLC | 172.610 | 68,22 | 1 | |||||
| 2026-02-12 | 13F | Voya Investment Management Llc | 13.690 | 0,00 | 49 | -3,92 | ||||
| 2026-01-30 | 13F | W.G. Shaheen & Associates DBA Whitney & Co | Call | 0 | -100,00 | 0 | -100,00 | |||
| 2026-02-10 | 13F | Goldman Sachs Group Inc | 1.349.293 | 139,98 | 4.871 | 129,83 | ||||
| 2026-02-13 | 13F | Citigroup Inc | 28.324 | 189,79 | 102 | 183,33 | ||||
| 2026-02-13 | 13F | MAI Capital Management | 150 | 0,00 | 1 | |||||
| 2025-11-14 | 13F | Dark Forest Capital Management Lp | 10.165 | 0,00 | 39 | 0,00 | ||||
| 2026-02-20 | 13F | Sunbelt Securities, Inc. | 10.844 | 0,00 | 39 | -2,50 | ||||
| 2026-01-26 | 13F | Mirae Asset Global Investments Co., Ltd. | 5.070 | 48,59 | 18 | 50,00 | ||||
| 2026-02-17 | 13F | Ameriprise Financial Inc | 73.838 | -0,64 | 267 | -5,00 | ||||
| 2025-11-12 | 13F | Headlands Technologies LLC | 0 | -100,00 | 0 | -100,00 | ||||
| 2026-04-15 | 13F | Activest Wealth Management | 5.001 | 0,00 | 15 | -16,67 | ||||
| 2025-11-04 | 13F | Winnow Wealth Llc | 0 | -100,00 | 0 | -100,00 | ||||
| 2025-11-13 | 13F | Glenmede Investment Management, LP | 0 | -100,00 | 0 | -100,00 | ||||
| 2026-02-05 | 13F | Td Private Client Wealth Llc | 193 | 1 | ||||||
| 2026-02-17 | 13F | Gotham Asset Management, LLC | 12.669 | 46 | ||||||
| 2026-02-10 | 13F/A | Northwestern Mutual Wealth Management Co | 100 | -0,99 | 0 | |||||
| 2026-02-11 | 13F | Commonwealth Retirement Investments LLC | 1 | 0 | ||||||
| 2025-10-29 | 13F | Wealth Enhancement Advisory Services, Llc | 0 | -100,00 | 0 | -100,00 | ||||
| 2026-02-17 | 13F | Blair William & Co/il | 56.434 | 204 | ||||||
| 2025-11-14 | 13F | State Board Of Administration Of Florida Retirement System | 0 | -100,00 | 0 | -100,00 | ||||
| 2026-02-17 | 13F | Voleon Capital Management Lp | 47.055 | 170 | ||||||
| 2026-02-05 | 13F | Bessemer Group Inc | 0 | -100,00 | 0 | |||||
| 2025-12-18 | 13F | Danske Bank A/s | 0 | -100,00 | 0 | |||||
| 2026-01-29 | 13F | Concurrent Investment Advisors, LLC | 26.508 | 10,41 | 96 | 5,56 | ||||
| 2026-02-03 | 13F | Legacy Wealth Managment, LLC/ID | 250 | 1 | ||||||
| 2026-02-17 | 13F | Two Sigma Investments, Lp | 1.265.683 | -36,62 | 4.569 | -39,31 | ||||
| 2026-02-17 | 13F | Sherbrooke Park Advisers Llc | 14.152 | -11,02 | 51 | -13,56 | ||||
| 2026-02-02 | 13F | Cornerstone Planning Group LLC | 1 | -99,96 | 0 | -100,00 | ||||
| 2025-11-14 | 13F | Caption Management, LLC | Put | 0 | -100,00 | 0 | -100,00 | |||
| 2026-02-13 | 13F | Motiv8 Investments LLC | 67 | 0 | ||||||
| 2026-01-15 | 13F | Bernard Wealth Management Corp. | 15 | 0,00 | 0 | |||||
| 2026-02-13 | 13F | Rhumbline Advisers | 121.513 | -7,06 | 439 | -10,98 | ||||
| 2026-02-11 | 13F | Simplex Trading, Llc | Put | 562.600 | 13,86 | 2.031 | 202.900,00 | |||
| 2026-02-11 | 13F | Simplex Trading, Llc | Call | 376.800 | 20,23 | 1.360 | 135.900,00 | |||
| 2026-02-17 | 13F | Ikarian Capital, LLC | Call | 0 | -100,00 | 0 | -100,00 | |||
| 2026-02-17 | 13F | Millennium Management Llc | 207.383 | -43,58 | 749 | -45,99 | ||||
| 2026-02-12 | 13F | Alps Advisors Inc | 85.677 | 309 | ||||||
| 2025-10-31 | 13F | PFG Investments, LLC | 0 | -100,00 | 0 | -100,00 | ||||
| 2026-01-28 | 13F | Geneos Wealth Management Inc. | 10.000 | 0,00 | 36 | -2,70 | ||||
| 2025-11-13 | 13F | Affinity Asset Advisors, LLC | Call | 0 | -100,00 | 0 | -100,00 | |||
| 2026-02-17 | 13F | LMR Partners LLP | 61.300 | 221 | ||||||
| 2026-02-17 | 13F | LMR Partners LLP | Put | 250.000 | 0,00 | 902 | -4,25 | |||
| 2026-02-12 | 13F | Dimensional Fund Advisors Lp | 283.703 | -4,73 | 1.024 | -8,73 | ||||
| 2026-02-17 | 13F | Jump Financial, LLC | 242.017 | 109,00 | 874 | 100,23 | ||||
| 2026-02-17 | 13F | Price T Rowe Associates Inc /md/ | 49.879 | 20,21 | 0 | |||||
| 2026-01-15 | 13F | Nisa Investment Advisors, Llc | 95 | 0,00 | 0 | |||||
| 2025-11-14 | 13F | Centiva Capital, LP | Put | 0 | -100,00 | 0 | -100,00 | |||
| 2026-02-03 | 13F | Sequoia Financial Advisors, LLC | 12.428 | 2,93 | 45 | -2,22 | ||||
| 2026-02-13 | 13F | DLD Asset Management, LP | 0 | -100,00 | 0 | -100,00 | ||||
| 2026-02-12 | 13F | Steward Partners Investment Advisory, Llc | 245.393 | 11,89 | 886 | 7,14 | ||||
| 2026-02-17 | 13F | Susquehanna International Group, Llp | Put | 1.766.600 | 4,76 | 6.377 | 0,31 | |||
| 2025-11-14 | 13F | Centiva Capital, LP | 0 | -100,00 | 0 | -100,00 | ||||
| 2026-02-17 | 13F | Susquehanna International Group, Llp | Call | 541.300 | -34,47 | 1.954 | -37,25 | |||
| 2026-02-17 | 13F | Susquehanna International Group, Llp | 1.369.017 | -0,38 | 4.942 | -4,59 | ||||
| 2026-04-13 | 13F | Massmutual Trust Co Fsb/adv | 1.000 | 8,93 | 3 | 0,00 | ||||
| 2026-02-09 | 13F | Quest Partners LLC | 19.820 | 0,00 | 72 | -4,05 | ||||
| 2026-02-17 | 13F | Royal Bank Of Canada | 27.414 | -58,92 | 99 | -60,56 | ||||
| 2026-02-13 | 13F | Martingale Asset Management L P | 14.355 | 52 | ||||||
| 2026-03-12 | 13F/A | Peak6 Llc | Call | 78.000 | -46,94 | 282 | -49,28 | |||
| 2025-11-14 | 13F | Balyasny Asset Management Llc | Call | 0 | -100,00 | 0 | ||||
| 2026-02-02 | 13F | PKS Advisory Services, LLC | 15.100 | 55 | ||||||
| 2026-02-10 | 13F | Intech Investment Management Llc | 52.557 | 36,02 | 190 | 30,34 | ||||
| 2026-01-07 | 13F | Aventura Private Wealth, LLC | 0 | -100,00 | 0 | -100,00 | ||||
| 2026-02-12 | 13F | Groupe la Francaise | 0 | -100,00 | 0 | -100,00 | ||||
| 2026-02-17 | 13F | Quadrature Capital Ltd | 10.101 | 36 | ||||||
| 2026-01-15 | 13F/A | Persistent Asset Partners Ltd | Put | 0 | -100,00 | 0 | -100,00 | |||
| 2025-11-14 | 13F/A | DLD Asset Management, LP | Put | 0 | -100,00 | 0 | -100,00 | |||
| 2026-04-09 | 13F | Brown Wealth Management, Llc | 236.136 | -8,71 | 727 | -22,08 | ||||
| 2026-02-17 | 13F | Tang Capital Management Llc | 2.131.307 | 0,00 | 7.694 | -4,24 | ||||
| 2026-02-17 | 13F | Fmr Llc | 564.093 | 26,72 | 2.036 | 21,33 | ||||
| 2026-02-23 | 13F | Virtu Financial LLC | 58.477 | 21,65 | 0 | |||||
| 2025-11-14 | 13F/A | DLD Asset Management, LP | Call | 0 | -100,00 | 0 | -100,00 | |||
| 2026-02-12 | 13F | Federated Hermes, Inc. | 0 | -100,00 | 0 | |||||
| 2026-02-12 | 13F | Jane Street Group, Llc | Call | 159.800 | 132,61 | 577 | 123,26 | |||
| 2026-02-10 | 13F | Daiwa Securities Group Inc. | 235 | 0,00 | 0 | |||||
| 2026-02-12 | 13F | Jane Street Group, Llc | 1.783.950 | 536,67 | 6.440 | 509,85 | ||||
| 2026-02-17 | 13F | MIRAE ASSET GLOBAL ETFS HOLDINGS Ltd. | 52.566 | 14,51 | 190 | 9,25 | ||||
| 2025-10-28 | 13F | Gerber, Llc | 0 | -100,00 | 0 | -100,00 | ||||
| 2026-02-13 | 13F | Fortis Capital Management LLC | 0 | -100,00 | 0 | -100,00 | ||||
| 2026-02-17 | 13F | TCG Advisory Services, LLC | Call | 4.000 | 14 | |||||
| 2026-02-06 | 13F | Pnc Financial Services Group, Inc. | 2.412 | -16,28 | 9 | -20,00 | ||||
| 2026-02-12 | 13F | Jane Street Group, Llc | Put | 104.400 | 77,85 | 377 | 70,14 | |||
| 2026-02-17 | 13F | TCG Advisory Services, LLC | 14.218 | 51 | ||||||
| 2026-02-17 | 13F | Sender Co & Partners, Inc. | Call | 0 | -100,00 | 0 | -100,00 | |||
| 2026-02-13 | 13F | Walleye Capital LLC | Put | 3.500 | 1.650,00 | 13 | ||||
| 2026-02-13 | 13F | Walleye Capital LLC | 65.665 | 323,15 | 237 | 308,62 | ||||
| 2026-01-29 | 13F | Nbc Securities, Inc. | 0 | -100,00 | 0 | -100,00 | ||||
| 2026-02-12 | 13F | Hollencrest Capital Management | 0 | -100,00 | 0 | -100,00 | ||||
| 2026-02-13 | 13F | Walleye Capital LLC | Call | 64.400 | -27,15 | 232 | -30,33 | |||
| 2026-02-17 | 13F | Balyasny Asset Management Llc | 60.109 | 217 |
Other Listings
| DE:3G0 | 2,68 € |