Grundlæggende statistik
| Institutionelle ejere | 151 total, 143 long only, 1 short only, 7 long/short - change of -1,71% MRQ |
| Gennemsnitlig porteføljeallokering | 0.3580 % - change of 4,43% MRQ |
| Institutionelle aktier (lange) | 49.056.816 (ex 13D/G) - change of -0,02MM shares -0,04% MRQ |
| Institutionel værdi (lang) | $ 439.198 USD ($1000) |
Institutionelt ejerskab og aktionærer
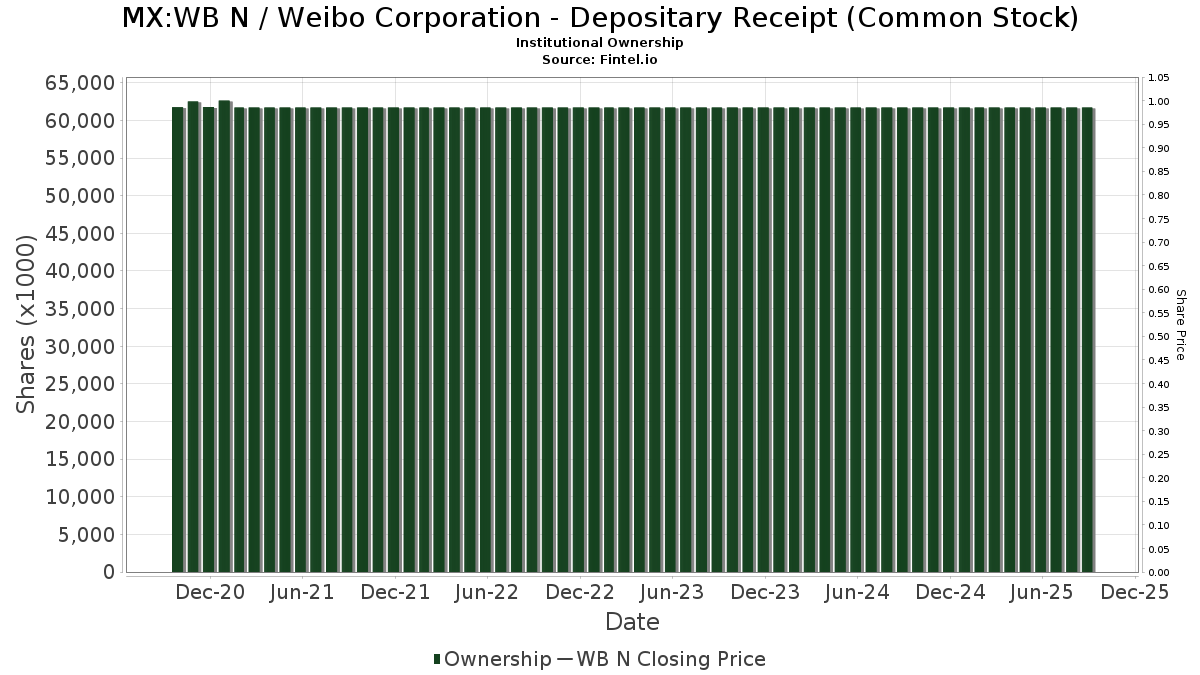
Weibo Corporation - Depositary Receipt (Common Stock) (MX:WB N) har 151 institutionelle ejere og aktionærer, der har indsendt 13D/G- eller 13F-formularer til Securities Exchange Commission (SEC). Disse institutioner har i alt 49,056,816 aktier. Største aktionærer omfatter Alibaba Group Holding Ltd, Acadian Asset Management Llc, Krane Funds Advisors LLC, Causeway Capital Management Llc, Saba Capital Management, L.P., FIL Ltd, UBS Group AG, Delaware Management Holdings, Inc., Goldman Sachs Group Inc, and Norges Bank .
Weibo Corporation - Depositary Receipt (Common Stock) (BMV:WB N) institutionel ejerskabsstruktur viser aktuelle positioner i virksomheden efter institutioner og fonde, samt seneste ændringer i positionsstørrelse. Større aktionærer kan omfatte individuelle investorer, investeringsforeninger, hedgefonde eller institutioner. Skema 13D angiver, at investoren besidder (eller besidder) mere end 5 % af virksomheden og har til hensigt (eller har til hensigt at) aktivt at forfølge en ændring i forretningsstrategi. Skema 13G indikerer en passiv investering på over 5%.
Fondens stemningsscore
Fund Sentiment Score (fka Ownership Accumulation Score) finder de aktier, der bliver mest købt af fonde. Det er resultatet af en sofistikeret, multi-faktor kvantitativ model, der identificerer virksomheder med de højeste niveauer af institutionel akkumulering. Scoringsmodellen bruger en kombination af den samlede stigning i oplyste ejere, ændringerne i porteføljeallokeringer i disse ejere og andre målinger. Tallet går fra 0 til 100, hvor højere tal indikerer et højere niveau af akkumulering for sine jævnaldrende, og 50 er gennemsnittet.
Opdateringsfrekvens: Dagligt
Se Ownership Explorer, som giver en liste over højest rangerende virksomheder.
AI+ Ask Fintel’s AI assistant about Weibo Corporation - Depositary Receipt (Common Stock).
Select a question to share a public post with an AI-crafted answer.
Thinking of good questions…
13F og NPORT arkivering
Detaljer om 13F-arkivering er gratis. Detaljer om NP-ansøgninger kræver et premium-medlemskab. Grønne rækker angiver nye positioner. Røde rækker angiver lukkede positioner. Klik på linket ikon for at se den fulde transaktionshistorik.
Opgrader
for at låse premium-data op og eksportere til Excel ![]() .
.
| Fil dato | Kilde | Investor | Type | Gennemsnitlig pris (Øst) |
Aktier | Δ Aktier (%) |
Rapporteret Værdi ($1000) |
Δ Værdi (%) |
Port Alloc (%) |
|
|---|---|---|---|---|---|---|---|---|---|---|
| 2025-11-07 | 13F | Sierra Ocean, Llc | 0 | -100,00 | 0 | |||||
| 2026-02-06 | 13F | EverSource Wealth Advisors, LLC | 886 | -8,85 | 9 | -25,00 | ||||
| 2026-03-12 | 13F/A | Peak6 Llc | Call | 392.600 | -7,21 | 4.012 | -23,52 | |||
| 2026-01-28 | 13F | CAPROCK Group, Inc. | 88.956 | 66,80 | 909 | 48,77 | ||||
| 2026-02-11 | 13F | Krane Funds Advisors LLC | 4.274.081 | -8,60 | 43.681 | -15,80 | ||||
| 2026-02-17 | 13F | DZ BANK AG Deutsche Zentral Genossenschafts Bank, Frankfurt am Main | 4 | -99,92 | 0 | -100,00 | ||||
| 2026-02-12 | 13F | Barometer Capital Management Inc. | 0 | -100,00 | 0 | |||||
| 2026-02-17 | 13F | FIL Ltd | 1.633.387 | 16.693 | ||||||
| 2026-04-23 | 13F | CBOE Vest Financial, LLC | 29.458 | 16,16 | 258 | -0,77 | ||||
| 2026-04-23 | 13F | Harbor Investment Advisory, Llc | 3 | 0,00 | 0 | |||||
| 2026-02-06 | 13F | Global Retirement Partners, LLC | 301 | 157,26 | 3 | 200,00 | ||||
| 2026-04-23 | 13F | North Star Investment Management Corp. | 2.001 | -7,10 | 18 | -22,73 | ||||
| 2026-02-12 | 13F | Federated Hermes, Inc. | 0 | -100,00 | 0 | |||||
| 2026-02-17 | 13F | Two Sigma Advisers, Lp | 723.588 | -11,35 | 7.395 | -26,93 | ||||
| 2026-02-12 | 13F | Dimensional Fund Advisors Lp | 821.887 | -1,02 | 8.397 | -18,47 | ||||
| 2025-11-14 | 13F | Cubist Systematic Strategies, LLC | 0 | -100,00 | 0 | -100,00 | ||||
| 2026-01-29 | 13F | IMC-Chicago, LLC | Put | 41.300 | -28,79 | 422 | -41,31 | |||
| 2026-01-29 | 13F | IMC-Chicago, LLC | Call | 32.700 | 60,29 | 334 | 32,54 | |||
| 2026-02-17 | 13F | Edmond De Rothschild Holding S.a. | 94.673 | 0,00 | 968 | -17,56 | ||||
| 2026-04-16 | 13F | Diversified Trust Co | 0 | -100,00 | 0 | |||||
| 2026-04-20 | 13F | Ronald Blue Trust, Inc. | 18 | 38,46 | 0 | |||||
| 2025-10-28 | 13F | Wolverine Asset Management Llc | 0 | -100,00 | 0 | -100,00 | ||||
| 2026-02-12 | 13F | Jane Street Group, Llc | 471.940 | -20,79 | 4.823 | -34,72 | ||||
| 2026-02-10 | 13F | Goldman Sachs Group Inc | 1.480.621 | 8,21 | 15.132 | -10,82 | ||||
| 2026-02-12 | 13F | Jane Street Group, Llc | Call | 258.000 | 12,03 | 2.637 | -7,67 | |||
| 2026-02-17 | 13F | Millennium Management Llc | 102.254 | 1.045 | ||||||
| 2025-11-13 | 13F | Connor, Clark & Lunn Investment Management Ltd. | 0 | -100,00 | 0 | |||||
| 2026-02-13 | 13F | Barclays Plc | 44.213 | -53,19 | 452 | -61,49 | ||||
| 2026-02-17 | 13F | Fmr Llc | 209 | -4,57 | 2 | 0,00 | ||||
| 2026-02-13 | 13F | Marshall Wace, Llp | 0 | -100,00 | 0 | |||||
| 2026-02-17 | 13F | Russell Investments Group, Ltd. | 450.977 | -7,73 | 4.577 | -25,08 | ||||
| 2026-01-14 | 13F | ORG Partners LLC | 170 | 0,00 | 2 | -50,00 | ||||
| 2026-02-06 | 13F | Gsa Capital Partners Llp | 0 | -100,00 | 0 | |||||
| 2026-02-13 | 13F | Healthcare Of Ontario Pension Plan Trust Fund | 0 | -100,00 | 0 | |||||
| 2026-02-09 | 13F | Legal & General Group Plc | 248.445 | 16,56 | 2.538 | -3,94 | ||||
| 2026-02-12 | 13F | XY Capital Ltd | 198.356 | 94,07 | 2.027 | 59,98 | ||||
| 2025-11-14 | 13F | Numerai GP LLC | 0 | -100,00 | 0 | |||||
| 2026-02-11 | 13F | Jpmorgan Chase & Co | 293.765 | -51,60 | 3.002 | -60,11 | ||||
| 2026-02-13 | 13F | Caitong International Asset Management Co., Ltd | 73 | 65,91 | 1 | |||||
| 2026-02-17 | 13F | Mangrove Partners | 21.133 | -70,67 | 216 | -75,92 | ||||
| 2026-02-13 | 13F | Great West Life Assurance Co /can/ | 18.674 | 0,00 | 0 | |||||
| 2026-02-17 | 13F | Two Sigma Securities, Llc | 13.912 | 142 | ||||||
| 2026-04-20 | 13F | Jfs Wealth Advisors, Llc | 100 | 0,00 | 1 | -100,00 | ||||
| 2026-02-10 | 13F | Commonwealth Of Pennsylvania Public School Empls Retrmt Sys | 300.807 | 0,00 | 3.074 | -17,59 | ||||
| 2026-02-13 | 13F | Schroder Investment Management Group | 94.895 | -86,68 | 963 | -89,19 | ||||
| 2026-02-13 | 13F | Alpine Investment Management Ltd | 386.000 | 3.945 | ||||||
| 2026-02-13 | 13F | Pathstone Holdings, LLC | 25.981 | 1,05 | 266 | -16,67 | ||||
| 2026-02-17 | 13F | Delaware Management Holdings, Inc. | 1.589.558 | 16.246 | ||||||
| 2026-02-19 | 13F | Invesco Ltd. | 491.951 | -0,99 | 5.028 | -18,41 | ||||
| 2025-11-13 | 13F | Canada Pension Plan Investment Board | 0 | -100,00 | 0 | -100,00 | ||||
| 2026-02-13 | 13F | American Century Companies Inc | 721.116 | 10,30 | 7.370 | -9,09 | ||||
| 2026-02-13 | 13F | Pinnacle Wealth Planning Services, Inc. | 96 | 1 | ||||||
| 2026-01-20 | 13F | Savvy Advisors, Inc. | 0 | -100,00 | 0 | |||||
| 2026-03-26 | 13F/A | Peak6 Llc | Put | 0 | -100,00 | 0 | -100,00 | |||
| 2026-04-22 | 13F | Stone House Investment Management, LLC | 68 | 1 | ||||||
| 2026-01-13 | 13F | Kathmere Capital Management, LLC | 50.418 | 91,22 | 515 | 57,98 | ||||
| 2026-02-17 | 13F | Citadel Advisors Llc | Put | 118.100 | 86,87 | 1.207 | 54,02 | |||
| 2026-02-10 | 13F | Acadian Asset Management Llc | 5.858.877 | -0,02 | 60 | -18,06 | ||||
| 2026-02-17 | 13F | Citadel Advisors Llc | Call | 148.700 | -3,06 | 1.520 | -20,14 | |||
| 2026-02-12 | 13F | CIBC Private Wealth Group, LLC | 0 | -100,00 | 0 | |||||
| 2026-02-13 | 13F | Police & Firemen's Retirement System of New Jersey | 27.377 | -29,76 | 280 | -42,24 | ||||
| 2026-03-26 | 13F | Leonteq Securities AG | Call | 0 | -100,00 | 0 | ||||
| 2026-03-26 | 13F | Leonteq Securities AG | Put | 0 | -100,00 | 0 | ||||
| 2025-11-14 | 13F | Lazard Asset Management Llc | 0 | -100,00 | 0 | |||||
| 2026-02-13 | 13F | Headlands Technologies LLC | 36.048 | 121,94 | 368 | 83,08 | ||||
| 2026-01-27 | 13F | WealthCollab, LLC | 5.123 | 50,06 | 52 | 23,81 | ||||
| 2026-02-17 | 13F | Raymond James Financial Inc | 12.259 | -9,55 | 125 | -25,60 | ||||
| 2026-04-20 | 13F | LVW Advisors, LLC | 46.123 | 404 | ||||||
| 2026-02-17 | 13F | Citadel Advisors Llc | 0 | -100,00 | 0 | |||||
| 2026-04-17 | 13F | AdvisorNet Financial, Inc | 0 | -100,00 | 0 | |||||
| 2026-02-06 | 13F | Larson Financial Group LLC | 867 | 0,81 | 9 | -20,00 | ||||
| 2026-02-11 | 13F | Allianz Asset Management GmbH | 164.342 | 23,90 | 1.680 | 2,13 | ||||
| 2026-02-12 | 13F | Loomis Sayles & Co L P | 0 | -100,00 | 0 | |||||
| 2026-02-17 | 13F | Grantham, Mayo, Van Otterloo & Co. LLC | 637.145 | -39,08 | 6.512 | -49,79 | ||||
| 2026-02-17 | 13F | Royal Bank Of Canada | 1.044 | 7,41 | 11 | -8,33 | ||||
| 2026-02-17 | 13F | Qube Research & Technologies Ltd | 735.046 | 51,51 | 7.512 | 24,89 | ||||
| 2026-02-17 | 13F | MIRAE ASSET GLOBAL ETFS HOLDINGS Ltd. | 38.835 | -6,26 | 397 | -22,81 | ||||
| 2026-02-12 | 13F | New York State Common Retirement Fund | 557.849 | 10,21 | 5.701 | -9,16 | ||||
| 2026-02-17 | 13F | CastleKnight Management LP | 0 | -100,00 | 0 | |||||
| 2026-02-17 | 13F | Elequin Capital Lp | 323 | 3 | ||||||
| 2026-02-13 | 13F | Quinn Opportunity Partners LLC | 638.745 | -7,93 | 6.528 | -24,12 | ||||
| 2026-01-29 | 13F | IMC-Chicago, LLC | 0 | -100,00 | 0 | -100,00 | ||||
| 2025-11-14 | 13F | Wolverine Trading, Llc | Call | 31.700 | 396 | |||||
| 2025-11-14 | 13F | Wolverine Trading, Llc | Put | 12.600 | 158 | |||||
| 2026-02-06 | 13F | Handelsbanken Fonder AB | 21.731 | 0,00 | 0 | |||||
| 2026-02-09 | 13F | Jefferies Financial Group Inc. | 22.286 | 228 | ||||||
| 2026-02-13 | 13F | Macquarie Group Ltd | 0 | -100,00 | 0 | |||||
| 2026-02-17 | 13F | Advisor Group Holdings, Inc. | 241 | -48,06 | 2 | -60,00 | ||||
| 2026-02-06 | 13F | FourThought Financial Partners, LLC | 10.740 | 110 | ||||||
| 2026-01-29 | 13F | Pictet Asset Management Holding SA | 0 | -100,00 | 0 | |||||
| 2026-02-17 | 13F | Dv Equities, Llc | 67.843 | 693 | ||||||
| 2025-11-13 | 13F | Hsbc Holdings Plc | 0 | -100,00 | 0 | -100,00 | ||||
| 2026-02-17 | 13F | Jump Financial, LLC | 295.407 | 261,13 | 3.019 | 197,73 | ||||
| 2026-04-16 | 13F | SG Americas Securities, LLC | 17.110 | -78,90 | 0 | |||||
| 2026-02-02 | 13F | Qrg Capital Management, Inc. | 25.983 | -23,78 | 266 | -37,20 | ||||
| 2026-04-17 | 13F | Bell Investment Advisors, Inc | 549 | -13,27 | 5 | -33,33 | ||||
| 2026-02-09 | 13F | Geode Capital Management, Llc | 57.923 | -67,22 | 592 | -73,03 | ||||
| 2026-02-13 | 13F | Arrowstreet Capital, Limited Partnership | 0 | -100,00 | 0 | |||||
| 2026-02-17 | 13F | Balyasny Asset Management Llc | 147.743 | 144,94 | 1.510 | 102,01 | ||||
| 2026-02-17 | 13F | Tower Research Capital LLC (TRC) | 5.589 | 989,47 | 57 | 850,00 | ||||
| 2026-02-13 | 13F | Wells Fargo & Company/mn | 236 | 0,00 | 2 | 0,00 | ||||
| 2026-01-29 | 13F | UBS Group AG | 1.596.371 | 15,87 | 16.315 | -4,50 | ||||
| 2026-03-12 | 13F | Nalls Sherbakoff Group, Llc | 10 | 0,00 | 0 | |||||
| 2026-02-13 | 13F | National Bank Of Canada /fi/ | 16 | -99,97 | 0 | -100,00 | ||||
| 2025-11-12 | 13F/A | Norges Bank | 1.112.252 | 0,00 | 11.212 | 31,25 | ||||
| 2026-02-13 | 13F | Cornerstone Financial Management LLC | 211 | 2 | ||||||
| 2026-02-10 | 13F | Bnp Paribas | 2.431 | 0,00 | 25 | -20,00 | ||||
| 2026-02-03 | 13F | SBI Securities Co., Ltd. | 1.107 | -38,67 | 11 | -50,00 | ||||
| 2025-11-14 | 13F | Point72 Asset Management, L.P. | 0 | -100,00 | 0 | -100,00 | ||||
| 2026-02-10 | 13F | Daiwa Securities Group Inc. | 6.549 | 12,95 | 0 | |||||
| 2025-11-14 | 13F | Marex Group plc | 0 | -100,00 | 0 | -100,00 | ||||
| 2026-02-09 | 13F | AIA Group Ltd | 31.420 | -72,11 | 321 | -77,01 | ||||
| 2026-02-13 | 13F | Virtus ETF Advisers LLC | 153.831 | -55,48 | 1.572 | -63,31 | ||||
| 2026-01-23 | 13F | Assetmark, Inc | 212 | -44,36 | 2 | -50,00 | ||||
| 2026-02-13 | 13F | Citigroup Inc | 69.500 | -52,88 | 710 | -61,18 | ||||
| 2026-02-13 | 13F | OMERS ADMINISTRATION Corp | 52.930 | 15,05 | 541 | -5,26 | ||||
| 2026-02-13 | 13F | Mariner, LLC | 23.290 | -1,93 | 238 | -19,05 | ||||
| 2026-02-17 | 13F | Saba Capital Management, L.P. | 2.015.063 | 0,00 | 20.594 | -17,58 | ||||
| 2026-01-15 | 13F | Nisa Investment Advisors, Llc | 14 | 0 | ||||||
| 2026-02-10 | 13F | CIBC World Markets Inc. | 34.013 | 0,00 | 348 | -17,58 | ||||
| 2026-02-13 | 13F | Squarepoint Ops LLC | 0 | -100,00 | 0 | |||||
| 2026-02-13 | 13F | First Trust Advisors Lp | 402.584 | 19,02 | 4.114 | -1,91 | ||||
| 2025-11-14 | 13F | Polymer Capital Management (HK) LTD | 0 | -100,00 | 0 | -100,00 | ||||
| 2026-02-10 | 13F | Bnp Paribas Arbitrage, Sa | 8.896 | -90,90 | 91 | -92,57 | ||||
| 2026-02-17 | 13F | Alliancebernstein L.p. | 0 | -100,00 | 0 | |||||
| 2026-02-17 | 13F | Creative Planning | 10.506 | 0,95 | 107 | -17,05 | ||||
| 2026-02-12 | 13F | BlackRock, Inc. | 82.812 | -96,93 | 846 | -97,47 | ||||
| 2026-02-10 | 13F | Envestnet Asset Management Inc | 15.959 | 163 | ||||||
| 2026-02-17 | 13F | Two Sigma Investments, Lp | 42.200 | 431 | ||||||
| 2026-02-17 | 13F | XTX Topco Ltd | 50.548 | 517 | ||||||
| 2026-01-30 | 13F | ARGA Investment Management, LP | 52.156 | 0,00 | 533 | -17,49 | ||||
| 2026-02-09 | 13F | Frazier Financial Advisors, LLC | 0 | -100,00 | 0 | |||||
| 2026-01-27 | 13F | Gf Fund Management Co. Ltd. | 0 | -100,00 | 0 | |||||
| 2026-02-13 | 13F | State Street Corp | 905.002 | -27,47 | 9.249 | -40,22 | ||||
| 2026-02-12 | 13F | Jane Street Group, Llc | Put | 0 | -100,00 | 0 | -100,00 | |||
| 2026-02-03 | 13F | We Are One Seven, LLC | 0 | -100,00 | 0 | -100,00 | ||||
| 2026-02-10 | 13F | Savant Capital, LLC | 0 | -100,00 | 0 | |||||
| 2026-02-06 | 13F | Pnc Financial Services Group, Inc. | 85 | -21,30 | 1 | -100,00 | ||||
| 2026-02-17 | 13F | Voloridge Investment Management, Llc | 481.187 | 51,05 | 4.918 | 24,48 | ||||
| 2026-01-30 | 13F | Glenorchy Capital Ltd | 38.823 | 88,44 | 397 | 55,29 | ||||
| 2026-02-12 | 13F | Hrt Financial Lp | 0 | -100,00 | 0 | |||||
| 2026-04-15 | 13F | Redhawk Wealth Advisors, Inc. | 0 | -100,00 | 0 | |||||
| 2026-02-06 | 13F | Leonteq Securities AG | 94 | 0,00 | 1 | -100,00 | ||||
| 2025-11-13 | 13F | Quadrature Capital Ltd | 0 | -100,00 | 0 | -100,00 | ||||
| 2026-04-21 | 13F | Vise Technologies, Inc. | 20.358 | 0,00 | 208 | 0,00 | ||||
| 2026-02-13 | 13F | Prudential Financial Inc | 475.700 | 21,82 | 4.862 | 0,39 | ||||
| 2025-11-13 | 13F | Mackenzie Financial Corp | 0 | -100,00 | 0 | |||||
| 2026-02-13 | 13F | SRS Capital Advisors, Inc. | 727 | 7 | ||||||
| 2026-02-11 | 13F | O'shaughnessy Asset Management, Llc | 627.978 | 54,09 | 6.418 | 26,99 | ||||
| 2026-02-13 | 13F | Walleye Trading LLC | Call | 269.700 | 11,91 | 2.756 | -7,76 | |||
| 2026-02-13 | 13F | Public Employees Retirement Association Of Colorado | 0 | -100,00 | 0 | |||||
| 2025-11-14 | 13F | Ubs Asset Management Americas Inc | 0 | -100,00 | 0 | |||||
| 2026-02-11 | 13F | Parallel Advisors, LLC | 33 | 0,00 | 0 | |||||
| 2026-02-13 | 13F | Vontobel Holding Ltd. | 16.158 | -7,91 | 165 | -23,96 | ||||
| 2026-02-11 | 13F | Deutsche Bank Ag\ | 1.136 | -92,29 | 12 | -93,96 | ||||
| 2026-02-17 | 13F/A | Cantor Fitzgerald, L. P. | 0 | -100,00 | 0 | -100,00 | ||||
| 2026-04-07 | 13F | Farther Finance Advisors, LLC | 80 | 60,00 | 1 | |||||
| 2026-01-26 | 13F | Mirae Asset Global Investments Co., Ltd. | 3.448 | -0,92 | 35 | -18,60 | ||||
| 2026-02-13 | 13F | Walleye Trading LLC | Put | 15.100 | -19,25 | 154 | -33,33 | |||
| 2026-02-12 | 13F | Quadrant Capital Group Llc | 1.590 | -8,73 | 16 | -23,81 | ||||
| 2026-02-13 | 13F | MAI Capital Management | 19 | 850,00 | 0 | |||||
| 2026-01-20 | 13F | Ascent Group, LLC | 14.442 | 148 | ||||||
| 2026-02-17 | 13F | Public Employees Retirement System Of Ohio | 332.876 | -8,89 | 3.402 | -24,92 | ||||
| 2026-04-07 | 13F | Signaturefd, Llc | 88 | 0,00 | 1 | |||||
| 2026-04-13 | 13F | E Fund Management Co., Ltd. | 347.718 | -2,55 | 3.043 | -10,53 | ||||
| 2026-02-13 | 13F | Gts Securities Llc | 0 | -100,00 | 0 | |||||
| 2026-02-02 | 13F | Wolverine Asset Management Llc | Put | 300 | 3 | |||||
| 2026-02-13 | 13F | Verition Fund Management LLC | 13.497 | 138 | ||||||
| 2026-02-11 | 13F | Simplex Trading, Llc | Call | 156.100 | 16,75 | 1.595 | 159.400,00 | |||
| 2026-02-18 | 13F | Vident Advisory, LLC | 23.632 | 2,48 | 242 | -15,44 | ||||
| 2026-02-12 | 13F | Campbell & CO Investment Adviser LLC | 120.769 | 451,66 | 1.234 | 355,35 | ||||
| 2026-02-13 | 13F | Sei Investments Co | 418.621 | -24,12 | 4.278 | -37,46 | ||||
| 2025-11-14 | 13F | Walleye Capital LLC | Call | 0 | -100,00 | 0 | ||||
| 2026-02-11 | 13F | Simplex Trading, Llc | Put | 96.200 | 14,39 | 983 | 98.200,00 | |||
| 2026-02-12 | 13F | Alibaba Group Holding Ltd | 9.000.000 | 0,00 | 91.980 | -17,58 | ||||
| 2025-11-14 | 13F | Walleye Capital LLC | 0 | -100,00 | 0 | |||||
| 2025-11-07 | 13F | Shell Asset Management Co | 1.515 | -68,21 | 0 | |||||
| 2026-02-17 | 13F | Wellington Management Group Llp | 946.846 | -18,06 | 9.677 | -32,47 | ||||
| 2026-02-17 | 13F | Jones Financial Companies Lllp | 755 | 51,91 | 8 | 16,67 | ||||
| 2026-04-24 | 13F | UMA Financial Services, Inc. | 52 | 0 | ||||||
| 2026-02-17 | 13F | Ameriprise Financial Inc | 17.202 | 5,88 | 176 | -12,94 | ||||
| 2026-02-11 | 13F | Harvest Fund Management Co., Ltd | 74.496 | 0,00 | 1 | |||||
| 2026-02-12 | 13F | Principal Securities, Inc. | 0 | -100,00 | 0 | |||||
| 2026-02-04 | 13F | Abc Arbitrage Sa | 0 | -100,00 | 0 | |||||
| 2026-02-24 | 13F | DGS Capital Management, LLC | 106.768 | 46,13 | 1.091 | 20,55 | ||||
| 2026-02-10 | 13F | Nomura Asset Management Co Ltd | 0 | 0 | ||||||
| 2026-02-13 | 13F | Natixis | 16 | 0,00 | 0 | |||||
| 2026-02-13 | 13F | Morgan Stanley | 365.341 | 15,82 | 3.734 | -4,55 | ||||
| 2026-02-11 | 13F | IMA Wealth, Inc. | 118 | 1 | ||||||
| 2026-02-17 | 13F | Susquehanna International Group, Llp | Put | 1.009.600 | -6,21 | 10.318 | -22,70 | |||
| 2026-02-17 | 13F | Susquehanna International Group, Llp | Call | 155.600 | -37,11 | 1.590 | -48,16 | |||
| 2026-02-13 | 13F | Atlas Capital Advisors Llc | 15.768 | 21,01 | 161 | 29,84 | ||||
| 2026-02-17 | 13F | Susquehanna International Group, Llp | 583.893 | 19,80 | 5.967 | -1,26 | ||||
| 2026-02-13 | 13F | Rhumbline Advisers | 986 | 0,00 | 10 | -16,67 | ||||
| 2025-11-12 | 13F | Fox Run Management, L.l.c. | 0 | -100,00 | 0 | -100,00 | ||||
| 2026-02-11 | 13F | Resolute Advisors LLC | 52.000 | 0,00 | 531 | -17,55 | ||||
| 2026-02-17 | 13F | Northern Trust Corp | 166.515 | -0,92 | 1.702 | -18,34 | ||||
| 2026-02-04 | 13F | D'Orazio & Associates, Inc. | 19.131 | -20,20 | 196 | -34,34 | ||||
| 2026-02-17 | 13F | Bank Of America Corp /de/ | 24.198 | -96,90 | 247 | -97,45 | ||||
| 2026-02-12 | 13F | Federation des caisses Desjardins du Quebec | 400 | 0,00 | 4 | 0,00 | ||||
| 2026-01-30 | 13F | Mitsubishi UFJ Trust & Banking Corp | 229.951 | 1,08 | 2.350 | -16,67 | ||||
| 2025-11-12 | 13F | NewSquare Capital LLC | 0 | -100,00 | 0 | |||||
| 2026-02-11 | 13F | Group One Trading, L.p. | Put | 422.900 | -13,52 | 4.322 | -28,72 | |||
| 2026-02-10 | 13F/A | Northwestern Mutual Wealth Management Co | 1 | 0,00 | 0 | |||||
| 2026-02-11 | 13F | Group One Trading, L.p. | Call | 204.000 | -24,02 | 2.085 | -37,40 | |||
| 2026-02-13 | 13F | JustInvest LLC | 30.207 | 21,38 | 309 | 0,00 | ||||
| 2026-02-12 | 13F | Nuveen, LLC | 0 | -100,00 | 0 | |||||
| 2026-02-12 | 13F | Skopos Labs, Inc. | 18.386 | 187 | ||||||
| 2026-02-13 | 13F | Causeway Capital Management Llc | 2.992.234 | 1,35 | 30.581 | -16,46 | ||||
| 2026-02-13 | 13F | Smartleaf Asset Management LLC | 223 | 2 | ||||||
| 2025-11-12 | 13F | Group One Trading, L.p. | 0 | -100,00 | 0 | -100,00 | ||||
| 2026-02-17 | 13F | Engineers Gate Manager LP | 17.184 | 176 | ||||||
| 2026-02-17 | 13F | D. E. Shaw & Co., Inc. | 660.244 | 5,12 | 6.748 | -13,37 | ||||
| 2026-04-08 | 13F | Wealth Enhancement Advisory Services, Llc | 15.085 | -56,99 | 131 | -65,24 |