Grundlæggende statistik
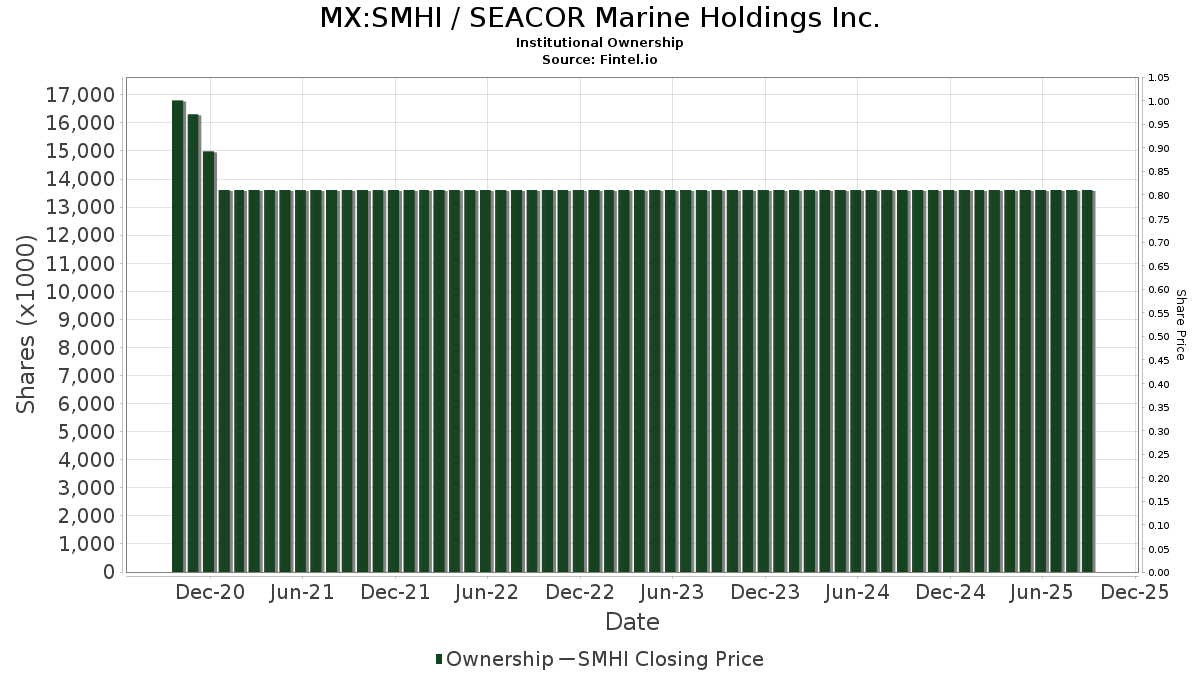
| Institutionelle aktier (lange) | 11.259.446 - 48,05% (ex 13D/G) - change of -2,90MM shares -17,57% MRQ |
| Institutionel værdi (lang) | $ 67.426 USD ($1000) |
Institutionelt ejerskab og aktionærer
SEACOR Marine Holdings Inc. (MX:SMHI) har 82 institutionelle ejere og aktionærer, der har indsendt 13D/G- eller 13F-formularer til Securities Exchange Commission (SEC). Disse institutioner har i alt 11,259,446 aktier. Største aktionærer omfatter BlackRock, Inc., Dimensional Fund Advisors Lp, Vanguard Group Inc, First Eagle Investment Management, LLC, Robotti Robert, Oppenheimer & Close, LLC, State Street Corp, Geode Capital Management, Llc, Cerity Partners LLC, and First Manhattan Co .
SEACOR Marine Holdings Inc. (BMV:SMHI) institutionel ejerskabsstruktur viser aktuelle positioner i virksomheden efter institutioner og fonde, samt seneste ændringer i positionsstørrelse. Større aktionærer kan omfatte individuelle investorer, investeringsforeninger, hedgefonde eller institutioner. Skema 13D angiver, at investoren besidder (eller besidder) mere end 5 % af virksomheden og har til hensigt (eller har til hensigt at) aktivt at forfølge en ændring i forretningsstrategi. Skema 13G indikerer en passiv investering på over 5%.
Fondens stemningsscore
Fund Sentiment Score (fka Ownership Accumulation Score) finder de aktier, der bliver mest købt af fonde. Det er resultatet af en sofistikeret, multi-faktor kvantitativ model, der identificerer virksomheder med de højeste niveauer af institutionel akkumulering. Scoringsmodellen bruger en kombination af den samlede stigning i oplyste ejere, ændringerne i porteføljeallokeringer i disse ejere og andre målinger. Tallet går fra 0 til 100, hvor højere tal indikerer et højere niveau af akkumulering for sine jævnaldrende, og 50 er gennemsnittet.
Opdateringsfrekvens: Dagligt
Se Ownership Explorer, som giver en liste over højest rangerende virksomheder.
AI+ Ask Fintel’s AI assistant about SEACOR Marine Holdings Inc..
Select a question to share a public post with an AI-crafted answer.
Thinking of good questions…
13F og NPORT arkivering
Detaljer om 13F-arkivering er gratis. Detaljer om NP-ansøgninger kræver et premium-medlemskab. Grønne rækker angiver nye positioner. Røde rækker angiver lukkede positioner. Klik på linket ikon for at se den fulde transaktionshistorik.
Opgrader
for at låse premium-data op og eksportere til Excel ![]() .
.
| Fil dato | Kilde | Investor | Type | Gennemsnitlig pris (Øst) |
Aktier | Δ Aktier (%) |
Rapporteret Værdi ($1000) |
Δ Værdi (%) |
Port Alloc (%) |
|
|---|---|---|---|---|---|---|---|---|---|---|
| 2026-01-30 | 13F | Levin Capital Strategies, L.p. | 10.000 | -41,18 | 60 | -45,45 | ||||
| 2026-02-12 | 13F | Renaissance Technologies Llc | 118.300 | -33,73 | 712 | -38,51 | ||||
| 2026-01-29 | 13F | UBS Group AG | 10.206 | -44,77 | 61 | -48,74 | ||||
| 2026-02-17 | 13F | Millennium Management Llc | 0 | -100,00 | 0 | |||||
| 2026-02-17 | 13F | D. E. Shaw & Co., Inc. | 55.520 | 75,43 | 334 | 62,93 | ||||
| 2026-01-12 | 13F | Perennial Advisors, LLC | 46.038 | 0,00 | 277 | -7,05 | ||||
| 2026-01-05 | 13F | GAMMA Investing LLC | 247 | -49,59 | 1 | -66,67 | ||||
| 2026-02-13 | 13F | Barclays Plc | 58.185 | 19,42 | 350 | -25,53 | ||||
| 2025-11-14 | 13F | Citadel Advisors Llc | Call | 0 | -100,00 | 0 | ||||
| 2026-02-17 | 13F | Northern Trust Corp | 182.973 | -5,11 | 1.101 | -11,99 | ||||
| 2026-02-12 | 13F | Hrt Financial Lp | 0 | -100,00 | 0 | |||||
| 2026-02-17 | 13F | Wellington Management Group Llp | 21.045 | 0,00 | 127 | -7,35 | ||||
| 2026-02-11 | 13F | Cerity Partners LLC | 435.071 | 0,13 | 2.619 | -7,13 | ||||
| 2026-02-13 | 13F | MAI Capital Management | 0 | -100,00 | 0 | |||||
| 2026-02-13 | 13F | Pathstone Holdings, LLC | 10.825 | -1,97 | 65 | -8,45 | ||||
| 2026-02-17 | 13F | Raymond James Financial Inc | 0 | -100,00 | 0 | |||||
| 2026-02-17 | 13F | California State Teachers Retirement System | 1.342 | -24,10 | 8 | -27,27 | ||||
| 2026-02-03 | 13F | SBI Securities Co., Ltd. | 152 | -0,65 | 1 | |||||
| 2026-02-17 | 13F | Advisor Group Holdings, Inc. | 292 | 0,00 | 2 | 0,00 | ||||
| 2026-01-08 | 13F | True Wealth Design, LLC | 20 | 0,00 | 0 | |||||
| 2026-02-17 | 13F | Trexquant Investment LP | 0 | -100,00 | 0 | |||||
| 2025-10-24 | 13F | Avion Wealth | 0 | -100,00 | 0 | |||||
| 2026-02-10 | 13F | Intech Investment Management Llc | 0 | -100,00 | 0 | |||||
| 2026-02-17 | 13F | Susquehanna International Group, Llp | 0 | -100,00 | 0 | |||||
| 2026-02-10 | 13F | Bank of New York Mellon Corp | 49.616 | -6,90 | 299 | -13,62 | ||||
| 2026-02-06 | 13F | Gsa Capital Partners Llp | 35.655 | -22,85 | 0 | |||||
| 2026-02-17 | 13F | Optiver Holding B.V. | 394 | 0,00 | 2 | 0,00 | ||||
| 2026-02-13 | 13F | American Century Companies Inc | 48.032 | -1,79 | 289 | -8,83 | ||||
| 2026-02-10 | 13F | Bnp Paribas Arbitrage, Sa | 4.803 | 21,23 | 29 | 12,00 | ||||
| 2026-02-12 | 13F | Nuveen, LLC | 69.714 | 0,00 | 420 | -7,30 | ||||
| 2026-02-17 | 13F | Fmr Llc | 9.985 | 90,84 | 60 | 81,82 | ||||
| 2026-02-13 | 13F | Parkside Financial Bank & Trust | 175 | 0,00 | 1 | 0,00 | ||||
| 2026-02-17 | 13F | Semper Augustus Investments Group Llc | 208.175 | -1,56 | 1.253 | -8,67 | ||||
| 2026-01-26 | 13F | Cwm, Llc | 494 | -3,70 | 0 | |||||
| 2026-02-12 | 13F | Jane Street Group, Llc | 44.958 | -34,14 | 271 | -38,91 | ||||
| 2026-03-06 | 13F | Hsbc Holdings Plc | 13.538 | -34,57 | 81 | -39,39 | ||||
| 2026-02-13 | 13F | State Street Corp | 533.427 | 0,23 | 3.211 | -7,04 | ||||
| 2026-02-13 | 13F | Neuberger Berman Group LLC | 16.420 | 4,78 | 99 | -2,97 | ||||
| 2026-02-13 | 13F | Charles Schwab Investment Management Inc | 61.451 | -0,01 | 370 | -7,29 | ||||
| 2026-02-13 | 13F | Morgan Stanley | 247.775 | -11,75 | 1.492 | -18,17 | ||||
| 2026-02-05 | 13F | Stephens Inc /ar/ | 23.536 | 0,00 | 142 | -7,24 | ||||
| 2026-02-13 | 13F | Police & Firemen's Retirement System of New Jersey | 4.890 | 0,00 | 29 | -6,45 | ||||
| 2026-02-10 | 13F | Oppenheimer & Close, LLC | 553.833 | 0,53 | 3.334 | -6,74 | ||||
| 2026-02-12 | 13F | BRYN MAWR TRUST Co | 38.567 | 0,00 | 232 | -7,20 | ||||
| 2026-02-13 | 13F | Cornerstone Financial Management LLC | 110 | 1 | ||||||
| 2026-01-15 | 13F | Nisa Investment Advisors, Llc | 1.006 | -4,82 | 6 | 0,00 | ||||
| 2026-01-26 | 13F | Whittier Trust Co | 0 | -100,00 | 0 | |||||
| 2026-02-02 | 13F | Oppenheimer & Co Inc | 220.500 | 6,27 | 1.327 | -1,41 | ||||
| 2025-12-02 | 13F | IFP Advisors, Inc | 0 | 1 | -100,00 | |||||
| 2026-02-17 | 13F | Bridgeway Capital Management Inc | 78.070 | 0,00 | 470 | -7,31 | ||||
| 2026-02-13 | 13F | Citigroup Inc | 1.587 | -16,21 | 10 | -25,00 | ||||
| 2026-02-13 | 13F | Sterling Capital Management LLC | 1.259 | -11,21 | 8 | -22,22 | ||||
| 2026-02-12 | 13F | New York State Common Retirement Fund | 19.903 | 0,00 | 120 | -7,75 | ||||
| 2026-02-12 | 13F | Cloud Capital Management, LLC | 0 | -100,00 | 0 | |||||
| 2026-01-23 | 13F | Private Wealth Management Group, LLC | 208 | 0,00 | 1 | 0,00 | ||||
| 2026-02-10 | 13F | Acadian Asset Management Llc | 3.497 | 0 | ||||||
| 2026-02-12 | 13F | MetLife Investment Management, LLC | 0 | -100,00 | 0 | |||||
| 2025-11-05 | 13F | Bessemer Group Inc | 0 | -100,00 | 0 | |||||
| 2026-02-09 | 13F | Legal & General Group Plc | 1.890 | 0,00 | 11 | -8,33 | ||||
| 2026-02-17 | 13F | First Manhattan Co | 378.745 | -5,43 | 2.280 | -12,27 | ||||
| 2026-02-13 | 13F | Royal London Asset Management Ltd | 1.550 | 0,00 | 9 | -10,00 | ||||
| 2026-02-05 | 13F | Amalgamated Bank | 686 | -15,52 | 0 | |||||
| 2026-01-30 | 13F | Glenorchy Capital Ltd | 192.803 | 4,30 | 1.161 | -3,25 | ||||
| 2026-02-12 | 13F | Dimensional Fund Advisors Lp | 1.284.004 | -5,54 | 7.730 | -12,38 | ||||
| 2025-11-14 | 13F | Wolverine Trading, Llc | Call | 12.400 | 81 | |||||
| 2026-01-29 | 13F | Vanguard Group Inc | 1.274.560 | 3,20 | 7.673 | -4,28 | ||||
| 2026-02-18 | 13F | GWM Advisors LLC | 127 | -95,77 | 1 | -100,00 | ||||
| 2026-02-11 | 13F | Simplex Trading, Llc | Put | 5.000 | 0,00 | 30 | ||||
| 2026-02-13 | 13F | SRS Capital Advisors, Inc. | 0 | -100,00 | 0 | |||||
| 2026-02-11 | 13F | Simplex Trading, Llc | 814 | -92,14 | 5 | |||||
| 2026-02-12 | 13F | Barington Capital Group, L.p. | 0 | -100,00 | 0 | |||||
| 2026-02-17 | 13F | Citadel Advisors Llc | 45.383 | 273 | ||||||
| 2026-01-14 | 13F | ORG Partners LLC | 600 | 0,00 | 4 | 0,00 | ||||
| 2026-02-17 | 13F | Price T Rowe Associates Inc /md/ | 12.764 | 0,00 | 0 | |||||
| 2026-02-11 | 13F | Jpmorgan Chase & Co | 170.080 | -0,76 | 1.024 | -8,00 | ||||
| 2026-02-23 | 13F | Mv Capital Management, Inc. | 1.131 | 0,00 | 7 | 20,00 | ||||
| 2026-02-17 | 13F | Alliancebernstein L.p. | 17.890 | 0,00 | 108 | -7,76 | ||||
| 2026-02-04 | 13F | First Eagle Investment Management, LLC | 1.111.167 | -2,12 | 6.689 | -9,20 | ||||
| 2026-02-13 | 13F | Transamerica Financial Advisors, Inc. | 0 | -100,00 | 0 | |||||
| 2026-02-13 | 13F | Wells Fargo & Company/mn | 24.486 | 55,44 | 147 | 44,12 | ||||
| 2026-02-17 | 13F | Russell Investments Group, Ltd. | 1.768 | 0,00 | 11 | -9,09 | ||||
| 2026-02-11 | 13F | Deutsche Bank Ag\ | 13.512 | -55,95 | 81 | -59,30 | ||||
| 2026-02-19 | 13F | Invesco Ltd. | 29.591 | -23,71 | 178 | -29,08 | ||||
| 2026-02-06 | 13F | Pnc Financial Services Group, Inc. | 1.871 | -66,07 | 11 | -68,57 | ||||
| 2026-02-12 | 13F | Callan Family Office, LLC | 10.307 | 62 | ||||||
| 2026-02-12 | 13F | Steward Partners Investment Advisory, Llc | 0 | -100,00 | 0 | |||||
| 2026-02-12 | 13F | Robotti Robert | 842.946 | 0,12 | 5.075 | -7,14 | ||||
| 2026-02-11 | 13F | Empowered Funds, LLC | 42.670 | 0,00 | 257 | -7,25 | ||||
| 2026-02-17 | 13F | Epacria Capital Partners, Llc | 155.230 | 0,00 | 934 | -7,25 | ||||
| 2026-02-17 | 13F | MIRAE ASSET GLOBAL ETFS HOLDINGS Ltd. | 9.948 | 3,20 | 60 | -4,84 | ||||
| 2026-02-17 | 13F | Bank Of America Corp /de/ | 60.601 | -6,00 | 365 | -12,92 | ||||
| 2026-02-12 | 13F | BlackRock, Inc. | 1.560.780 | 1,24 | 9.396 | -6,10 | ||||
| 2026-02-10 | 13F | Goldman Sachs Group Inc | 110.479 | 12,23 | 665 | 4,23 | ||||
| 2026-01-30 | 13F | Us Bancorp \de\ | 0 | -100,00 | 0 | |||||
| 2026-02-04 | 13F | Valeo Financial Advisors, LLC | 10.000 | 60 | ||||||
| 2026-02-09 | 13F | Geode Capital Management, Llc | 485.730 | 1,06 | 2.925 | -6,25 | ||||
| 2026-02-11 | 13F | Group One Trading, L.p. | 435 | 0,00 | 3 | 0,00 | ||||
| 2026-02-13 | 13F | Rhumbline Advisers | 29.005 | -12,88 | 175 | -19,44 | ||||
| 2026-02-17 | 13F | Tower Research Capital LLC (TRC) | 1.863 | -15,62 | 11 | -21,43 | ||||
| 2026-02-11 | 13F | Ameritas Investment Partners, Inc. | 1.989 | 12 | ||||||
| 2026-02-17 | 13F | Royal Bank Of Canada | 649 | -98,62 | 4 | -98,69 | ||||
| 2026-02-06 | 13F | HighTower Advisors, LLC | 129.598 | 0,00 | 780 | -7,25 |