Grundlæggende statistik
| Institutionelle ejere | 181 total, 177 long only, 0 short only, 4 long/short - change of 2,14% MRQ |
| Gennemsnitlig porteføljeallokering | 0.3079 % - change of 33,05% MRQ |
| Institutionelle aktier (lange) | 313.801.500 (ex 13D/G) - change of 2,70MM shares 0,70% MRQ |
| Institutionel værdi (lang) | $ 1.145.908 USD ($1000) |
Institutionelt ejerskab og aktionærer
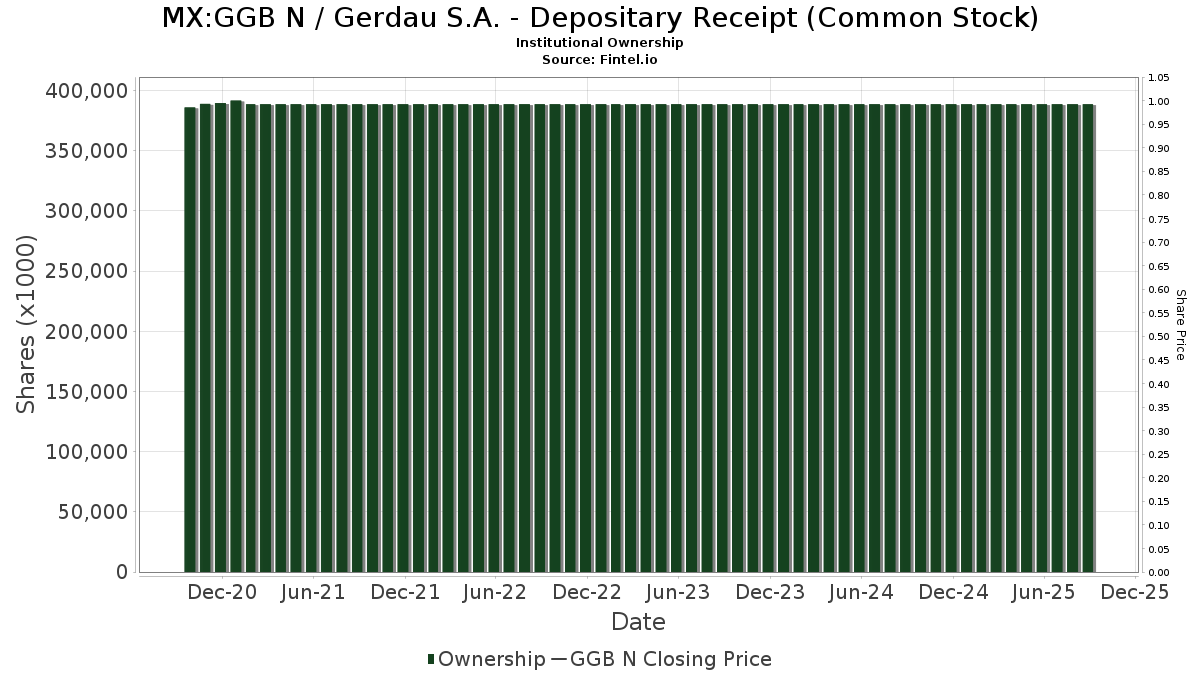
Gerdau S.A. - Depositary Receipt (Common Stock) (MX:GGB N) har 181 institutionelle ejere og aktionærer, der har indsendt 13D/G- eller 13F-formularer til Securities Exchange Commission (SEC). Disse institutioner har i alt 313,801,500 aktier. Største aktionærer omfatter Fmr Llc, Capital International Investors, Donald Smith & Co., Inc., Aquamarine Financial (Cayman) Ltd, Contrarian Capital Management, L.l.c., Dimensional Fund Advisors Lp, Itau Unibanco Holding S.A., Causeway Capital Management Llc, BlackRock, Inc., and Renaissance Technologies Llc .
Gerdau S.A. - Depositary Receipt (Common Stock) (BMV:GGB N) institutionel ejerskabsstruktur viser aktuelle positioner i virksomheden efter institutioner og fonde, samt seneste ændringer i positionsstørrelse. Større aktionærer kan omfatte individuelle investorer, investeringsforeninger, hedgefonde eller institutioner. Skema 13D angiver, at investoren besidder (eller besidder) mere end 5 % af virksomheden og har til hensigt (eller har til hensigt at) aktivt at forfølge en ændring i forretningsstrategi. Skema 13G indikerer en passiv investering på over 5%.
Fondens stemningsscore
Fund Sentiment Score (fka Ownership Accumulation Score) finder de aktier, der bliver mest købt af fonde. Det er resultatet af en sofistikeret, multi-faktor kvantitativ model, der identificerer virksomheder med de højeste niveauer af institutionel akkumulering. Scoringsmodellen bruger en kombination af den samlede stigning i oplyste ejere, ændringerne i porteføljeallokeringer i disse ejere og andre målinger. Tallet går fra 0 til 100, hvor højere tal indikerer et højere niveau af akkumulering for sine jævnaldrende, og 50 er gennemsnittet.
Opdateringsfrekvens: Dagligt
Se Ownership Explorer, som giver en liste over højest rangerende virksomheder.
AI+ Ask Fintel’s AI assistant about Gerdau S.A. - Depositary Receipt (Common Stock).
Select a question to share a public post with an AI-crafted answer.
Thinking of good questions…
13F og NPORT arkivering
Detaljer om 13F-arkivering er gratis. Detaljer om NP-ansøgninger kræver et premium-medlemskab. Grønne rækker angiver nye positioner. Røde rækker angiver lukkede positioner. Klik på linket ikon for at se den fulde transaktionshistorik.
Opgrader
for at låse premium-data op og eksportere til Excel ![]() .
.
| Fil dato | Kilde | Investor | Type | Gennemsnitlig pris (Øst) |
Aktier | Δ Aktier (%) |
Rapporteret Værdi ($1000) |
Δ Værdi (%) |
Port Alloc (%) |
|
|---|---|---|---|---|---|---|---|---|---|---|
| 2025-12-02 | 13F | IFP Advisors, Inc | 0 | 0 | ||||||
| 2026-02-13 | 13F | Flow Traders U.s. Llc | 65.056 | 0 | ||||||
| 2026-02-17 | 13F | Amundi | 1.359.223 | 3,03 | 5.016 | 16,63 | ||||
| 2026-02-12 | 13F | BlackRock, Inc. | 7.067.528 | 0,92 | 26.079 | 20,13 | ||||
| 2026-02-06 | 13F | Gsa Capital Partners Llp | 140.640 | -55,55 | 1 | |||||
| 2026-04-21 | 13F | PharVision Advisers, LLC | 0 | -100,00 | 0 | |||||
| 2026-02-23 | 13F | Virtu Financial LLC | 119.006 | -71,96 | 0 | -100,00 | ||||
| 2026-02-06 | 13F | Plan A Wealth LLC | 17.944 | 12,88 | 66 | 34,69 | ||||
| 2026-02-13 | 13F | Marshall Wace, Llp | 0 | -100,00 | 0 | |||||
| 2025-11-14 | 13F | AXA Investment Managers S.A. | 1.024.392 | 3.176 | ||||||
| 2026-02-03 | 13F | Virtus Family Office LLC | 574.870 | -0,03 | 2.121 | 19,02 | ||||
| 2026-02-13 | 13F | Johnson Investment Counsel Inc | 0 | -100,00 | 0 | |||||
| 2025-11-13 | 13F | Employees Retirement System of Texas | 0 | -100,00 | 0 | |||||
| 2026-02-13 | 13F | Ubs Asset Management Americas Inc | 134.021 | -93,27 | 495 | -91,99 | ||||
| 2026-02-17 | 13F | Susquehanna International Group, Llp | Call | 18.500 | 68 | |||||
| 2026-02-17 | 13F | Citadel Advisors Llc | 6.067.900 | 202,18 | 22.391 | 259,74 | ||||
| 2026-02-17 | 13F | Susquehanna International Group, Llp | 298.309 | -61,17 | 1.101 | -53,80 | ||||
| 2026-02-17 | 13F | Susquehanna International Group, Llp | Put | 10.400 | 38 | |||||
| 2026-02-10 | 13F | Quantbot Technologies LP | 269.554 | -30,96 | 995 | -17,85 | ||||
| 2025-11-14 | 13F | Axa S.a. | 0 | -100,00 | 0 | -100,00 | ||||
| 2026-01-26 | 13F | Cwm, Llc | 237 | 0,00 | 0 | |||||
| 2026-04-13 | 13F | True Wealth Design, LLC | 80 | 0,00 | 0 | |||||
| 2026-02-12 | 13F | Hrt Financial Lp | 0 | -100,00 | 0 | |||||
| 2026-04-23 | 13F | North Star Investment Management Corp. | 2.650 | 5,16 | 10 | 0,00 | ||||
| 2026-02-13 | 13F | BNP Paribas Asset Management Holding S.A. | 1.024.392 | 4 | ||||||
| 2026-03-06 | 13F | Hsbc Holdings Plc | 822.772 | 3,42 | 3.036 | 23,11 | ||||
| 2026-04-16 | 13F | SG Americas Securities, LLC | 30.300 | 0 | ||||||
| 2026-02-13 | 13F | Causeway Capital Management Llc | 7.259.433 | 0,98 | 26.787 | 20,20 | ||||
| 2026-02-11 | 13F | Capital International Sarl | 934.528 | -1,84 | 3.448 | 16,84 | ||||
| 2026-02-17 | 13F | Hartree Partners, LP | 0 | -100,00 | 0 | |||||
| 2026-02-17 | 13F | Magnetar Financial LLC | 34.114 | 126 | ||||||
| 2026-02-12 | 13F | Ci Investments Inc. | 317.443 | 0,00 | 1.171 | |||||
| 2026-02-03 | 13F/A | Mount Yale Investment Advisors, LLC | 0 | -100,00 | 0 | |||||
| 2026-02-17 | 13F | Grantham, Mayo, Van Otterloo & Co. LLC | 586.191 | -8,60 | 2.163 | 8,80 | ||||
| 2026-01-30 | 13F | Bogart Wealth, LLC | 344 | 1 | ||||||
| 2026-02-13 | 13F | Citigroup Inc | 105.671 | -5,02 | 390 | 13,08 | ||||
| 2026-02-17 | 13F | D. E. Shaw & Co., Inc. | 1.615.446 | -48,98 | 5.961 | -39,28 | ||||
| 2026-02-13 | 13F | Brooklands Fund Management Ltd | Call | 0 | -100,00 | 0 | ||||
| 2026-04-06 | 13F | GAMMA Investing LLC | 2.932 | 9,20 | 11 | 11,11 | ||||
| 2026-02-13 | 13F | Kcm Investment Advisors Llc | 14.576 | 0,00 | 54 | 17,78 | ||||
| 2026-02-02 | 13F | Truist Financial Corp | 103.153 | 0,65 | 381 | 19,87 | ||||
| 2026-02-11 | 13F | Capital International Inc /ca/ | 210.637 | -2,56 | 777 | 15,97 | ||||
| 2026-02-09 | 13F | Hantz Financial Services, Inc. | 261 | 0 | ||||||
| 2026-02-12 | 13F | Quadrant Capital Group Llc | 46.894 | 0,00 | 173 | 19,31 | ||||
| 2026-02-13 | 13F | Mml Investors Services, Llc | 12.374 | 23,38 | 46 | 45,16 | ||||
| 2026-02-11 | 13F | Simplex Trading, Llc | Put | 100 | -95,24 | 0 | ||||
| 2026-02-04 | 13F | Money Concepts Capital Corp | 38.430 | 0,00 | 142 | 18,49 | ||||
| 2026-02-11 | 13F | Simplex Trading, Llc | 1.254 | -76,16 | 5 | |||||
| 2026-02-17 | 13F | FIL Ltd | 2.544.394 | -16,37 | 9.389 | -0,46 | ||||
| 2025-11-14 | 13F | Credit Agricole S A | 0 | -100,00 | 0 | |||||
| 2026-02-11 | 13F | Franklin Resources Inc | 14.666 | 0,36 | 54 | 20,00 | ||||
| 2026-02-12 | 13F | Xponance, Inc. | 20.570 | 16,05 | 76 | 38,89 | ||||
| 2026-02-17 | 13F | Mercer Global Advisors Inc /adv | 11.890 | -24,49 | 44 | -10,42 | ||||
| 2026-02-17 | 13F | Tower Research Capital LLC (TRC) | 1.054 | -32,69 | 4 | -25,00 | ||||
| 2026-02-17 | 13F | Quadrature Capital Ltd | 784.361 | 2.894 | ||||||
| 2026-02-06 | 13F | Profund Advisors Llc | 33.635 | 29,41 | 124 | 55,00 | ||||
| 2026-02-04 | 13F | Argos Wealth Advisors, LLC | 14.757 | 54 | ||||||
| 2025-11-13 | 13F | Tradition Wealth Management, LLC | 0 | -100,00 | 0 | |||||
| 2026-02-19 | 13F | Invesco Ltd. | 286.302 | 5,20 | 1.056 | 25,27 | ||||
| 2026-02-03 | 13F | Crossmark Global Holdings, Inc. | 74.784 | 0,00 | 276 | 19,05 | ||||
| 2026-02-13 | 13F | Ieq Capital, Llc | 11.116 | -3,27 | 41 | 17,14 | ||||
| 2026-02-06 | 13F | EverSource Wealth Advisors, LLC | 8.401 | -12,39 | 31 | 3,45 | ||||
| 2026-02-03 | 13F | We Are One Seven, LLC | 11.532 | 10,43 | 43 | 31,25 | ||||
| 2025-11-10 | 13F | Pekin Hardy Strauss, Inc. | 0 | -100,00 | 0 | -100,00 | ||||
| 2026-02-09 | 13F | MQS Management LLC | 0 | -100,00 | 0 | |||||
| 2026-04-20 | 13F | Banque Cantonale Vaudoise | 800.000 | 0,00 | 2.888 | -2,17 | ||||
| 2026-02-17 | 13F | Engineers Gate Manager LP | 47.879 | -97,06 | 177 | -96,51 | ||||
| 2026-02-10 | 13F | Ritter Daniher Financial Advisory LLC / DE | 2.135 | 8 | ||||||
| 2025-11-14 | 13F | Wolverine Trading, Llc | Call | 20.100 | 63 | |||||
| 2026-02-11 | 13F | Capital International Investors | 27.415.434 | -11,69 | 101.163 | 5,11 | ||||
| 2026-02-09 | 13F | Coldstream Capital Management Inc | 11.970 | 0,00 | 44 | 18,92 | ||||
| 2026-02-10 | 13F | Acadian Asset Management Llc | 598.087 | 221,96 | 2 | |||||
| 2026-02-13 | 13F | Pinnacle Wealth Planning Services, Inc. | 9.232 | 34 | ||||||
| 2026-04-24 | 13F | Strs Ohio | 191.830 | -13,21 | 693 | -15,09 | ||||
| 2026-01-14 | 13F | Hennion & Walsh Asset Management, Inc. | 0 | -100,00 | 0 | -100,00 | ||||
| 2026-02-12 | 13F | Marex Group plc | 43.843 | -57,47 | 162 | -49,53 | ||||
| 2026-02-13 | 13F | American Century Companies Inc | 5.424.093 | 12,51 | 20.015 | 33,92 | ||||
| 2026-02-13 | 13F | Itau Unibanco Holding S.A. | 8.744.732 | -12,17 | 32.295 | 4,63 | ||||
| 2026-02-10 | 13F | Daiwa Securities Group Inc. | 97.536 | -34,77 | 0 | |||||
| 2026-02-17 | 13F | Aquatic Capital Management LLC | 1.028.902 | 49,67 | 3.797 | 78,13 | ||||
| 2026-02-17 | 13F | Raymond James Financial Inc | 22.244 | 0,00 | 82 | 20,59 | ||||
| 2026-02-10 | 13F | Zhang Financial LLC | 11.695 | 0,00 | 43 | 19,44 | ||||
| 2025-11-10 | 13F | MAI Capital Management | 0 | -100,00 | 0 | -100,00 | ||||
| 2026-02-13 | 13F | Integrated Wealth Concepts LLC | 104.415 | 11,04 | 385 | 32,30 | ||||
| 2026-02-05 | 13F | Tucker Asset Management Llc | 378 | 1 | ||||||
| 2026-02-06 | 13F | Pnc Financial Services Group, Inc. | 31.219 | -9,52 | 115 | 8,49 | ||||
| 2026-02-13 | 13F | JustInvest LLC | 48.279 | 5,69 | 178 | 26,24 | ||||
| 2026-02-12 | 13F | Commonwealth Equity Services, Llc | 285.259 | 1,65 | 1.053 | |||||
| 2026-02-13 | 13F | Contrarian Capital Management, L.l.c. | 19.069.112 | 0,00 | 70.365 | 19,03 | ||||
| 2026-04-20 | 13F | Jfs Wealth Advisors, Llc | 273 | 0,00 | 1 | -100,00 | ||||
| 2026-03-26 | 13F | Leonteq Securities AG | Put | 0 | -100,00 | 0 | ||||
| 2026-02-03 | 13F | Ballentine Partners, LLC | 26.578 | 41,46 | 98 | 68,97 | ||||
| 2026-04-16 | 13F | Diversified Trust Co | 105.249 | 380 | ||||||
| 2026-02-14 | 13F | Rockefeller Capital Management L.P. | 1.185 | -42,17 | 4 | -33,33 | ||||
| 2026-04-20 | 13F | Sowell Financial Services LLC | 33.377 | 0,00 | 120 | -2,44 | ||||
| 2025-10-27 | 13F | First Horizon Corp | 0 | -100,00 | 0 | |||||
| 2026-02-13 | 13F | Morgan Stanley | 5.802.585 | -13,23 | 21.412 | 3,29 | ||||
| 2026-02-12 | 13F | Principal Securities, Inc. | 0 | -100,00 | 0 | |||||
| 2026-02-17 | 13F | Optiver Holding B.V. | 2.530.923 | -53,44 | 9.339 | -44,57 | ||||
| 2026-02-17 | 13F | Russell Investments Group, Ltd. | 869.699 | 3.235 | ||||||
| 2025-11-04 | 13F | Jones Financial Companies Lllp | 0 | -100,00 | 0 | |||||
| 2026-04-07 | 13F | Farther Finance Advisors, LLC | 1.511 | 7,62 | 6 | 0,00 | ||||
| 2026-02-12 | 13F | Brown Brothers Harriman & Co | 818 | 3 | ||||||
| 2026-02-17 | 13F | Two Sigma Securities, Llc | 17.447 | 72,67 | 64 | 106,45 | ||||
| 2026-02-11 | 13F | Cerity Partners LLC | 35.990 | 22,51 | 133 | 45,05 | ||||
| 2026-02-12 | 13F | CoreCommodity Management, LLC | 48.408 | 0,00 | 179 | 18,67 | ||||
| 2026-02-10 | 13F | Eurizon Capital SGR S.p.A. | 2.893 | 11 | ||||||
| 2026-02-13 | 13F | State Street Corp | 3.531.028 | 5,70 | 13.029 | 25,82 | ||||
| 2026-01-26 | 13F | Mirae Asset Global Investments Co., Ltd. | 70.202 | 1,36 | 259 | 21,03 | ||||
| 2026-02-17 | 13F | Jump Financial, LLC | 2.005.343 | 7.400 | ||||||
| 2026-04-13 | 13F | Fractal Investments LLC | 33.264 | 0,00 | 120 | -1,64 | ||||
| 2026-04-21 | 13F | SmartHarvest Portfolios, LLC | 11.996 | 43 | ||||||
| 2026-02-17 | 13F | Dark Forest Capital Management Lp | 0 | -100,00 | 0 | |||||
| 2026-04-23 | 13F | CWM Advisors, LLC | 22.578 | -14,47 | 82 | -16,49 | ||||
| 2026-01-30 | 13F | Us Bancorp \de\ | 9.401 | 0,00 | 35 | 17,24 | ||||
| 2026-02-19 | 13F | CI Private Wealth, LLC | 28.394 | -0,64 | 104 | 17,05 | ||||
| 2026-02-17 | 13F | United Capital Financial Advisers, Llc | 11.792 | 44 | ||||||
| 2026-01-27 | 13F | WealthCollab, LLC | 1.035 | 0,00 | 4 | 0,00 | ||||
| 2026-02-10 | 13F | Connor, Clark & Lunn Investment Management Ltd. | 719.207 | -15,55 | 2.654 | 0,49 | ||||
| 2026-04-24 | 13F | Root Financial Partners, LLC | 30 | 0 | ||||||
| 2026-02-17 | 13F | Creative Planning | 263.111 | 76,99 | 971 | 110,87 | ||||
| 2026-01-30 | 13F | Mitsubishi UFJ Trust & Banking Corp | 26.455 | -8,32 | 98 | 8,99 | ||||
| 2026-02-17 | 13F | Ancora Advisors, LLC | 65 | 0 | ||||||
| 2026-02-13 | 13F | Aigen Investment Management, Lp | 19.304 | -52,54 | 71 | -43,65 | ||||
| 2026-02-13 | 13F | Van Eck Associates Corp | 833.545 | -34,48 | 3 | 0,00 | ||||
| 2025-10-27 | 13F | Sumitomo Mitsui Trust Holdings, Inc. | 0 | -100,00 | 0 | -100,00 | ||||
| 2026-02-09 | 13F | Fisher Asset Management, LLC | 406.181 | 0,30 | 1.499 | 19,36 | ||||
| 2026-02-18 | 13F | Vident Advisory, LLC | 133.851 | 29,89 | 494 | 54,55 | ||||
| 2026-02-10 | 13F | Greenspring Advisors, LLC | 10.906 | 40 | ||||||
| 2026-02-13 | 13F | Squarepoint Ops LLC | 105.813 | -68,05 | 390 | -61,99 | ||||
| 2026-02-12 | 13F | Sagil Capital Llp | 0 | -100,00 | 0 | |||||
| 2026-04-17 | 13F | Bell Investment Advisors, Inc | 187 | 0,00 | 1 | |||||
| 2026-01-30 | 13F | Sigma Planning Corp | 17.325 | 0,42 | 64 | 18,87 | ||||
| 2026-01-23 | 13F | Assetmark, Inc | 920 | 0,00 | 3 | 50,00 | ||||
| 2026-01-30 | 13F | R Squared Ltd | 0 | -100,00 | 0 | |||||
| 2026-03-11 | 13F | Leonteq Securities AG | 0 | -100,00 | 0 | |||||
| 2026-02-12 | 13F | Provida Pension Fund Administrator | 0 | -100,00 | 0 | |||||
| 2026-03-04 | 13F | Rehmann Capital Advisory Group | 0 | -100,00 | 0 | |||||
| 2026-01-29 | 13F | UBS Group AG | 3.034.398 | 45,11 | 11.197 | 72,72 | ||||
| 2026-02-10 | 13F | Goldman Sachs Group Inc | 2.626.041 | -49,62 | 9.690 | -40,03 | ||||
| 2026-01-28 | 13F | CAPROCK Group, Inc. | 58.540 | -14,45 | 216 | 2,86 | ||||
| 2026-01-13 | 13F | Regatta Capital Group, Llc | 0 | -100,00 | 0 | |||||
| 2026-02-17 | 13F | Qube Research & Technologies Ltd | 0 | -100,00 | 0 | |||||
| 2026-02-17 | 13F | Royal Bank Of Canada | 6.691 | -31,49 | 25 | -19,35 | ||||
| 2026-02-13 | 13F | Barclays Plc | 0 | -100,00 | 0 | |||||
| 2026-02-02 | 13F | Qrg Capital Management, Inc. | 26.904 | -43,19 | 99 | -32,19 | ||||
| 2025-11-07 | 13F/A | Abn Amro Investment Solutions | 49.854 | -68,36 | 238 | -71,17 | ||||
| 2026-02-11 | 13F | Ramirez Asset Management, Inc. | 543 | 2 | ||||||
| 2026-02-17 | 13F | Bank Of America Corp /de/ | 115.043 | -99,28 | 425 | -99,14 | ||||
| 2026-02-11 | 13F | West Family Investments, Inc. | 28.168 | 0,00 | 104 | 18,39 | ||||
| 2026-02-03 | 13F | Sequoia Financial Advisors, LLC | 72.343 | 11,75 | 267 | 33,00 | ||||
| 2026-02-12 | 13F | Renaissance Technologies Llc | 6.211.324 | -42,79 | 22.920 | -31,90 | ||||
| 2026-02-17 | 13F | Fmr Llc | 98.651.805 | 15,66 | 364.025 | 37,67 | ||||
| 2025-11-14 | 13F/A | Skopos Labs, Inc. | 0 | -100,00 | 0 | |||||
| 2026-01-28 | 13F | Kapitalo Investimentos Ltda | 0 | -100,00 | 0 | |||||
| 2026-02-10 | 13F | Bnp Paribas Arbitrage, Sa | 75.751 | -57,70 | 280 | -49,73 | ||||
| 2026-02-17 | 13F | Tudor Investment Corp Et Al | 24.638 | 91 | ||||||
| 2025-12-18 | 13F | AIA Group Ltd | 0 | -100,00 | 0 | -100,00 | ||||
| 2026-02-11 | 13F | Jpmorgan Chase & Co | 185.306 | -22,35 | 684 | -7,58 | ||||
| 2026-03-03 | 13F/A | Caitong International Asset Management Co., Ltd | 8.490 | -23,42 | 31 | -8,82 | ||||
| 2025-11-06 | 13F | Wealthstream Advisors, Inc. | 10.391 | 32 | ||||||
| 2026-02-11 | 13F | Capital Group Investment Management Pte. Ltd. | 117.331 | -9,85 | 433 | 7,20 | ||||
| 2025-11-12 | 13F | Creekmur Asset Management LLC | 0 | 0 | ||||||
| 2026-02-10 | 13F | Sivia Capital Partners, LLC | 15.549 | -10,73 | 57 | 7,55 | ||||
| 2026-02-11 | 13F | Capital International Ltd /ca/ | 527.933 | -10,03 | 1.948 | 7,09 | ||||
| 2026-01-22 | 13F | Massachusetts Financial Services Co /ma/ | 1.327.066 | 41,11 | 4.897 | 67,96 | ||||
| 2026-02-17 | 13F | Two Sigma Advisers, Lp | 525.580 | -83,67 | 1.939 | -80,57 | ||||
| 2026-02-12 | 13F | Dimensional Fund Advisors Lp | 12.059.942 | 0,13 | 44.510 | 19,21 | ||||
| 2026-02-06 | 13F | Addison Advisors LLC | 250 | 0,00 | 1 | |||||
| 2026-02-17 | 13F | Farringdon Capital, Ltd. | 0 | -100,00 | 0 | |||||
| 2026-02-10 | 13F | State of Wyoming | 24.228 | 230,17 | 89 | 304,55 | ||||
| 2026-02-13 | 13F | Centiva Capital, LP | 0 | -100,00 | 0 | |||||
| 2026-01-30 | 13F | ARGA Investment Management, LP | 241.625 | -4,26 | 892 | 13,94 | ||||
| 2026-02-17 | 13F | Capstone Financial Advisors, Inc. | 10.000 | 0,00 | 37 | 16,13 | ||||
| 2025-11-14 | 13F | Wetherby Asset Management Inc | 0 | -100,00 | 0 | |||||
| 2026-02-17 | 13F | Northern Trust Corp | 1.017.007 | 3,75 | 3.753 | 23,50 | ||||
| 2026-01-29 | 13F | Vanguard Group Inc | 2.199.360 | -32,44 | 8.116 | -19,59 | ||||
| 2025-11-12 | 13F | LPL Financial LLC | 0 | -100,00 | 0 | -100,00 | ||||
| 2026-02-12 | 13F | Banco BTG Pactual S.A. | 0 | -100,00 | 0 | -100,00 | ||||
| 2026-02-13 | 13F | VPR Management LLC | 86.242 | 0,00 | 318 | 19,10 | ||||
| 2026-02-17 | 13F | Aqr Capital Management Llc | 272.723 | 36,22 | 1.006 | 62,26 | ||||
| 2026-02-17 | 13F | Millennium Management Llc | 3.505.150 | 72,68 | 12.934 | 105,56 | ||||
| 2026-04-24 | 13F | Yousif Capital Management, Llc | 22.284 | 0,00 | 80 | -13,04 | ||||
| 2026-02-17 | 13F | Point72 Asset Management, L.P. | 2.072.395 | 447,38 | 7.647 | 551,92 | ||||
| 2026-02-13 | 13F | SPX Equities Gestao de Recursos Ltda | 4.894.496 | 8,98 | 18.061 | 29,72 | ||||
| 2026-02-05 | 13F | Allworth Financial LP | 1.616 | -73,08 | 6 | -72,22 | ||||
| 2026-04-21 | 13F | Robeco Institutional Asset Management B.V. | 135.374 | 67,97 | 489 | 64,31 | ||||
| 2026-02-13 | 13F | Wells Fargo & Company/mn | 22.733 | -12,39 | 84 | 3,75 | ||||
| 2026-02-12 | 13F | Federation des caisses Desjardins du Quebec | 756 | -50,00 | 3 | -50,00 | ||||
| 2025-11-14 | 13F | Cubist Systematic Strategies, LLC | 925.457 | -52,51 | 2.869 | -49,60 | ||||
| 2026-02-17 | 13F | Advisor Group Holdings, Inc. | 0 | -100,00 | 0 | |||||
| 2026-02-17 | 13F | MIRAE ASSET GLOBAL ETFS HOLDINGS Ltd. | 11.319 | 47,34 | 42 | 78,26 | ||||
| 2026-02-17 | 13F | XTX Topco Ltd | 588.619 | 86,84 | 2.172 | 122,54 | ||||
| 2026-01-20 | 13F | Stratos Wealth Partners, LTD. | 88.200 | 0,00 | 325 | 19,05 | ||||
| 2026-02-13 | 13F | Sei Investments Co | 282.193 | 268,10 | 1.041 | 339,24 | ||||
| 2025-11-06 | 13F | Advisors Asset Management, Inc. | 0 | -100,00 | 0 | |||||
| 2026-02-05 | 13F | LGT Group Foundation | 58.160 | 0,00 | 216 | 18,03 | ||||
| 2026-02-06 | 13F | Heritage Investors Management Corp | 0 | -100,00 | 0 | |||||
| 2026-01-16 | 13F | FNY Investment Advisers, LLC | Call | 0 | -100,00 | 0 | ||||
| 2026-02-11 | 13F | O'shaughnessy Asset Management, Llc | 14.415 | 8,77 | 53 | 29,27 | ||||
| 2025-11-14 | 13F | Citadel Advisors Llc | Call | 0 | -100,00 | 0 | -100,00 | |||
| 2026-02-13 | 13F | Pathstone Holdings, LLC | 41.401 | 27,40 | 153 | 52,00 | ||||
| 2026-04-14 | 13F | BSW Wealth Partners | 54.163 | 0,87 | 196 | -1,52 | ||||
| 2026-02-13 | 13F | Neuberger Berman Group LLC | 192.899 | -9,89 | 712 | 7,24 | ||||
| 2026-02-13 | 13F | Toroso Investments, LLC | 150.552 | 6,39 | 556 | 26,71 | ||||
| 2026-02-13 | 13F | Inspire Advisors, LLC | 45.249 | -3,01 | 167 | 15,28 | ||||
| 2026-02-05 | 13F | Cambridge Investment Research Advisors, Inc. | 38.717 | -45,44 | 0 | |||||
| 2026-01-28 | 13F | Aquamarine Financial (Cayman) Ltd | 19.526.171 | 9,69 | 72.052 | 30,57 | ||||
| 2026-04-07 | 13F | Signaturefd, Llc | 16.220 | -2,88 | 59 | -4,92 | ||||
| 2026-01-21 | 13F | Kawa Capital Management, Inc | 0 | -100,00 | 0 | |||||
| 2026-02-17 | 13F | Private Advisor Group, LLC | 11.060 | 0,13 | 41 | 17,65 | ||||
| 2026-02-17 | 13F | Two Sigma Investments, Lp | 3.751.067 | -49,93 | 13.841 | -40,40 | ||||
| 2026-02-18 | 13F | Mackenzie Financial Corp | 4.117.253 | 80,57 | 15.286 | 116,27 | ||||
| 2026-02-11 | 13F | Parallel Advisors, LLC | 14.355 | 3,86 | 53 | 23,81 | ||||
| 2026-02-17 | 13F | Schonfeld Strategic Advisors LLC | 545.963 | -57,35 | 2.015 | -49,24 | ||||
| 2026-02-17 | 13F | Public Employees Retirement System Of Ohio | 15.076 | 56 | ||||||
| 2026-02-17 | 13F | Guggenheim Capital Llc | 406.644 | 2,28 | 1.501 | 21,75 | ||||
| 2026-02-13 | 13F | Rhumbline Advisers | 41.639 | -12,47 | 154 | 4,08 | ||||
| 2026-02-02 | 13F | Danske Bank A/s | 1 | 0,00 | 0 | |||||
| 2025-11-12 | 13F | Banco Santander, S.A. | 0 | -100,00 | 0 | -100,00 | ||||
| 2026-02-17 | 13F | Balyasny Asset Management Llc | 0 | -100,00 | 0 | |||||
| 2025-11-12 | 13F/A | Norges Bank | 0 | -100,00 | 0 | |||||
| 2026-02-11 | 13F | Donald Smith & Co., Inc. | 24.211.588 | 49,18 | 89.341 | 77,58 | ||||
| 2026-02-09 | 13F | Legal & General Group Plc | 840.628 | 0,00 | 3.098 | 19,07 | ||||
| 2026-02-17 | 13F/A | RBF Capital, LLC | 90.000 | 0,00 | 332 | 19,00 | ||||
| 2026-02-03 | 13F | Ethic Inc. | 297.228 | 19,53 | 1.097 | 42,34 | ||||
| 2026-02-12 | 13F | Jane Street Group, Llc | 1.251.423 | 4.618 | ||||||
| 2026-02-13 | 13F/A | Virtus ETF Advisers LLC | 0 | -100,00 | 0 | |||||
| 2026-02-09 | 13F | Huntington National Bank | 1 | 0,00 | 0 | |||||
| 2026-02-17 | 13F | Citadel Advisors Llc | Put | 23.200 | -10,77 | 86 | 6,25 | |||
| 2025-11-12 | 13F | Abacus Wealth Partners, LLC | 0 | -100,00 | 0 | |||||
| 2026-02-11 | 13F | Group One Trading, L.p. | Put | 5.700 | -3,39 | 21 | 16,67 | |||
| 2026-02-13 | 13F | National Bank Of Canada /fi/ | 17.131 | 6,59 | 63 | 28,57 | ||||
| 2026-02-11 | 13F | Group One Trading, L.p. | 11.390 | 42 | ||||||
| 2026-04-20 | 13F | Ronald Blue Trust, Inc. | 302 | -83,48 | 1 | -83,33 | ||||
| 2026-02-17 | 13F | Aster Capital Management (DIFC) Ltd | 0 | -100,00 | 0 | |||||
| 2026-01-08 | 13F | Tuttle Tactical Management LLC | 31.986 | 118 |