Grundlæggende statistik
| Institutionelle aktier (lange) | 23.779.415 - 33,71% (ex 13D/G) |
| Institutionel værdi (lang) | $ 275.308 USD ($1000) |
Institutionelt ejerskab og aktionærer
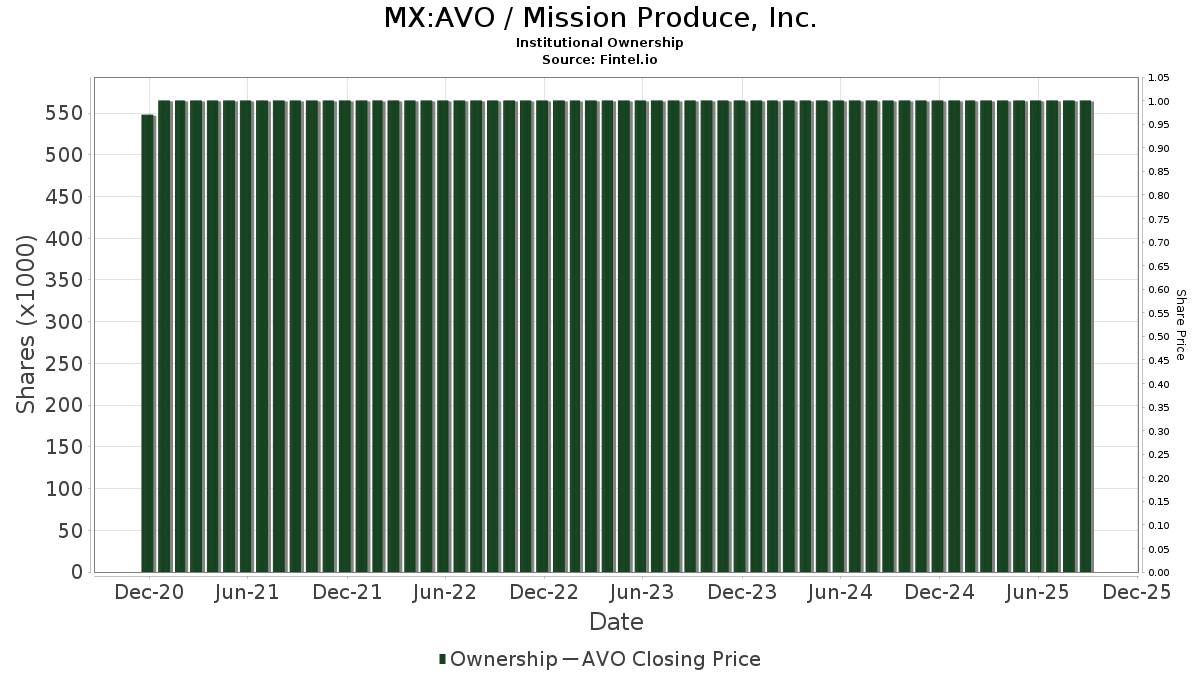
Mission Produce, Inc. (MX:AVO) har 158 institutionelle ejere og aktionærer, der har indsendt 13D/G- eller 13F-formularer til Securities Exchange Commission (SEC). Disse institutioner har i alt 23,779,415 aktier. Største aktionærer omfatter BlackRock, Inc., Vanguard Group Inc, Dimensional Fund Advisors Lp, American Century Companies Inc, State Street Corp, Geode Capital Management, Llc, Platform Wealth Management, LLC, Integrated Advisors Network LLC, Walnut Level Capital LLC, and Qube Research & Technologies Ltd .
Mission Produce, Inc. (BMV:AVO) institutionel ejerskabsstruktur viser aktuelle positioner i virksomheden efter institutioner og fonde, samt seneste ændringer i positionsstørrelse. Større aktionærer kan omfatte individuelle investorer, investeringsforeninger, hedgefonde eller institutioner. Skema 13D angiver, at investoren besidder (eller besidder) mere end 5 % af virksomheden og har til hensigt (eller har til hensigt at) aktivt at forfølge en ændring i forretningsstrategi. Skema 13G indikerer en passiv investering på over 5%.
Fondens stemningsscore
Fund Sentiment Score (fka Ownership Accumulation Score) finder de aktier, der bliver mest købt af fonde. Det er resultatet af en sofistikeret, multi-faktor kvantitativ model, der identificerer virksomheder med de højeste niveauer af institutionel akkumulering. Scoringsmodellen bruger en kombination af den samlede stigning i oplyste ejere, ændringerne i porteføljeallokeringer i disse ejere og andre målinger. Tallet går fra 0 til 100, hvor højere tal indikerer et højere niveau af akkumulering for sine jævnaldrende, og 50 er gennemsnittet.
Opdateringsfrekvens: Dagligt
Se Ownership Explorer, som giver en liste over højest rangerende virksomheder.
AI+ Ask Fintel’s AI assistant about Mission Produce, Inc..
Select a question to share a public post with an AI-crafted answer.
Thinking of good questions…
13F og NPORT arkivering
Detaljer om 13F-arkivering er gratis. Detaljer om NP-ansøgninger kræver et premium-medlemskab. Grønne rækker angiver nye positioner. Røde rækker angiver lukkede positioner. Klik på linket ikon for at se den fulde transaktionshistorik.
Opgrader
for at låse premium-data op og eksportere til Excel ![]() .
.
| Fil dato | Kilde | Investor | Type | Gennemsnitlig pris (Øst) |
Aktier | Δ Aktier (%) |
Rapporteret Værdi ($1000) |
Δ Værdi (%) |
Port Alloc (%) |
|
|---|---|---|---|---|---|---|---|---|---|---|
| 2026-04-13 | 13F | True Wealth Design, LLC | 24 | -17,24 | 0 | |||||
| 2026-02-17 | 13F | Brevan Howard Capital Management LP | 0 | -100,00 | 0 | |||||
| 2026-02-12 | 13F | State Board Of Administration Of Florida Retirement System | 13.860 | 0,00 | 161 | -3,61 | ||||
| 2026-02-13 | 13F | Sterling Capital Management LLC | 2.460 | -16,44 | 29 | -20,00 | ||||
| 2026-03-06 | 13F | Hsbc Holdings Plc | 44.961 | 191,61 | 520 | 182,07 | ||||
| 2026-04-13 | 13F | Wedge Capital Management L L P/nc | 104.833 | 4,81 | 1.443 | 24,31 | ||||
| 2026-02-12 | 13F | New York State Common Retirement Fund | 9.509 | 0,00 | 110 | -3,51 | ||||
| 2026-04-07 | 13F | Farther Finance Advisors, LLC | 596 | 1,36 | 8 | 33,33 | ||||
| 2026-02-23 | 13F | Virtu Financial LLC | 11.459 | 0 | ||||||
| 2026-01-23 | 13F | State of Alaska, Department of Revenue | 3.223 | 15,81 | 0 | |||||
| 2026-02-17 | 13F | Advisor Group Holdings, Inc. | 1.408 | -12,66 | 16 | -15,79 | ||||
| 2026-02-10 | 13F | Bnp Paribas Arbitrage, Sa | 123.715 | 941,64 | 1.435 | 910,56 | ||||
| 2026-02-13 | 13F | Quarry LP | 2.577 | 6,27 | 30 | 0,00 | ||||
| 2026-02-09 | 13F | Geode Capital Management, Llc | 1.048.598 | 0,36 | 12.166 | -3,15 | ||||
| 2026-01-14 | 13F | Spire Wealth Management | 400 | 0,00 | 5 | 0,00 | ||||
| 2026-02-12 | 13F | Campbell & CO Investment Adviser LLC | 35.795 | 47,11 | 415 | 42,12 | ||||
| 2026-02-13 | 13F | Ubs Asset Management Americas Inc | 137.101 | -1,62 | 1.590 | -5,07 | ||||
| 2026-01-28 | 13F | Teacher Retirement System Of Texas | 47.142 | -35,58 | 547 | -37,88 | ||||
| 2026-02-12 | 13F | JPL Wealth Management, LLC | 0 | -100,00 | 0 | |||||
| 2026-02-05 | 13F | Atria Investments Llc | 30.993 | 8,28 | 360 | 4,36 | ||||
| 2026-02-12 | 13F | Jane Street Group, Llc | Call | 41.400 | 480 | |||||
| 2026-02-12 | 13F | Jane Street Group, Llc | 213.147 | -9,71 | 2.473 | -12,87 | ||||
| 2026-02-02 | 13F | Principal Financial Group Inc | 28.071 | 38,55 | 326 | 33,74 | ||||
| 2026-02-17 | 13F | MIRAE ASSET GLOBAL ETFS HOLDINGS Ltd. | 19.831 | 0,04 | 230 | -3,36 | ||||
| 2026-02-10 | 13F | Rothschild Investment Llc | 40 | 0,00 | 0 | |||||
| 2026-02-12 | 13F | Quadrant Capital Group Llc | 2.492 | 0,00 | 29 | -3,45 | ||||
| 2026-02-17 | 13F | Two Sigma Investments, Lp | 12.319 | 143 | ||||||
| 2026-01-30 | 13F | Turning Point Benefit Group, Inc. | 9 | 0,00 | 0 | |||||
| 2026-02-12 | 13F | Skopos Labs, Inc. | 0 | -100,00 | 0 | |||||
| 2026-02-10 | 13F | Bank of New York Mellon Corp | 167.404 | 2,71 | 1.942 | -0,92 | ||||
| 2026-02-11 | 13F | Nuance Investments, Llc | 491.807 | 10,70 | 5.705 | 6,82 | ||||
| 2026-02-17 | 13F | Zacks Investment Management | 18.592 | 216 | ||||||
| 2026-04-16 | 13F | Trium Capital LLP | 1 | 0 | ||||||
| 2026-02-12 | 13F | MetLife Investment Management, LLC | 28.882 | 0,00 | 335 | -3,46 | ||||
| 2026-02-13 | 13F | Fourth Sail Capital LP | 62.525 | 725 | ||||||
| 2025-11-03 | 13F | Federated Hermes, Inc. | 0 | -100,00 | 0 | |||||
| 2026-02-11 | 13F | Parallel Advisors, LLC | 148 | 0,00 | 2 | 0,00 | ||||
| 2026-02-11 | 13F | LPL Financial LLC | 39.178 | -5,73 | 454 | -9,02 | ||||
| 2026-02-13 | 13F | Martingale Asset Management L P | 73.883 | -0,57 | 857 | -4,03 | ||||
| 2026-01-29 | 13F | Vanguard Group Inc | 2.871.240 | -0,36 | 33.306 | -3,84 | ||||
| 2026-02-10 | 13F | Connor, Clark & Lunn Investment Management Ltd. | 128.550 | -42,45 | 1.491 | -44,45 | ||||
| 2026-02-17 | 13F | Canada Pension Plan Investment Board | 12.600 | 146 | ||||||
| 2026-02-17 | 13F | Susquehanna Portfolio Strategies, LLC | 49.643 | -37,11 | 576 | -39,35 | ||||
| 2026-02-09 | 13F | Quest Partners LLC | 13.214 | 183,44 | 153 | 173,21 | ||||
| 2026-04-06 | 13F | Versant Capital Management, Inc | 644 | -60,85 | 9 | -57,89 | ||||
| 2026-02-17 | 13F/A | RBF Capital, LLC | 74.410 | 0,00 | 863 | -3,47 | ||||
| 2026-02-13 | 13F | Parkside Financial Bank & Trust | 45 | 0,00 | 1 | |||||
| 2026-02-13 | 13F | Marshall Wace, Llp | 77.232 | 896 | ||||||
| 2026-02-06 | 13F | Global Retirement Partners, LLC | 173 | 2 | ||||||
| 2026-02-13 | 13F | Prudential Financial Inc | 74.315 | -61,13 | 862 | -62,49 | ||||
| 2026-02-17 | 13F | Algert Global Llc | 42.493 | -61,95 | 0 | -100,00 | ||||
| 2026-02-13 | 13F | National Bank Of Canada /fi/ | 8 | 0 | ||||||
| 2026-02-17 | 13F | Prelude Capital Management, Llc | 18.666 | -10,59 | 217 | -13,60 | ||||
| 2026-02-12 | 13F | Swiss National Bank | 90.500 | 10,23 | 1.050 | 6,39 | ||||
| 2026-02-17 | 13F | Optiver Holding B.V. | 0 | -100,00 | 0 | |||||
| 2026-02-11 | 13F | Los Angeles Capital Management Llc | 123.099 | -13,92 | 1.409 | -18,03 | ||||
| 2026-02-17 | 13F | Trexquant Investment LP | 46.379 | -56,46 | 538 | -58,05 | ||||
| 2026-02-06 | 13F | Leonteq Securities AG | 2.704 | 0,00 | 31 | -3,12 | ||||
| 2026-04-16 | 13F | SG Americas Securities, LLC | 7.848 | -70,44 | 0 | |||||
| 2026-02-17 | 13F | Raymond James Financial Inc | 12.884 | -15,16 | 149 | -18,13 | ||||
| 2026-04-06 | 13F | GAMMA Investing LLC | 4.491 | -2,14 | 62 | 15,09 | ||||
| 2026-02-13 | 13F | Dynamic Technology Lab Private Ltd | 0 | -100,00 | 0 | |||||
| 2026-02-19 | 13F | Invesco Ltd. | 81.206 | -9,13 | 942 | -12,38 | ||||
| 2026-01-29 | 13F | Comerica Bank | 30.724 | 0,37 | 356 | -3,00 | ||||
| 2026-02-13 | 13F | Rhumbline Advisers | 59.513 | -16,39 | 690 | -19,30 | ||||
| 2026-02-10 | 13F | Quantbot Technologies LP | 0 | -100,00 | 0 | |||||
| 2026-01-29 | 13F | UBS Group AG | 247.826 | 18,60 | 2.875 | 14,46 | ||||
| 2026-02-17 | 13F | XTX Topco Ltd | 19.259 | -9,68 | 223 | -12,89 | ||||
| 2026-02-12 | 13F | Commonwealth Equity Services, Llc | 404.256 | -0,94 | 4.689 | 117.125,00 | ||||
| 2026-02-17 | 13F | Point72 Asset Management, L.P. | 45.108 | 523 | ||||||
| 2026-02-17 | 13F | Magnetar Financial LLC | 43.969 | 263,20 | 510 | 251,72 | ||||
| 2026-02-11 | 13F | Group One Trading, L.p. | 1.800 | -30,77 | 21 | -35,48 | ||||
| 2026-02-12 | 13F | EntryPoint Capital, LLC | 22.737 | 264 | ||||||
| 2026-02-09 | 13F | Legal & General Group Plc | 42.294 | 23,19 | 491 | 18,93 | ||||
| 2026-01-26 | 13F | Whittier Trust Co | 0 | -100,00 | 0 | |||||
| 2026-02-17 | 13F | California State Teachers Retirement System | 43.187 | -27,77 | 501 | -30,36 | ||||
| 2026-02-10 | 13F | Goldman Sachs Group Inc | 510.340 | 26,88 | 5.920 | 22,45 | ||||
| 2025-11-14 | 13F | Polymer Capital Management (US) LLC | 0 | -100,00 | 0 | |||||
| 2026-02-17 | 13F | Jones Financial Companies Lllp | 100 | -20,00 | 1 | 0,00 | ||||
| 2026-01-30 | 13F | Us Bancorp \de\ | 590 | 0,00 | 7 | -14,29 | ||||
| 2026-01-23 | 13F | Avion Wealth | 107 | 0,00 | 0 | |||||
| 2026-02-13 | 13F | Smartleaf Asset Management LLC | 399 | 167,79 | 5 | 300,00 | ||||
| 2026-02-17 | 13F | CWM Advisors, LLC | 40.562 | 7,15 | 471 | 3,30 | ||||
| 2025-11-14 | 13F | Walleye Capital LLC | 0 | -100,00 | 0 | |||||
| 2026-02-12 | 13F | Steward Partners Investment Advisory, Llc | 99 | 0,00 | 1 | 0,00 | ||||
| 2026-02-13 | 13F | Verition Fund Management LLC | 24.940 | 49,82 | 289 | 44,50 | ||||
| 2026-01-28 | 13F | Arizona State Retirement System | 12.754 | 1,80 | 148 | -2,00 | ||||
| 2026-02-17 | 13F | Balyasny Asset Management Llc | 18.067 | 210 | ||||||
| 2026-02-13 | 13F | American Century Companies Inc | 1.097.953 | 9,31 | 12.736 | 5,49 | ||||
| 2026-02-17 | 13F | Aqr Capital Management Llc | 43.646 | 5,13 | 506 | 1,40 | ||||
| 2026-04-10 | 13F/A | OP Asset Management Ltd | 102.064 | 1.404 | ||||||
| 2026-02-13 | 13F | Charles Schwab Investment Management Inc | 351.196 | -0,11 | 4.074 | -3,62 | ||||
| 2026-02-13 | 13F | Virtus ETF Advisers LLC | 7.903 | 0,00 | 92 | -3,19 | ||||
| 2026-04-07 | 13F | Signaturefd, Llc | 608 | 0,00 | 8 | 14,29 | ||||
| 2026-02-13 | 13F | Morgan Stanley | 270.491 | -8,10 | 3.138 | -11,31 | ||||
| 2026-02-13 | 13F | Mariner, LLC | 27.925 | 55,24 | 324 | 49,54 | ||||
| 2026-02-12 | 13F | Renaissance Technologies Llc | 104.800 | -67,85 | 1.216 | -68,99 | ||||
| 2026-02-18 | 13F | Mackenzie Financial Corp | 0 | -100,00 | 0 | |||||
| 2026-04-09 | 13F | Sanders Morris Harris Llc | 10.000 | 138 | ||||||
| 2026-02-02 | 13F | Hussman Strategic Advisors, Inc. | 0 | -100,00 | 0 | |||||
| 2026-02-17 | 13F | Susquehanna Fundamental Investments, Llc | 12.244 | 0,00 | 142 | -3,40 | ||||
| 2026-02-17 | 13F | PharVision Advisers, LLC | 35.560 | 103,75 | 412 | 97,13 | ||||
| 2026-02-17 | 13F | Walnut Level Capital LLC | Call | 0 | -100,00 | 0 | ||||
| 2026-01-26 | 13F | Cwm, Llc | 1.409 | -2,02 | 0 | |||||
| 2026-02-17 | 13F | Man Group plc | 0 | -100,00 | 0 | |||||
| 2026-02-17 | 13F | Quadrature Capital Ltd | 23.871 | 277 | ||||||
| 2026-02-17 | 13F | Citadel Advisors Llc | 75.011 | -59,94 | 870 | -61,33 | ||||
| 2026-02-12 | 13F | Davy Global Fund Management Ltd | 71.163 | -10,76 | 825 | -13,88 | ||||
| 2025-10-24 | 13F | New York State Teachers Retirement System | 0 | -100,00 | 0 | |||||
| 2026-02-17 | 13F | D. E. Shaw & Co., Inc. | 187.594 | -4,19 | 2.176 | -7,52 | ||||
| 2026-02-09 | 13F | Penn Capital Management Co Inc | 0 | -100,00 | 0 | |||||
| 2026-02-17 | 13F | Citadel Advisors Llc | Call | 31.400 | -20,10 | 364 | -22,88 | |||
| 2026-02-17 | 13F | Bank Of America Corp /de/ | 48.848 | 47,43 | 567 | 42,21 | ||||
| 2026-02-11 | 13F | Jpmorgan Chase & Co | 17.411 | -1,58 | 202 | -5,19 | ||||
| 2026-02-14 | 13F | Rockefeller Capital Management L.P. | 267 | 0,00 | 3 | 0,00 | ||||
| 2026-02-06 | 13F | Covestor Ltd | 111 | -11,90 | 0 | |||||
| 2026-02-10 | 13F | State of Wyoming | 0 | -100,00 | 0 | |||||
| 2026-02-12 | 13F | Cutler Investment Counsel Llc | 211.750 | -0,47 | 2.456 | -3,95 | ||||
| 2026-02-17 | 13F | Price T Rowe Associates Inc /md/ | 25.502 | 13,40 | 0 | |||||
| 2026-01-27 | 13F | Zurcher Kantonalbank (Zurich Cantonalbank) | 16.964 | 0,00 | 197 | -3,45 | ||||
| 2026-02-17 | 13F | Susquehanna International Group, Llp | Call | 117.300 | 501,54 | 1.361 | 481,20 | |||
| 2026-02-10 | 13F | Intech Investment Management Llc | 18.077 | -13,57 | 210 | -16,73 | ||||
| 2026-02-13 | 13F | State Street Corp | 1.050.899 | -4,73 | 12.190 | -8,06 | ||||
| 2026-01-28 | 13F | Universal- Beteiligungs- und Servicegesellschaft mbH | 15.634 | 1,68 | 181 | -1,63 | ||||
| 2026-02-17 | 13F | Alliancebernstein L.p. | 43.190 | 0,01 | 501 | -3,47 | ||||
| 2026-02-06 | 13F | Pnc Financial Services Group, Inc. | 277 | 0,00 | 3 | 0,00 | ||||
| 2026-02-17 | 13F | Janus Henderson Group Plc | 18.210 | 0,00 | 211 | -3,21 | ||||
| 2026-02-11 | 13F | Fox Run Management, L.l.c. | 20.152 | 234 | ||||||
| 2026-02-13 | 13F | Wells Fargo & Company/mn | 63.538 | 31,25 | 737 | 26,85 | ||||
| 2026-01-29 | 13F | Cornerstone Investment Partners, LLC | 13.312 | 0,06 | 154 | -3,14 | ||||
| 2025-11-14 | 13F | Wolverine Trading, Llc | 12.105 | 144 | ||||||
| 2026-02-11 | 13F | Franklin Resources Inc | 28.254 | 0,00 | 328 | -3,54 | ||||
| 2026-02-17 | 13F | Ameriprise Financial Inc | 20.066 | 233 | ||||||
| 2026-02-17 | 13F | Oxford Asset Management Llp | 45.122 | 523 | ||||||
| 2026-02-17 | 13F | Quantinno Capital Management LP | 67.343 | 22,21 | 781 | 17,98 | ||||
| 2026-02-11 | 13F | Deutsche Bank Ag\ | 42.128 | 7,38 | 489 | 3,61 | ||||
| 2026-02-13 | 13F | Police & Firemen's Retirement System of New Jersey | 12.198 | 0,00 | 141 | -3,42 | ||||
| 2026-02-17 | 13F | Walnut Level Capital LLC | 790.381 | -26,52 | 9.168 | -29,08 | ||||
| 2025-11-14 | 13F | Aquatic Capital Management LLC | 0 | -100,00 | 0 | |||||
| 2026-02-05 | 13F | Amalgamated Bank | 1.341 | -19,07 | 0 | |||||
| 2026-02-13 | 13F | Panagora Asset Management Inc | 77.860 | 2,84 | 903 | -0,77 | ||||
| 2026-02-17 | 13F | Russell Investments Group, Ltd. | 4.957 | -9,30 | 58 | -12,31 | ||||
| 2026-02-17 | 13F | State Of Wisconsin Investment Board | 45.348 | -3,57 | 526 | -6,90 | ||||
| 2026-02-12 | 13F | Dimensional Fund Advisors Lp | 2.689.681 | 4,62 | 31.200 | 0,97 | ||||
| 2026-02-17 | 13F | Gallagher Fiduciary Advisors, LLC | 30.884 | 7,53 | 358 | 3,77 | ||||
| 2026-02-06 | 13F | EverSource Wealth Advisors, LLC | 1.026 | -7,90 | 12 | -15,38 | ||||
| 2025-10-17 | 13F | Ethic Inc. | 0 | -100,00 | 0 | -100,00 | ||||
| 2026-02-11 | 13F | Cerity Partners LLC | 76.975 | 893 | ||||||
| 2026-02-17 | 13F | Qube Research & Technologies Ltd | 534.758 | 56,24 | 6.203 | 50,78 | ||||
| 2026-01-29 | 13F | Inscription Capital, LLC | 10.404 | 1,19 | 121 | -2,44 | ||||
| 2026-02-13 | 13F | Barclays Plc | 80.858 | 16,96 | 938 | 12,89 | ||||
| 2026-02-17 | 13F | Public Employees Retirement System Of Ohio | 7.035 | 465,97 | 82 | 478,57 | ||||
| 2026-02-17 | 13F | Royal Bank Of Canada | 1.403 | -49,06 | 16 | -51,52 | ||||
| 2026-02-12 | 13F | Nuveen, LLC | 83.930 | -4,90 | 974 | -8,21 | ||||
| 2026-02-11 | 13F | Ameritas Investment Partners, Inc. | 3.565 | 41 | ||||||
| 2026-02-17 | 13F | Fmr Llc | 3.818 | -16,16 | 44 | -18,52 | ||||
| 2026-01-15 | 13F | Nisa Investment Advisors, Llc | 744 | -36,25 | 9 | -42,86 | ||||
| 2026-02-17 | 13F | Susquehanna International Group, Llp | 0 | -100,00 | 0 | |||||
| 2026-02-10 | 13F | Platform Wealth Management, LLC | 1.045.703 | 12.130 | ||||||
| 2025-11-07 | 13F | BNP Paribas Asset Management Holding S.A. | 0 | -100,00 | 0 | |||||
| 2026-02-17 | 13F | Lazard Asset Management Llc | 165.861 | -26,53 | 1.924 | -29,12 | ||||
| 2026-02-13 | 13F | Citigroup Inc | 6.085 | -1,81 | 71 | -5,41 | ||||
| 2026-04-16 | 13F | Diversified Trust Co | 19.373 | 11,99 | 267 | 33,00 | ||||
| 2026-01-28 | 13F | Klp Kapitalforvaltning As | 9.800 | -20,97 | 114 | -24,16 | ||||
| 2026-02-12 | 13F | BlackRock, Inc. | 3.623.423 | 1,62 | 42.032 | -1,93 | ||||
| 2026-02-13 | 13F | Arrowstreet Capital, Limited Partnership | 436.993 | 19,09 | 5.069 | 14,94 | ||||
| 2026-02-13 | 13F | Jacobs Levy Equity Management, Inc | 108.259 | 107,00 | 1.256 | 99,84 | ||||
| 2026-02-17 | 13F | Integrated Advisors Network LLC | 816.040 | -2,97 | 9.466 | -6,36 | ||||
| 2026-02-17 | 13F | Aster Capital Management (DIFC) Ltd | 0 | -100,00 | 0 | |||||
| 2026-02-10 | 13F | Lido Advisors, LLC | 272.167 | 0,00 | 3.271 | 0,00 | ||||
| 2026-02-17 | 13F | Millennium Management Llc | 75.580 | -26,89 | 877 | -29,47 | ||||
| 2026-02-17 | 13F | Northern Trust Corp | 367.436 | -7,66 | 4.262 | -10,89 | ||||
| 2026-02-13 | 13F | SRS Capital Advisors, Inc. | 10 | -98,83 | 0 | -100,00 | ||||
| 2026-02-17 | 13F | Creative Planning | 25.714 | 72,28 | 298 | 66,48 | ||||
| 2026-01-26 | 13F | Whittier Trust Co Of Nevada Inc | 1.000 | 0,00 | 12 | -8,33 | ||||
| 2026-02-11 | 13F | Simplex Trading, Llc | 766 | -64,64 | 9 | |||||
| 2026-04-13 | 13F | IFP Advisors, Inc | 118 | 1.866,67 | 2 | |||||
| 2026-02-03 | 13F | Costello Asset Management, INC | 708 | 0,00 | 8 | 0,00 | ||||
| 2026-02-17 | 13F | Tower Research Capital LLC (TRC) | 3.061 | -19,40 | 36 | -22,22 | ||||
| 2026-02-13 | 13F | Manufacturers Life Insurance Company, The | 0 | -100,00 | 0 | |||||
| 2026-02-12 | 13F | Advisors Asset Management, Inc. | 63.087 | 3,76 | 732 | 0,14 | ||||
| 2026-02-17 | 13F | Citadel Advisors Llc | Put | 0 | -100,00 | 0 | ||||
| 2026-01-23 | 13F | Assetmark, Inc | 149 | 0,00 | 2 | 0,00 | ||||
| 2026-02-05 | 13F | Allworth Financial LP | 360 | 9,76 | 4 | 33,33 |