Grundlæggende statistik
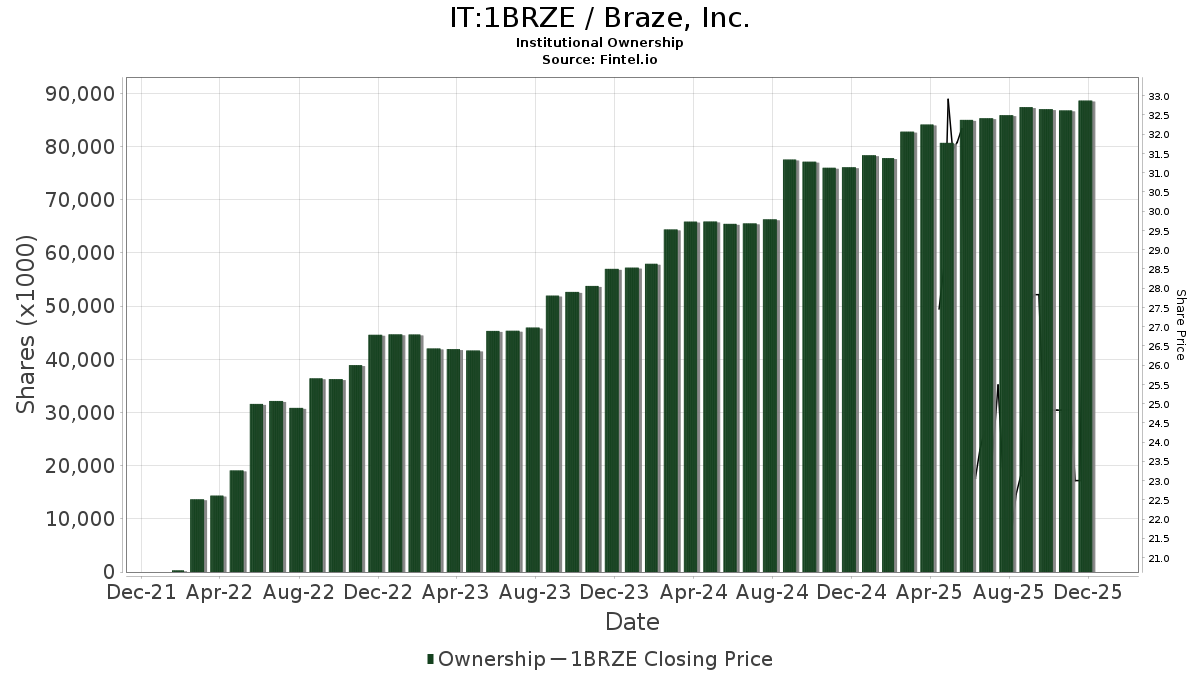
| Institutionelle aktier (lange) | 79.471.853 - 70,05% (ex 13D/G) - change of -9,34MM shares -10,51% MRQ |
| Institutionel værdi (lang) | $ 2.650.230 USD ($1000) |
Institutionelt ejerskab og aktionærer
Braze, Inc. (IT:1BRZE) har 264 institutionelle ejere og aktionærer, der har indsendt 13D/G- eller 13F-formularer til Securities Exchange Commission (SEC). Disse institutioner har i alt 79,471,853 aktier. Største aktionærer omfatter Vanguard Group Inc, BlackRock, Inc., Millennium Management Llc, Battery Management Corp., Point72 Asset Management, L.P., Alliancebernstein L.p., Jpmorgan Chase & Co, Westfield Capital Management Co Lp, Alyeska Investment Group, L.P., and State Street Corp .
Braze, Inc. (BIT:1BRZE) institutionel ejerskabsstruktur viser aktuelle positioner i virksomheden efter institutioner og fonde, samt seneste ændringer i positionsstørrelse. Større aktionærer kan omfatte individuelle investorer, investeringsforeninger, hedgefonde eller institutioner. Skema 13D angiver, at investoren besidder (eller besidder) mere end 5 % af virksomheden og har til hensigt (eller har til hensigt at) aktivt at forfølge en ændring i forretningsstrategi. Skema 13G indikerer en passiv investering på over 5%.
The share price as of April 20, 2026 is 19,20 / share. Previously, on April 28, 2025, the share price was 26,34 / share. This represents a decline of 27,11% over that period.
Fondens stemningsscore
Fund Sentiment Score (fka Ownership Accumulation Score) finder de aktier, der bliver mest købt af fonde. Det er resultatet af en sofistikeret, multi-faktor kvantitativ model, der identificerer virksomheder med de højeste niveauer af institutionel akkumulering. Scoringsmodellen bruger en kombination af den samlede stigning i oplyste ejere, ændringerne i porteføljeallokeringer i disse ejere og andre målinger. Tallet går fra 0 til 100, hvor højere tal indikerer et højere niveau af akkumulering for sine jævnaldrende, og 50 er gennemsnittet.
Opdateringsfrekvens: Dagligt
Se Ownership Explorer, som giver en liste over højest rangerende virksomheder.
AI+ Ask Fintel’s AI assistant about Braze, Inc..
Select a question to share a public post with an AI-crafted answer.
Thinking of good questions…
13F og NPORT arkivering
Detaljer om 13F-arkivering er gratis. Detaljer om NP-ansøgninger kræver et premium-medlemskab. Grønne rækker angiver nye positioner. Røde rækker angiver lukkede positioner. Klik på linket ikon for at se den fulde transaktionshistorik.
Opgrader
for at låse premium-data op og eksportere til Excel ![]() .
.
| Fil dato | Kilde | Investor | Type | Gennemsnitlig pris (Øst) |
Aktier | Δ Aktier (%) |
Rapporteret Værdi ($1000) |
Δ Værdi (%) |
Port Alloc (%) |
|
|---|---|---|---|---|---|---|---|---|---|---|
| 2026-02-04 | 13F | JSF Financial, LLC | 41.558 | 0,00 | 1.425 | 20,66 | ||||
| 2025-11-14 | 13F | Wellington Management Group Llp | 0 | -100,00 | 0 | |||||
| 2026-02-13 | 13F | Charles Schwab Investment Management Inc | 721.491 | 6,77 | 24.740 | 28,73 | ||||
| 2026-02-17 | 13F | Fmr Llc | 6.628 | 190,32 | 227 | 254,69 | ||||
| 2026-02-09 | 13F | Jackson Creek Investment Advisors LLC | 13.388 | -1,41 | 0 | |||||
| 2026-02-13 | 13F | ICONIQ Capital, LLC | 0 | -100,00 | 0 | |||||
| 2026-02-17 | 13F | Bayesian Capital Management, LP | 0 | -100,00 | 0 | |||||
| 2026-02-10 | 13F | Intech Investment Management Llc | 39.414 | 7,11 | 1.352 | 29,16 | ||||
| 2026-02-13 | 13F | Morgan Stanley | 460.885 | -54,35 | 15.804 | -44,96 | ||||
| 2026-02-13 | 13F | Liberty Mutual Group Asset Management Inc. | 40.410 | 1.386 | ||||||
| 2026-02-05 | 13F | Dana Investment Advisors, Inc. | 57.730 | 1.980 | ||||||
| 2026-02-17 | 13F | Aquatic Capital Management LLC | 14.225 | -87,39 | 488 | -84,82 | ||||
| 2026-02-17 | 13F | Lazard Asset Management Llc | 18.193 | -76,92 | 624 | -72,20 | ||||
| 2026-02-17 | 13F | Freestone Grove Partners LP | 434.110 | -42,91 | 14.886 | -31,16 | ||||
| 2026-02-17 | 13F | Paloma Partners Management Co | 0 | -100,00 | 0 | |||||
| 2026-02-12 | 13F | Xponance, Inc. | 6.743 | 231 | ||||||
| 2026-02-11 | 13F | Zions Bancorporation, National Association /ut/ | 66 | 2 | ||||||
| 2026-02-12 | 13F | Voya Investment Management Llc | 14.526 | 5,22 | 498 | 27,04 | ||||
| 2026-02-17 | 13F | Balyasny Asset Management Llc | 0 | -100,00 | 0 | |||||
| 2025-11-13 | 13F | UBS Group AG | Put | 0 | -100,00 | 0 | -100,00 | |||
| 2026-02-17 | 13F | Cadian Capital Management, Lp | 0 | -100,00 | 0 | |||||
| 2026-02-17 | 13F | Capital Fund Management S.a. | Put | 0 | -100,00 | 0 | ||||
| 2026-02-13 | 13F | Wells Fargo & Company/mn | 181.535 | 242,36 | 6.225 | 312,73 | ||||
| 2025-11-14 | 13F | Caption Management, LLC | 0 | -100,00 | 0 | -100,00 | ||||
| 2026-02-17 | 13F | Alliancebernstein L.p. | 2.576.418 | 27,92 | 88.345 | 54,24 | ||||
| 2026-02-10 | 13F | Park Avenue Institutional Advisers LLC | 8.890 | 305 | ||||||
| 2025-11-13 | 13F | Glenmede Investment Management, LP | 429.166 | -5,05 | 12.205 | -3,91 | ||||
| 2026-02-11 | 13F | Fox Run Management, L.l.c. | 20.019 | 119,43 | 686 | 164,86 | ||||
| 2026-02-11 | 13F | Rise Advisors, LLC | 0 | -100,00 | 0 | |||||
| 2025-11-14 | 13F | Corton Capital Inc. | 7.217 | -40,13 | 205 | -39,35 | ||||
| 2026-02-13 | 13F | Sei Investments Co | 157.355 | 95,32 | 5.396 | 135,49 | ||||
| 2025-11-13 | 13F | UBS Group AG | Call | 0 | -100,00 | 0 | -100,00 | |||
| 2026-02-11 | 13F | Simplex Trading, Llc | 0 | -100,00 | 0 | |||||
| 2026-02-13 | 13F | Mariner, LLC | 16.086 | 553 | ||||||
| 2026-02-05 | 13F | Stephens Investment Management Group LLC | 1.233.143 | 8,72 | 42.284 | 31,08 | ||||
| 2026-02-11 | 13F | Jpmorgan Chase & Co | 2.319.863 | -5,52 | 79.548 | 13,92 | ||||
| 2026-02-13 | 13F | Edgestream Partners, L.P. | 0 | -100,00 | 0 | |||||
| 2026-01-20 | 13F | Harbor Capital Advisors, Inc. | 66.190 | 5,03 | 2 | 100,00 | ||||
| 2026-04-07 | 13F | Farther Finance Advisors, LLC | 1.671 | 3.878,57 | 39 | 3.800,00 | ||||
| 2026-02-20 | 13F | Sunbelt Securities, Inc. | 24 | -54,72 | 1 | -100,00 | ||||
| 2026-02-12 | 13F | Andra AP-fonden | 0 | -100,00 | 0 | |||||
| 2026-02-17 | 13F | XTX Topco Ltd | 22.517 | 212,26 | 772 | 276,59 | ||||
| 2026-02-10 | 13F | Rothschild Investment Llc | 229 | 316,36 | 8 | 600,00 | ||||
| 2026-02-09 | 13F | Jefferies Financial Group Inc. | 0 | -100,00 | 0 | |||||
| 2026-04-06 | 13F | Sincerus Advisory, LLC | 14.766 | 0,00 | 349 | -31,23 | ||||
| 2026-02-17 | 13F | Brevan Howard Capital Management LP | 18.031 | 39,17 | 618 | 67,93 | ||||
| 2026-02-13 | 13F | Quarry LP | 1.134 | -29,52 | 39 | -15,56 | ||||
| 2026-01-23 | 13F | Private Wealth Management Group, LLC | 123 | 0,00 | 4 | 33,33 | ||||
| 2026-02-12 | 13F | BRYN MAWR TRUST Co | 0 | -100,00 | 0 | -100,00 | ||||
| 2026-02-12 | 13F | Renaissance Technologies Llc | 119.400 | 4.094 | ||||||
| 2025-11-13 | 13F | Norges Bank | 0 | -100,00 | 0 | -100,00 | ||||
| 2026-02-13 | 13F | Bridgefront Capital, LLC | 0 | -100,00 | 0 | |||||
| 2026-02-05 | 13F | Allworth Financial LP | 584 | 237,57 | 20 | 400,00 | ||||
| 2026-02-11 | 13F | Manchester Capital Management LLC | 18 | 1 | ||||||
| 2026-02-17 | 13F | G2 Investment Partners Management LLC | 290.227 | 9.952 | ||||||
| 2026-02-17 | 13F | Newlands Management Operations LLC | 0 | -100,00 | 0 | |||||
| 2026-02-17 | 13F | Highland Capital Management Fund Advisors, L.p. | 74.955 | 78,13 | 2.570 | 114,88 | ||||
| 2026-02-12 | 13F | SWAN Capital LLC | 0 | -100,00 | 0 | |||||
| 2026-02-17 | 13F | Clear Street Markets Llc | 357 | 12 | ||||||
| 2026-02-17 | 13F | Engineers Gate Manager LP | 545.581 | 143,58 | 18.708 | 193,67 | ||||
| 2025-11-06 | 13F | Advisors Asset Management, Inc. | 0 | -100,00 | 0 | |||||
| 2026-02-17 | 13F | Caption Management, LLC | Call | 0 | -100,00 | 0 | -100,00 | |||
| 2025-11-14 | 13F | Polar Capital Holdings Plc | 0 | -100,00 | 0 | |||||
| 2026-01-29 | 13F | Vanguard Group Inc | 9.851.050 | 9,96 | 337.793 | 32,58 | ||||
| 2026-04-20 | 13F | State of Alaska, Department of Revenue | 4.211 | 0,00 | 0 | |||||
| 2026-02-06 | 13F | Pnc Financial Services Group, Inc. | 13.628 | 8,09 | 467 | 30,45 | ||||
| 2026-02-17 | 13F | Delaware Management Holdings, Inc. | 143.886 | 4.934 | ||||||
| 2026-04-10 | 13F | Abound Wealth Management | 105 | 0,00 | 2 | -33,33 | ||||
| 2026-01-16 | 13F | Marquette Asset Management, LLC | 82 | 82,22 | 3 | 100,00 | ||||
| 2026-01-23 | 13F | Eagle Bay Advisors LLC | 29.495 | -2,97 | 1.011 | 17,01 | ||||
| 2026-02-06 | 13F | ProShare Advisors LLC | 24.342 | 21,72 | 835 | 46,83 | ||||
| 2026-02-17 | 13F | Msop Gp, L.l.c. | 5.579 | 191 | ||||||
| 2026-02-17 | 13F | Solel Partners LP | 1.272.200 | 70,56 | 43.624 | 105,64 | ||||
| 2025-11-14 | 13F | D. E. Shaw & Co., Inc. | Put | 0 | -100,00 | 0 | ||||
| 2026-02-17 | 13F | Tower Research Capital LLC (TRC) | 12.351 | 143,85 | 424 | 193,75 | ||||
| 2026-02-11 | 13F | Dorsey & Whitney Trust CO LLC | 17.512 | 600 | ||||||
| 2026-04-17 | 13F | AdvisorNet Financial, Inc | 0 | -100,00 | 0 | |||||
| 2026-02-13 | 13F | Prudential Financial Inc | 0 | -100,00 | 0 | -100,00 | ||||
| 2025-11-14 | 13F | Wolverine Trading, Llc | Call | 33.100 | 206,48 | 1.066 | 268,86 | |||
| 2025-11-14 | 13F | Wolverine Trading, Llc | Put | 7.600 | 245 | |||||
| 2026-02-06 | 13F | Kilter Group LLC | 0 | -100,00 | 0 | |||||
| 2026-01-16 | 13F | FNY Investment Advisers, LLC | Call | 0 | -100,00 | 0 | ||||
| 2026-02-17 | 13F | Boothbay Fund Management, Llc | 92.170 | 26,61 | 3.161 | 52,66 | ||||
| 2026-02-12 | 13F | State Board Of Administration Of Florida Retirement System | 14.960 | 0,00 | 513 | 20,47 | ||||
| 2026-02-17 | 13F | Occudo Quantitative Strategies Lp | 31.244 | 299,18 | 1.071 | 382,43 | ||||
| 2025-11-13 | 13F | Mackenzie Financial Corp | 0 | -100,00 | 0 | |||||
| 2026-04-13 | 13F | IFP Advisors, Inc | 1.954 | 1.660,36 | 46 | 1.433,33 | ||||
| 2026-02-05 | 13F | Northwestern Mutual Wealth Management Co | 100.111 | 232.716,28 | 6.308 | 630.700,00 | ||||
| 2026-02-12 | 13F | CIBC Private Wealth Group, LLC | 239.399 | 28,17 | 8.209 | 54,55 | ||||
| 2026-02-05 | 13F | Bessemer Group Inc | 46.540 | -0,11 | 2 | 0,00 | ||||
| 2026-02-17 | 13F | Panoramic Capital, LLC | 124.652 | 107,75 | 4.274 | 150,53 | ||||
| 2026-02-13 | 13F | Parkside Financial Bank & Trust | 83 | 315,00 | 3 | |||||
| 2026-02-17 | 13F | Graham Capital Management, L.P. | 23.443 | 804 | ||||||
| 2025-11-19 | 13F/A | Danske Bank A/s | 0 | -100,00 | 0 | -100,00 | ||||
| 2026-02-17 | 13F | CastleKnight Management LP | 32.500 | 0,00 | 1.114 | 20,56 | ||||
| 2026-02-10 | 13F | Bnp Paribas Arbitrage, Sa | 31.267 | -90,09 | 1.072 | -88,05 | ||||
| 2026-02-17 | 13F | Russell Investments Group, Ltd. | 178.947 | -2,16 | 6.138 | 18,00 | ||||
| 2026-02-13 | 13F | Victory Capital Management Inc | 147.503 | -34,37 | 5.058 | -20,87 | ||||
| 2026-02-17 | 13F | Quantinno Capital Management LP | 17.218 | 15,20 | 590 | 38,82 | ||||
| 2025-11-21 | 13F/A | CIBC Bancorp USA Inc. | 8.504 | 242 | ||||||
| 2026-02-05 | 13F | Td Private Client Wealth Llc | 22 | 1 | ||||||
| 2026-02-12 | 13F | Federation des caisses Desjardins du Quebec | 164 | 0,00 | 6 | 25,00 | ||||
| 2026-02-12 | 13F | New York State Common Retirement Fund | 28.475 | 11,34 | 976 | 34,25 | ||||
| 2026-04-10 | 13F | Northside Capital Management, LLC | 0 | -100,00 | 0 | |||||
| 2026-02-17 | 13F | Qube Research & Technologies Ltd | 16.582 | 569 | ||||||
| 2026-01-26 | 13F | Cwm, Llc | 20.047 | 53,62 | 1 | |||||
| 2026-01-30 | 13F | Us Bancorp \de\ | 6.865 | 389,66 | 235 | 502,56 | ||||
| 2026-02-10 | 13F | Connor, Clark & Lunn Investment Management Ltd. | 298.446 | 1.241,93 | 10.234 | 1.519,15 | ||||
| 2026-02-17 | 13F | Weiss Asset Management LP | 0 | -100,00 | 0 | -100,00 | ||||
| 2026-02-17 | 13F | Voloridge Investment Management, Llc | 0 | -100,00 | 0 | |||||
| 2026-02-17 | 13F | MIRAE ASSET GLOBAL ETFS HOLDINGS Ltd. | 39.672 | 7,05 | 1.360 | 29,03 | ||||
| 2026-02-10 | 13F | Acadian Asset Management Llc | 231.016 | 1.026,63 | 8 | |||||
| 2026-02-12 | 13F | Swiss National Bank | 156.400 | 9,75 | 5.363 | 32,33 | ||||
| 2026-04-13 | 13F | True Wealth Design, LLC | 165 | 358,33 | 4 | 200,00 | ||||
| 2026-02-13 | 13F | Smartleaf Asset Management LLC | 137 | 585,00 | 5 | |||||
| 2026-02-17 | 13F | Sender Co & Partners, Inc. | 0 | -100,00 | 0 | |||||
| 2026-02-17 | 13F | Scalar Gauge Management, Llc | 124.000 | 4.252 | ||||||
| 2026-02-12 | 13F | Cibc World Markets Corp | 0 | -100,00 | 0 | |||||
| 2026-02-17 | 13F | Capstone Investment Advisors, Llc | 0 | -100,00 | 0 | -100,00 | ||||
| 2026-02-17 | 13F | ExodusPoint Capital Management, LP | 0 | -100,00 | 0 | -100,00 | ||||
| 2026-02-12 | 13F | Marex Group plc | 0 | -100,00 | 0 | |||||
| 2026-01-29 | 13F | Dunhill Financial, LLC | 1 | 0 | ||||||
| 2026-02-11 | 13F | LPL Financial LLC | 24.699 | 107,71 | 847 | 150,30 | ||||
| 2026-02-17 | 13F | Capitolis Liquid Global Markets LLC | 0 | -100,00 | 0 | |||||
| 2026-02-10 | 13F | Allen Investment Management LLC | 0 | -100,00 | 0 | |||||
| 2025-11-14 | 13F | Petrus Trust Company, LTA | 0 | -100,00 | 0 | -100,00 | ||||
| 2025-11-14 | 13F | Walleye Trading LLC | 0 | -100,00 | 0 | -100,00 | ||||
| 2026-02-27 | 13F/A | Barclays Plc | Call | 0 | -100,00 | 0 | -100,00 | |||
| 2026-01-29 | 13F | Quent Capital, LLC | 4.672 | 0,00 | 160 | 21,21 | ||||
| 2026-02-17 | 13F | Advisor Group Holdings, Inc. | 5.323 | 4.227,64 | 183 | 5.966,67 | ||||
| 2026-01-15 | 13F | Nisa Investment Advisors, Llc | 644 | -38,84 | 22 | -24,14 | ||||
| 2025-11-13 | 13F | Dynamic Technology Lab Private Ltd | 0 | -100,00 | 0 | |||||
| 2026-04-16 | 13F | SG Americas Securities, LLC | 394.604 | 36,17 | 9 | 0,00 | ||||
| 2026-02-11 | 13F | Inceptionr Llc | 0 | -100,00 | 0 | |||||
| 2026-01-23 | 13F | Sumitomo Mitsui Trust Holdings, Inc. | 8.865 | 304 | ||||||
| 2026-01-28 | 13F | Arizona State Retirement System | 22.437 | 3,16 | 769 | 24,43 | ||||
| 2026-02-17 | 13F | Odyssean, LLC | 21.471 | 736 | ||||||
| 2025-11-10 | 13F | MAI Capital Management | 0 | -100,00 | 0 | |||||
| 2026-02-13 | 13F | Sterling Capital Management LLC | 551 | 185,49 | 19 | 260,00 | ||||
| 2026-02-06 | 13F | Evoke Wealth, Llc | 9.668 | 3,08 | 332 | 24,44 | ||||
| 2026-02-11 | 13F | Picton Mahoney Asset Management | 440.410 | 1.692,69 | 15.102 | |||||
| 2026-02-13 | 13F | DC Investments Management, LLC | 0 | -100,00 | 0 | |||||
| 2026-04-15 | 13F | Merit Financial Group, LLC | 12.484 | 295 | ||||||
| 2026-02-17 | 13F | Tudor Investment Corp Et Al | Put | 39.600 | 335,16 | 1.358 | 425,97 | |||
| 2026-01-23 | 13F | Rsm Us Wealth Management Llc | 12.561 | -2,89 | 437 | 18,80 | ||||
| 2026-02-17 | 13F | Tudor Investment Corp Et Al | Call | 9.300 | -32,61 | 319 | -18,88 | |||
| 2026-02-17 | 13F | Magnetar Financial LLC | 14.757 | -38,46 | 506 | -25,70 | ||||
| 2026-04-07 | 13F | Signaturefd, Llc | 2.144 | 2.422,35 | 51 | 2.400,00 | ||||
| 2026-04-13 | 13F | Mather Group, Llc. | 48 | 1 | ||||||
| 2025-11-14 | 13F | Man Group plc | 0 | -100,00 | 0 | |||||
| 2025-11-14 | 13F | Concentric Capital Strategies, LP | 0 | -100,00 | 0 | -100,00 | ||||
| 2026-02-13 | 13F | Verition Fund Management LLC | 306.653 | 29,43 | 10.515 | 56,08 | ||||
| 2026-02-17 | 13F | Mercer Global Advisors Inc /adv | 22.878 | 7,43 | 784 | 29,59 | ||||
| 2026-02-17 | 13F | Advisory Services Network, LLC | 0 | -100,00 | 0 | |||||
| 2026-02-09 | 13F | King Luther Capital Management Corp | 214.944 | 6,79 | 7.370 | 28,76 | ||||
| 2026-02-04 | 13F | Pathway Capital Management, Lp | 64.370 | 2.207 | ||||||
| 2026-02-13 | 13F | Caitong International Asset Management Co., Ltd | 825 | 3.650,00 | 28 | |||||
| 2026-02-13 | 13F | Centiva Capital, LP | 6.973 | 239 | ||||||
| 2026-04-13 | 13F | Massmutual Trust Co Fsb/adv | 40 | -25,93 | 1 | -100,00 | ||||
| 2026-02-02 | 13F | Principal Financial Group Inc | 108.809 | 3.731 | ||||||
| 2025-11-05 | 13F | SOUTH STATE Corp | 0 | -100,00 | 0 | |||||
| 2026-02-09 | 13F | Geode Capital Management, Llc | 2.082.739 | 4,22 | 71.430 | 25,66 | ||||
| 2026-02-17 | 13F | Gotham Asset Management, LLC | 9.433 | 323 | ||||||
| 2025-11-10 | 13F | BIT Capital GmbH | 0 | -100,00 | 0 | -100,00 | ||||
| 2025-11-14 | 13F | Point72 Europe (London) LLP | 2.453 | 70 | ||||||
| 2026-02-13 | 13F | Fieldview Capital Management, LLC | 14.684 | -33,55 | 504 | -19,90 | ||||
| 2026-02-10 | 13F | Bank of New York Mellon Corp | 427.660 | 3,92 | 14.664 | 25,30 | ||||
| 2026-02-12 | 13F | Nuveen, LLC | 1.353.709 | 17,13 | 46.419 | 41,22 | ||||
| 2026-02-17 | 13F | Kemnay Advisory Services Inc. | 1.503 | 52 | ||||||
| 2026-02-13 | 13F | Entropy Technologies, LP | 23.131 | 793 | ||||||
| 2026-04-14 | 13F | Nbc Securities, Inc. | 1.014 | 27,07 | 24 | -14,81 | ||||
| 2026-04-15 | 13F | Activest Wealth Management | 206 | 0,00 | 5 | -42,86 | ||||
| 2026-02-12 | 13F | Commonwealth Equity Services, Llc | 48.250 | -13,57 | 1.654 | 165.300,00 | ||||
| 2026-02-13 | 13F | Herald Investment Management Ltd | 125.000 | 4.286 | ||||||
| 2026-02-17 | 13F | Battery Management Corp. | 3.264.864 | 34,63 | 111.952 | 62,33 | ||||
| 2026-04-06 | 13F | Highline Wealth Partners Llc | 64 | 2 | ||||||
| 2026-01-28 | 13F | Peregrine Capital Management Llc | 231.517 | -1,35 | 7.939 | 18,94 | ||||
| 2026-02-17 | 13F | Numerai GP LLC | 7.935 | 272 | ||||||
| 2026-02-04 | 13F | Virginia Retirement Systems Et Al | 8.600 | -46,25 | 295 | -35,38 | ||||
| 2026-02-13 | 13F | Panagora Asset Management Inc | 52.893 | 106,25 | 1.814 | 148,70 | ||||
| 2026-02-17 | 13F | Captrust Financial Advisors | 16.294 | 26,64 | 559 | 52,88 | ||||
| 2026-01-29 | 13F | UBS Group AG | 1.576.931 | 23,23 | 54.073 | 48,57 | ||||
| 2026-02-17 | 13F | Aqr Capital Management Llc | 278.783 | 60,25 | 9.559 | 93,23 | ||||
| 2026-02-17 | 13F | Trexquant Investment LP | 322.499 | 91,87 | 11.058 | 131,34 | ||||
| 2026-01-23 | 13F | Penn Mutual Asset Management, LLC | 4.321 | 148 | ||||||
| 2026-02-13 | 13F | State Street Corp | 2.084.626 | 5,02 | 71.482 | 26,62 | ||||
| 2026-04-06 | 13F | Versant Capital Management, Inc | 4.140 | 6.368,75 | 98 | 4.750,00 | ||||
| 2026-02-18 | 13F | Papamarkou Wellner Asset Management inc. | 9.650 | 331 | ||||||
| 2026-02-06 | 13F | Legato Capital Management LLC | 32.750 | 1.123 | ||||||
| 2026-02-12 | 13F | Quadrant Capital Group Llc | 8 | -96,02 | 0 | -100,00 | ||||
| 2026-02-17 | 13F | J. Goldman & Co LP | 0 | -100,00 | 0 | |||||
| 2026-02-13 | 13F | Neo Ivy Capital Management | 0 | -100,00 | 0 | |||||
| 2026-02-13 | 13F | Ubs Asset Management Americas Inc | 197.377 | 5,61 | 6.768 | 27,34 | ||||
| 2026-04-09 | 13F | Moody National Bank Trust Division | 0 | -100,00 | 0 | |||||
| 2026-04-06 | 13F | GAMMA Investing LLC | 1.955 | 261,37 | 46 | 155,56 | ||||
| 2026-02-17 | 13F | Optimus Prime Fund Management Co., Ltd. | 1.780.000 | 0,00 | 61.036 | 20,57 | ||||
| 2025-10-31 | 13F | Cullen/frost Bankers, Inc. | 0 | -100,00 | 0 | |||||
| 2026-02-13 | 13F | Walleye Trading LLC | Put | 94.100 | 3.519,23 | 3.227 | 4.319,18 | |||
| 2026-02-13 | 13F | Walleye Trading LLC | Call | 13.200 | 65,00 | 453 | 99,12 | |||
| 2026-04-16 | 13F | Capital Advisors, Ltd. LLC | 14 | 0 | ||||||
| 2026-02-12 | 13F | BlackRock, Inc. | 7.172.379 | 5,66 | 245.941 | 27,40 | ||||
| 2026-02-17 | 13F | Millennium Management Llc | 4.012.030 | 15,21 | 137.573 | 38,91 | ||||
| 2026-01-23 | 13F | Ami Asset Management Corp | 24.628 | -0,88 | 844 | 19,55 | ||||
| 2026-02-17 | 13F | Millennium Management Llc | Call | 60.000 | 2.057 | |||||
| 2026-04-20 | 13F | Ronald Blue Trust, Inc. | 0 | -100,00 | 0 | |||||
| 2026-02-10 | 13F | Natixis Advisors, L.p. | 15.472 | 20,02 | 1 | |||||
| 2026-02-13 | 13F | Umb Bank N A/mo | 647 | 22 | ||||||
| 2026-02-17 | 13F | Two Sigma Securities, Llc | 25.587 | 114,84 | 877 | 159,47 | ||||
| 2026-01-28 | 13F | DekaBank Deutsche Girozentrale | 1.307 | 0,00 | 0 | |||||
| 2026-02-11 | 13F | Winton Capital Group Ltd | 23.549 | 807 | ||||||
| 2026-02-13 | 13F | Citigroup Inc | 10.770 | -58,82 | 369 | -50,34 | ||||
| 2026-01-27 | 13F | Zurcher Kantonalbank (Zurich Cantonalbank) | 28.343 | 8,58 | 972 | 30,86 | ||||
| 2026-02-06 | 13F | GPS Wealth Strategies Group, LLC | 0 | -100,00 | 0 | |||||
| 2026-02-09 | 13F | Quest Partners LLC | 4.425 | -13,00 | 152 | 4,86 | ||||
| 2026-02-17 | 13F | Voleon Capital Management Lp | 20.931 | -52,41 | 718 | -42,64 | ||||
| 2026-02-17 | 13F | Price T Rowe Associates Inc /md/ | 802.725 | 216,93 | 28 | 285,71 | ||||
| 2026-01-30 | 13F | Citizens Financial Group Inc/ri | 26.225 | -0,25 | 899 | 20,35 | ||||
| 2026-02-17 | 13F | Osterweis Capital Management Inc | 69.305 | 2.376 | ||||||
| 2026-02-10 | 13F | Goldman Sachs Group Inc | 934.528 | 10,74 | 32.045 | 33,51 | ||||
| 2026-02-13 | 13F | Verition Fund Management LLC | Call | 0 | -100,00 | 0 | -100,00 | |||
| 2026-02-12 | 13F | MetLife Investment Management, LLC | 47.231 | 1,92 | 1.620 | 22,93 | ||||
| 2026-01-28 | 13F | Teacher Retirement System Of Texas | 0 | -100,00 | 0 | |||||
| 2026-02-13 | 13F | Barclays Plc | 1.429.076 | 1,76 | 49.003 | 22,69 | ||||
| 2026-02-17 | 13F | Caption Management, LLC | Put | 0 | -100,00 | 0 | -100,00 | |||
| 2026-01-21 | 13F | SJS Investment Consulting Inc. | 19 | 1 | ||||||
| 2026-02-09 | 13F | Keating Financial Advisory Services, Inc. | 12 | 0 | ||||||
| 2026-02-12 | 13F | Groupe la Francaise | 0 | -100,00 | 0 | |||||
| 2025-11-21 | 13F | Nebula Research & Development LLC | 0 | -100,00 | 0 | |||||
| 2026-02-17 | 13F | Susquehanna International Group, Llp | 92.832 | 360,96 | 3.183 | 456,47 | ||||
| 2025-10-30 | 13F | Bailard, Inc. | 0 | -100,00 | 0 | -100,00 | ||||
| 2026-02-06 | 13F | Larson Financial Group LLC | 319 | 11 | ||||||
| 2026-02-17 | 13F | Susquehanna International Group, Llp | Put | 276.300 | 2.261,54 | 9.474 | 2.753,61 | |||
| 2025-11-13 | 13F/A | Peak6 Llc | Call | 0 | -100,00 | 0 | ||||
| 2026-02-02 | 13F | Strs Ohio | 2.500 | 0,00 | 86 | 19,72 | ||||
| 2026-02-17 | 13F | Optiver Holding B.V. | 429 | -19,96 | 15 | -6,67 | ||||
| 2026-02-17 | 13F | Susquehanna International Group, Llp | Call | 258.500 | 165,95 | 8.864 | 220,66 | |||
| 2026-02-17 | 13F | Twinbeech Capital Lp | 72.841 | 548,74 | 2.498 | 682,76 | ||||
| 2026-02-17 | 13F | Jones Financial Companies Lllp | 42 | 1 | ||||||
| 2026-04-15 | 13F | FNY Investment Advisers, LLC | 5.425 | 171,25 | 0 | |||||
| 2026-02-04 | 13F | Ground Swell Capital, LLC | 0 | -100,00 | 0 | |||||
| 2026-02-06 | 13F | Handelsbanken Fonder AB | 24.300 | 0,00 | 1 | |||||
| 2026-02-13 | 13F | Caxton Associates Llp | 7.113 | -12,40 | 244 | 5,65 | ||||
| 2025-11-14 | 13F | Woodline Partners LP | 0 | -100,00 | 0 | -100,00 | ||||
| 2026-02-17 | 13F | Mirabella Financial Services Llp | 11.912 | 408 | ||||||
| 2026-02-13 | 13F | First Trust Advisors Lp | 47.465 | 1.628 | ||||||
| 2026-02-23 | 13F | Leonteq Securities AG | 0 | -100,00 | 0 | |||||
| 2026-02-13 | 13F | Squarepoint Ops LLC | Call | 12.500 | -67,70 | 429 | -61,09 | |||
| 2026-02-03 | 13F | SBI Securities Co., Ltd. | 405 | -78,02 | 14 | -75,00 | ||||
| 2026-02-13 | 13F | Squarepoint Ops LLC | 1.256.122 | 50,97 | 43.072 | 82,02 | ||||
| 2025-11-13 | 13F/A | Peak6 Llc | 0 | -100,00 | 0 | |||||
| 2026-01-30 | 13F | Turning Point Benefit Group, Inc. | 0 | -100,00 | 0 | |||||
| 2026-02-06 | 13F | TimesSquare Capital Management, LLC | 937.020 | 3,48 | 32.130 | 24,77 | ||||
| 2026-02-17 | 13F | Algert Global Llc | 42.020 | -57,06 | 1 | -50,00 | ||||
| 2026-02-05 | 13F | Stephens Inc /ar/ | 7.416 | 254 | ||||||
| 2026-04-17 | 13F | RFG Advisory, LLC | 0 | -100,00 | 0 | |||||
| 2026-02-11 | 13F | Los Angeles Capital Management Llc | 90.236 | 376,58 | 2.484 | 361,71 | ||||
| 2026-02-09 | 13F | Hartland & Co., LLC | 4.429 | 162,85 | 152 | 221,28 | ||||
| 2026-02-13 | 13F | Alyeska Investment Group, L.P. | 2.105.024 | 592,43 | 72.181 | 734,95 | ||||
| 2026-02-17 | 13F | Glenmede Trust Co Na | 394.669 | 21,41 | 13.533 | 15,39 | ||||
| 2026-02-17 | 13F | Oxford Asset Management Llp | 14.246 | 488 | ||||||
| 2026-02-11 | 13F | Deutsche Bank Ag\ | 654.839 | -60,25 | 22.454 | -52,07 | ||||
| 2026-02-11 | 13F | Parallel Advisors, LLC | 1.113 | -0,36 | 38 | 22,58 | ||||
| 2026-02-09 | 13F | Legal & General Group Plc | 85.681 | 4,50 | 2.938 | 26,04 | ||||
| 2025-11-14 | 13F | Holocene Advisors, LP | 0 | -100,00 | 0 | -100,00 | ||||
| 2026-02-13 | 13F | Stifel Financial Corp | 11.855 | 25,36 | 407 | 51,49 | ||||
| 2026-02-17 | 13F/A | Northwest & Ethical Investments L.P. | 19.800 | 689 | ||||||
| 2026-02-17 | 13F | Citadel Advisors Llc | 2.002.451 | 72,99 | 68.664 | 108,57 | ||||
| 2026-02-17 | 13F | Scopia Capital Management Lp | 293.405 | -57,41 | 10.061 | -48,66 | ||||
| 2026-02-17 | 13F | Citadel Advisors Llc | Put | 230.800 | 46,73 | 7.914 | 76,93 | |||
| 2026-02-17 | 13F | Raymond James Financial Inc | 86.415 | 64,01 | 2.963 | 97,80 | ||||
| 2026-02-17 | 13F | Citadel Advisors Llc | Call | 144.200 | -16,79 | 4.945 | 0,32 | |||
| 2026-04-14 | 13F | Prospera Financial Services Inc | 40.945 | 967 | ||||||
| 2026-02-13 | 13F | Headlands Technologies LLC | 75.065 | 48,19 | 2.574 | 78,68 | ||||
| 2026-02-11 | 13F | Cerity Partners LLC | 11.927 | 409 | ||||||
| 2026-02-17 | 13F | Northern Trust Corp | 751.894 | -0,03 | 25.782 | 20,53 | ||||
| 2026-02-13 | 13F | BNP Paribas Asset Management Holding S.A. | 1.071 | 51,70 | 0 | |||||
| 2026-02-12 | 13F | Federated Hermes, Inc. | 23.546 | -97,07 | 807 | -96,47 | ||||
| 2026-02-05 | 13F | Amalgamated Bank | 2.682 | 18,62 | 0 | |||||
| 2026-02-13 | 13F | Marshall Wace, Llp | 704.555 | 24.159 | ||||||
| 2026-02-17 | 13F | Cinctive Capital Management LP | 63.711 | 2.185 | ||||||
| 2026-02-17 | 13F | Susquehanna Fundamental Investments, Llc | 159.113 | 5.456 | ||||||
| 2026-02-17 | 13F | Sciencast Management LP | 9.557 | 328 | ||||||
| 2026-02-17 | 13F | Millennium Management Llc | Put | 0 | -100,00 | 0 | -100,00 | |||
| 2026-02-11 | 13F | Westfield Capital Management Co Lp | 2.187.275 | 0,43 | 75.002 | 21,09 | ||||
| 2026-02-06 | 13F | Gsa Capital Partners Llp | 9.908 | 0 | ||||||
| 2026-02-19 | 13F | Invesco Ltd. | 97.486 | 9,55 | 3.343 | 32,09 | ||||
| 2025-11-13 | 13F | Fuller & Thaler Asset Management, Inc. | 0 | -100,00 | 0 | -100,00 | ||||
| 2025-10-22 | 13F | Stanley-Laman Group, Ltd. | 0 | -100,00 | 0 | |||||
| 2025-11-07 | 13F | CenterBook Partners LP | 0 | -100,00 | 0 | |||||
| 2026-02-17 | 13F | T. Rowe Price Investment Management, Inc. | 450 | 0,00 | 0 | |||||
| 2026-02-06 | 13F | Covestor Ltd | 2.434 | -15,89 | 0 | |||||
| 2026-02-17 | 13F | Point72 Asset Management, L.P. | 3.088.652 | 935,66 | 105.910 | 1.148,78 | ||||
| 2026-02-10 | 13F | Envestnet Asset Management Inc | 43.966 | 296,81 | 1.508 | 378,41 | ||||
| 2026-02-17 | 13F | Royal Bank Of Canada | 19.766 | 63,46 | 678 | 97,09 | ||||
| 2026-02-17 | 13F | Cetera Investment Advisers | 6.465 | -26,83 | 222 | -11,95 | ||||
| 2026-01-28 | 13F | Klp Kapitalforvaltning As | 16.900 | 2,42 | 580 | 23,45 | ||||
| 2026-02-13 | 13F | SRS Capital Advisors, Inc. | 11 | -99,73 | 0 | -100,00 | ||||
| 2026-02-10 | 13F | Daiwa Securities Group Inc. | 1.228 | 0,00 | 0 | |||||
| 2025-11-13 | 13F | Landscape Capital Management, L.l.c. | 0 | -100,00 | 0 | |||||
| 2026-04-16 | 13F | Diversified Trust Co | 38.231 | 5,15 | 903 | -27,61 | ||||
| 2026-02-17 | 13F | Schonfeld Strategic Advisors LLC | 290.113 | -19,92 | 9.948 | -3,46 | ||||
| 2026-02-13 | 13F | ShawSpring Partners LLC | 1.473.005 | -20,30 | 50.509 | -3,91 | ||||
| 2025-11-13 | 13F | Hsbc Holdings Plc | 0 | -100,00 | 0 | -100,00 | ||||
| 2026-02-06 | 13F | Bare Financial Services, Inc | 18 | 0,00 | 1 | |||||
| 2026-02-12 | 13F | Jane Street Group, Llc | Call | 172.200 | 80,13 | 5.905 | 117,22 | |||
| 2026-02-12 | 13F | Jane Street Group, Llc | 14.031 | -66,64 | 481 | -59,78 | ||||
| 2026-02-12 | 13F | Jane Street Group, Llc | Put | 19.700 | -25,38 | 676 | -10,00 | |||
| 2026-02-11 | 13F | Sapphire Ventures, L.l.c. | 1.665.798 | 0,00 | 57.120 | 20,57 | ||||
| 2026-01-29 | 13F | Pictet Asset Management Holding SA | 12.926 | 16,44 | 443 | 40,63 | ||||
| 2026-02-13 | 13F | Manufacturers Life Insurance Company, The | 0 | -100,00 | 0 | |||||
| 2026-02-13 | 13F | Jacobs Levy Equity Management, Inc | 304.243 | -5,42 | 10.432 | 14,04 | ||||
| 2026-01-23 | 13F | Rede Wealth, LLC | 0 | -100,00 | 0 | |||||
| 2026-02-13 | 13F | Y-Intercept (Hong Kong) Ltd | 23.099 | 792 | ||||||
| 2026-02-09 | 13F | Huntington National Bank | 456 | 16 | ||||||
| 2026-02-13 | 13F | Wells Fargo & Company/mn | Call | 0 | -100,00 | 0 | -100,00 | |||
| 2025-11-06 | 13F | Versor Investments LP | 0 | -100,00 | 0 | |||||
| 2026-02-10 | 13F | State of Wyoming | 16.496 | 146,36 | 566 | 197,37 | ||||
| 2026-02-17 | 13F | Dark Forest Capital Management Lp | 0 | -100,00 | 0 | |||||
| 2026-02-17 | 13F | Creative Planning | 51.314 | 40,48 | 1.760 | 69,46 | ||||
| 2026-02-12 | 13F | Jasper Ridge Partners, L.P. | 49.327 | 0,00 | 1.691 | 20,61 | ||||
| 2026-02-13 | 13F | Rhumbline Advisers | 102.505 | -9,00 | 3.515 | 9,71 | ||||
| 2026-02-11 | 13F | Vestcor Inc | 100.000 | 33,33 | 3 | 50,00 | ||||
| 2026-02-13 | 13F | Police & Firemen's Retirement System of New Jersey | 23.081 | 5,04 | 791 | 26,76 | ||||
| 2026-02-09 | 13F | Lisanti Capital Growth, LLC | 119.030 | 4.082 | ||||||
| 2025-11-07 | 13F | State of New Jersey Common Pension Fund D | 0 | -100,00 | 0 | |||||
| 2026-02-13 | 13F | First Washington CORP | 222.997 | 7.647 | ||||||
| 2026-02-14 | 13F | Rockefeller Capital Management L.P. | 193.195 | 1.375,67 | 556 | 49,46 | ||||
| 2026-02-17 | 13F | Summit Partners Public Asset Management, Llc | Call | 300.000 | 30,43 | 10.287 | 57,27 | |||
| 2026-02-11 | 13F | Modus Advisors, LLC | 6.031 | 207 | ||||||
| 2026-02-17 | 13F | State Of Wisconsin Investment Board | 187.587 | 5,99 | 6.432 | 27,80 | ||||
| 2025-11-10 | 13F | Bridgewater Advisors Inc. | 0 | -100,00 | 0 | |||||
| 2026-02-17 | 13F | PharVision Advisers, LLC | 15.150 | 70,92 | 519 | 105,95 | ||||
| 2026-02-17 | 13F | Summit Partners Public Asset Management, Llc | 651.000 | 22.323 | ||||||
| 2026-02-13 | 13F | Kettle Hill Capital Management, Llc | 747.715 | 25.639 | ||||||
| 2026-02-11 | 13F | Group One Trading, L.p. | 7.464 | 42,55 | 256 | 72,30 | ||||
| 2026-02-13 | 13F | Healthcare Of Ontario Pension Plan Trust Fund | 346.793 | 11.892 | ||||||
| 2026-02-17 | 13F | Capital Fund Management S.a. | Call | 13.400 | -20,71 | 459 | -4,37 | |||
| 2025-11-06 | 13F | Assetmark, Inc | 0 | -100,00 | 0 | -100,00 | ||||
| 2026-02-13 | 13F | Macquarie Group Ltd | 0 | -100,00 | 0 | |||||
| 2026-02-17 | 13F | California State Teachers Retirement System | 75.850 | 7,92 | 2.601 | 30,13 | ||||
| 2026-01-29 | 13F | IMC-Chicago, LLC | 0 | -100,00 | 0 | |||||
| 2026-02-13 | 13F | FORA Capital, LLC | 0 | -100,00 | 0 | |||||
| 2025-11-07 | 13F | HighTower Advisors, LLC | 0 | -100,00 | 0 | |||||
| 2025-11-13 | 13F | Arrowstreet Capital, Limited Partnership | 0 | -100,00 | 0 | |||||
| 2026-02-13 | 13F | Public Employees Retirement Association Of Colorado | 7.069 | 0,00 | 0 | |||||
| 2026-01-29 | 13F | Cornerstone Investment Partners, LLC | 6.237 | 214 | ||||||
| 2025-11-14 | 13F | CastleKnight Management LP | Call | 0 | -100,00 | 0 | -100,00 | |||
| 2026-02-10 | 13F | Quantbot Technologies LP | 18.545 | 222,75 | 636 | 289,57 | ||||
| 2026-02-13 | 13F | Kestra Advisory Services, LLC | 5.317 | 182 | ||||||
| 2026-02-17 | 13F | Ameriprise Financial Inc | 622.639 | 33,44 | 21.350 | 60,89 | ||||
| 2026-04-08 | 13F | Wealth Enhancement Advisory Services, Llc | 31.888 | 159,27 | 755 | 95,60 | ||||
| 2026-02-13 | 13F | Ieq Capital, Llc | 274.336 | 1,71 | 9.407 | 22,63 | ||||
| 2026-01-30 | 13F | Keybank National Association/oh | 15.059 | 0,01 | 516 | 20,56 | ||||
| 2026-01-26 | 13F | KBC Group NV | 2.929 | 0,00 | 0 | |||||
| 2026-02-10 | 13F | Godfrey Financial Associates, Inc. | 50 | 2 | ||||||
| 2026-02-13 | 13F | Walleye Capital LLC | 330.354 | 158,62 | 11.328 | 211,87 | ||||
| 2026-02-17 | 13F | Canada Pension Plan Investment Board | 455.500 | 2,04 | 15.619 | 23,03 | ||||
| 2026-02-13 | 13F | Archon Capital Management LLC | 0 | -100,00 | 0 | |||||
| 2026-01-29 | 13F | Comerica Bank | 689 | -99,45 | 24 | -99,35 | ||||
| 2026-02-11 | 13F | Ameritas Investment Partners, Inc. | 6.929 | 238 | ||||||
| 2026-02-13 | 13F | Champlain Investment Partners, LLC | 0 | -100,00 | 0 | |||||
| 2026-02-17 | 13F | Aster Capital Management (DIFC) Ltd | 1.089 | 5,93 | 37 | 27,59 | ||||
| 2026-02-10 | 13F | Waterloo Capital, L.P. | 24.225 | 0,10 | 831 | 20,64 | ||||
| 2026-02-17 | 13F | Cresset Asset Management, LLC | 80.901 | 0,00 | 2.774 | 20,61 | ||||
| 2026-02-13 | 13F | Walleye Capital LLC | Call | 3.700 | 12,12 | 127 | 35,48 | |||
| 2026-02-17 | 13F | Bank Of America Corp /de/ | 1.359.054 | 0,58 | 46.602 | 21,27 | ||||
| 2026-02-06 | 13F | EverSource Wealth Advisors, LLC | 824 | 82,30 | 28 | 133,33 | ||||
| 2026-02-13 | 13F | Walleye Capital LLC | Put | 10.800 | -40,98 | 370 | -28,85 | |||
| 2026-02-17 | 13F | Janus Henderson Group Plc | 33.004 | 0,00 | 1.132 | 20,58 | ||||
| 2026-02-13 | 13F | Bullseye Asset Management LLC | 152.608 | 96,64 | 5 | 150,00 | ||||
| 2026-02-17 | 13F | Amundi | 27.963 | -4,71 | 959 | 12,84 | ||||
| 2026-02-13 | 13F | Aigen Investment Management, Lp | 9.442 | 324 | ||||||
| 2025-11-14 | 13F | Susquehanna Portfolio Strategies, LLC | 0 | -100,00 | 0 | -100,00 |