Grundlæggende statistik
| Institutionelle aktier (lange) | 101.999.146 - 46,19% (ex 13D/G) - change of -13,64MM shares -11,79% MRQ |
| Institutionel værdi (lang) | $ 779.093 USD ($1000) |
Institutionelt ejerskab og aktionærer
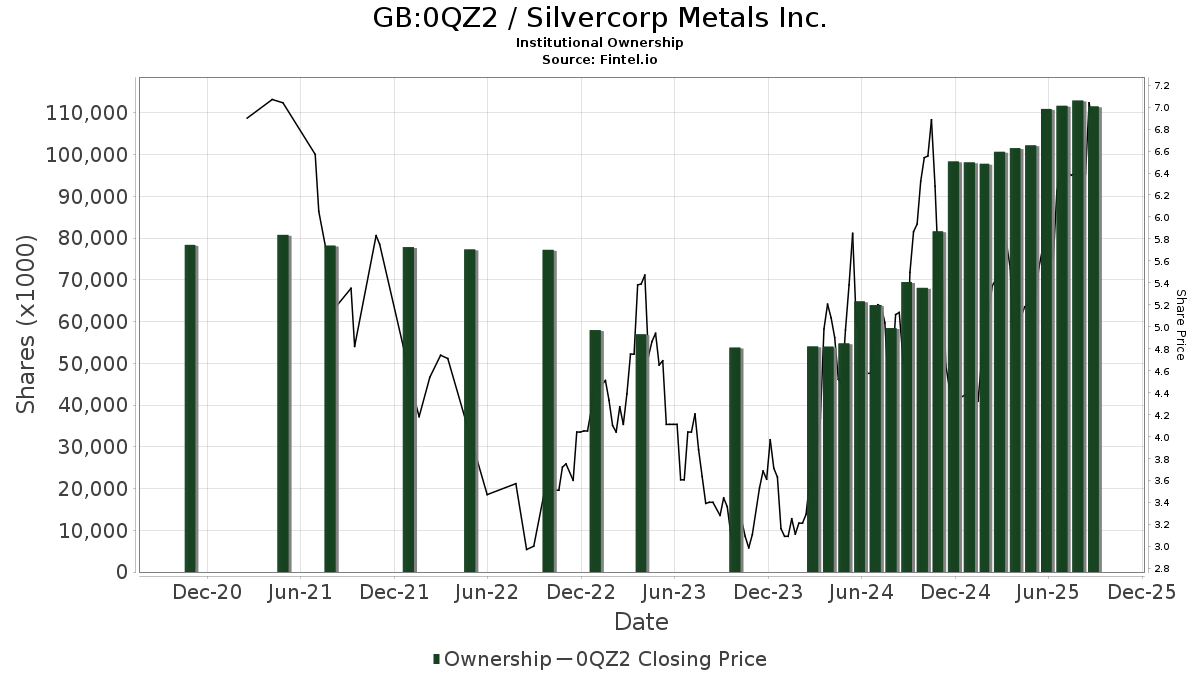
Silvercorp Metals Inc. (GB:0QZ2) har 176 institutionelle ejere og aktionærer, der har indsendt 13D/G- eller 13F-formularer til Securities Exchange Commission (SEC). Disse institutioner har i alt 101,999,146 aktier. Største aktionærer omfatter Toroso Investments, LLC, MIRAE ASSET GLOBAL ETFS HOLDINGS Ltd., Arrowstreet Capital, Limited Partnership, Van Eck Associates Corp, BlackRock, Inc., Morgan Stanley, Baillie Gifford & Co, Alps Advisors Inc, Connor, Clark & Lunn Investment Management Ltd., and Two Sigma Advisers, Lp .
Silvercorp Metals Inc. (LSE:0QZ2) institutionel ejerskabsstruktur viser aktuelle positioner i virksomheden efter institutioner og fonde, samt seneste ændringer i positionsstørrelse. Større aktionærer kan omfatte individuelle investorer, investeringsforeninger, hedgefonde eller institutioner. Skema 13D angiver, at investoren besidder (eller besidder) mere end 5 % af virksomheden og har til hensigt (eller har til hensigt at) aktivt at forfølge en ændring i forretningsstrategi. Skema 13G indikerer en passiv investering på over 5%.
The share price as of April 27, 2026 is 16,81 / share. Previously, on April 30, 2025, the share price was 5,18 / share. This represents an increase of 224,52% over that period.
Fondens stemningsscore
Fund Sentiment Score (fka Ownership Accumulation Score) finder de aktier, der bliver mest købt af fonde. Det er resultatet af en sofistikeret, multi-faktor kvantitativ model, der identificerer virksomheder med de højeste niveauer af institutionel akkumulering. Scoringsmodellen bruger en kombination af den samlede stigning i oplyste ejere, ændringerne i porteføljeallokeringer i disse ejere og andre målinger. Tallet går fra 0 til 100, hvor højere tal indikerer et højere niveau af akkumulering for sine jævnaldrende, og 50 er gennemsnittet.
Opdateringsfrekvens: Dagligt
Se Ownership Explorer, som giver en liste over højest rangerende virksomheder.
AI+ Ask Fintel’s AI assistant about Silvercorp Metals Inc..
Select a question to share a public post with an AI-crafted answer.
Thinking of good questions…
13F og NPORT arkivering
Detaljer om 13F-arkivering er gratis. Detaljer om NP-ansøgninger kræver et premium-medlemskab. Grønne rækker angiver nye positioner. Røde rækker angiver lukkede positioner. Klik på linket ikon for at se den fulde transaktionshistorik.
Opgrader
for at låse premium-data op og eksportere til Excel ![]() .
.
| Fil dato | Kilde | Investor | Type | Gennemsnitlig pris (Øst) |
Aktier | Δ Aktier (%) |
Rapporteret Værdi ($1000) |
Δ Værdi (%) |
Port Alloc (%) |
|
|---|---|---|---|---|---|---|---|---|---|---|
| 2026-02-17 | 13F | Jones Financial Companies Lllp | 191 | 2 | ||||||
| 2026-02-12 | 13F | Bank Of Montreal /can/ | 657.108 | 6.287,75 | 5.496 | 8.487,50 | ||||
| 2026-02-17 | 13F | SIG North Trading, ULC | 227.139 | 239,32 | 1.894 | 347,75 | ||||
| 2026-04-20 | 13F | Banque Cantonale Vaudoise | 6.402 | 69 | ||||||
| 2026-02-17 | 13F | SIG North Trading, ULC | Put | 36.600 | -23,91 | 305 | 0,66 | |||
| 2026-02-17 | 13F | SIG North Trading, ULC | Call | 67.700 | -62,70 | 565 | -50,83 | |||
| 2026-04-20 | 13F | Ronald Blue Trust, Inc. | 514 | -3,20 | 6 | 25,00 | ||||
| 2026-01-12 | 13F | Seacrest Wealth Management, Llc | 0 | -100,00 | 0 | |||||
| 2026-01-13 | 13F | Stonehage Fleming Financial Services Holdings Ltd | 0 | -100,00 | 0 | -100,00 | ||||
| 2026-01-27 | 13F | Evergreen Capital Management Llc | 25.471 | 0,00 | 212 | 32,50 | ||||
| 2026-02-12 | 13F | Sprott Inc. | 255.683 | -80,35 | 2.132 | -74,03 | ||||
| 2026-01-29 | 13F | IMC-Chicago, LLC | 35.449 | 296 | ||||||
| 2026-02-12 | 13F | Nuveen, LLC | 162.896 | 0,00 | 1.364 | 32,81 | ||||
| 2026-02-17 | 13F | Toronto Dominion Bank | Put | 0 | -100,00 | 0 | -100,00 | |||
| 2026-01-29 | 13F | IMC-Chicago, LLC | Put | 47.000 | 392 | |||||
| 2026-01-29 | 13F | IMC-Chicago, LLC | Call | 59.200 | -29,94 | 494 | -7,68 | |||
| 2026-02-17 | 13F | Parvin Asset Management, LLC | 204.050 | -1,71 | 1.702 | 29,65 | ||||
| 2026-01-30 | 13F | Caldwell Securities, Inc | 4.000 | -27,27 | 33 | -2,94 | ||||
| 2026-02-13 | 13F | Dynamic Technology Lab Private Ltd | 76.238 | 648,90 | 636 | 893,75 | ||||
| 2026-02-17 | 13F | Alliancebernstein L.p. | 27.891 | 0,18 | 233 | 32,57 | ||||
| 2026-02-17 | 13F | Graham Capital Management, L.P. | 18.052 | 62,92 | 151 | 114,29 | ||||
| 2025-11-14 | 13F | AXA Investment Managers S.A. | 34.042 | 215 | ||||||
| 2026-02-17 | 13F | Weiss Asset Management LP | 0 | -100,00 | 0 | -100,00 | ||||
| 2026-02-12 | 13F | Quadrant Capital Group Llc | 3.471 | 0,00 | 29 | 33,33 | ||||
| 2026-02-13 | 13F | Public Sector Pension Investment Board | 12.700 | 106 | ||||||
| 2026-02-17 | 13F | Royal Bank Of Canada | 439.408 | -16,53 | 3.665 | 10,16 | ||||
| 2026-02-13 | 13F | Glen Eagle Advisors, LLC | 0 | -100,00 | 0 | -100,00 | ||||
| 2026-04-07 | 13F | CoreCap Advisors, LLC | 7.150 | 0,00 | 77 | 28,81 | ||||
| 2026-02-17 | 13F | Man Group plc | 872.179 | 7.274 | ||||||
| 2026-02-17 | 13F | Blair William & Co/il | 100.000 | 0,00 | 834 | 31,96 | ||||
| 2026-01-27 | 13F | TD Waterhouse Canada Inc. | 7.374 | 22,90 | 62 | 56,41 | ||||
| 2026-02-17 | 13F | Advisor Group Holdings, Inc. | 40.283 | 70,23 | 336 | 151,88 | ||||
| 2026-01-26 | 13F | Asset Dedication, LLC | 1.043 | 0,00 | 9 | 33,33 | ||||
| 2026-02-09 | 13F | Hartland & Co., LLC | 2.000 | 17 | ||||||
| 2026-02-10 | 13F | CIBC World Markets Inc. | 12.602 | -48,91 | 105 | -32,26 | ||||
| 2026-02-13 | 13F | American Century Companies Inc | 184.833 | -67,99 | 1.546 | -57,65 | ||||
| 2026-02-17 | 13F | Creative Planning | 37.115 | -2,46 | 310 | 28,75 | ||||
| 2025-11-14 | 13F | Centiva Capital, LP | 0 | -100,00 | 0 | -100,00 | ||||
| 2026-02-17 | 13F/A | Northwest & Ethical Investments L.P. | 24.820 | 36,60 | 208 | 81,58 | ||||
| 2026-04-28 | 13F | Alberta Investment Management Corp | 59.228 | 637 | ||||||
| 2026-02-13 | 13F | Squarepoint Ops LLC | 39.009 | 325 | ||||||
| 2026-02-17 | 13F | Oxford Asset Management Llp | 85.148 | 371,00 | 710 | 1.214,81 | ||||
| 2026-02-17 | 13F | Bank Of America Corp /de/ | 777.166 | 149,87 | 6.482 | 229,82 | ||||
| 2026-02-17 | 13F | Algert Global Llc | 23.875 | 0,53 | 0 | -100,00 | ||||
| 2026-02-06 | 13F/A | Rathbone Brothers plc | 10.575 | 0,00 | 89 | 33,33 | ||||
| 2026-03-06 | 13F | Hsbc Holdings Plc | 10.184 | 86 | ||||||
| 2026-02-10 | 13F | CIBC Asset Management Inc | 201.531 | 1.687 | ||||||
| 2026-02-13 | 13F | Toroso Investments, LLC | 10.844.406 | -1,11 | 90.442 | 30,50 | ||||
| 2026-04-09 | 13F | Towarzystwo Funduszy Inwestycyjnych Allianz Polska S.A. | 88.000 | -41,72 | 944 | -27,10 | ||||
| 2026-02-12 | 13F | Hollencrest Capital Management | 140.900 | 0,00 | 1.175 | 32,02 | ||||
| 2026-02-09 | 13F | Themes Management Co LLC | 29.281 | 245 | ||||||
| 2026-02-12 | 13F | Alps Advisors Inc | 3.767.118 | 47,57 | 31.418 | 94,74 | ||||
| 2026-02-09 | 13F | Legal & General Group Plc | 193.417 | 2,23 | 1.620 | 35,71 | ||||
| 2026-02-13 | 13F | Citigroup Inc | 60.097 | 513,55 | 503 | 724,59 | ||||
| 2026-02-18 | 13F | Caitlin John, LLC | 0 | -100,00 | 0 | -100,00 | ||||
| 2026-02-17 | 13F | Jain Global LLC | 21.642 | 180 | ||||||
| 2026-02-17 | 13F | Keebeck Alpha, LP | 22.676 | 189 | ||||||
| 2026-02-11 | 13F | Parallel Advisors, LLC | 312 | 0,00 | 3 | 100,00 | ||||
| 2026-02-18 | 13F | Mackenzie Financial Corp | 231.751 | 88,86 | 1.982 | 156,40 | ||||
| 2026-02-12 | 13F | Campbell & CO Investment Adviser LLC | 37.692 | 27,32 | 314 | 67,91 | ||||
| 2026-01-23 | 13F | LOM Asset Management Ltd | 157.000 | 1.802 | ||||||
| 2026-02-17 | 13F | Toronto Dominion Bank | 147.098 | 285,30 | 1.230 | 412,50 | ||||
| 2025-11-14 | 13F | Wolverine Trading, Llc | Call | 0 | -100,00 | 0 | -100,00 | |||
| 2026-02-17 | 13F | Toronto Dominion Bank | Call | 1.000 | -66,67 | 8 | -55,56 | |||
| 2025-11-14 | 13F | SWAN Capital LLC | 0 | -100,00 | 0 | |||||
| 2026-04-24 | 13F | TT International Asset Management LTD | 70.000 | 752 | ||||||
| 2025-11-14 | 13F | Wolverine Trading, Llc | 0 | -100,00 | 0 | -100,00 | ||||
| 2026-02-13 | 13F | Vontobel Holding Ltd. | 368.567 | 0,00 | 3.083 | 32,62 | ||||
| 2026-01-27 | 13F | Proffitt & Goodson Inc | 450 | 0,00 | 4 | 50,00 | ||||
| 2026-02-13 | 13F | Aigen Investment Management, Lp | 29.555 | -58,39 | 324 | -43,13 | ||||
| 2026-02-17 | 13F | Prelude Capital Management, Llc | 22.676 | 189 | ||||||
| 2026-04-20 | 13F | Dagco, Inc. | 607 | 0,00 | 7 | 20,00 | ||||
| 2025-11-12 | 13F | Group One Trading, L.p. | 0 | -100,00 | 0 | -100,00 | ||||
| 2026-04-29 | 13F | Skopos Labs, Inc. | 38.473 | -9,24 | 413 | 18,00 | ||||
| 2026-02-10 | 13F | Goldman Sachs Group Inc | 674.147 | -61,13 | 5.622 | -48,71 | ||||
| 2026-02-17 | 13F | MIRAE ASSET GLOBAL ETFS HOLDINGS Ltd. | 10.212.748 | 11,76 | 85.532 | 48,33 | ||||
| 2026-02-12 | 13F | BlackRock, Inc. | 5.565.875 | 187,09 | 46.419 | 278,87 | ||||
| 2026-02-13 | 13F | Van Eck Associates Corp | 6.845.803 | 29,57 | 57 | 72,73 | ||||
| 2026-02-18 | 13F | Vident Advisory, LLC | 68.739 | -84,10 | 573 | -79,02 | ||||
| 2026-02-12 | 13F | Andina Capital Management, LLC | 0 | -100,00 | 0 | -100,00 | ||||
| 2026-02-13 | 13F | Motiv8 Investments LLC | 300 | 0 | ||||||
| 2026-02-11 | 13F | Group One Trading, L.p. | Put | 83.900 | -26,60 | 700 | -3,19 | |||
| 2026-02-11 | 13F | Group One Trading, L.p. | Call | 371.400 | 2,46 | 3.097 | 35,18 | |||
| 2025-11-14 | 13F | Point72 (DIFC) Ltd | 29.345 | 185 | ||||||
| 2026-02-18 | 13F | Zazove Associates Llc | 68.700 | 77 | ||||||
| 2026-02-13 | 13F | Y-Intercept (Hong Kong) Ltd | 0 | -100,00 | 0 | -100,00 | ||||
| 2026-02-10 | 13F | Bnp Paribas Arbitrage, Sa | 1.711.412 | 57,08 | 14.273 | 107,31 | ||||
| 2026-02-13 | 13F | Arrowstreet Capital, Limited Partnership | 9.243.477 | 238,33 | 77.244 | 348,18 | ||||
| 2026-01-26 | 13F | Merit Financial Group, LLC | 0 | -100,00 | 0 | -100,00 | ||||
| 2026-02-19 | 13F | Invesco Ltd. | 0 | -100,00 | 0 | -100,00 | ||||
| 2026-02-11 | 13F | Picton Mahoney Asset Management | 46.921 | -50,89 | 393 | |||||
| 2026-02-12 | 13F | Adviser Investments LLC | 26.025 | 0,00 | 217 | 32,32 | ||||
| 2026-02-12 | 13F | Swiss National Bank | 433.000 | 3,51 | 3.629 | 37,46 | ||||
| 2026-02-12 | 13F | Federation des caisses Desjardins du Quebec | 14.126 | 0,00 | 118 | 32,95 | ||||
| 2026-02-10 | 13F/A | Northwestern Mutual Wealth Management Co | 5 | 0 | ||||||
| 2026-04-08 | 13F | Wealth Enhancement Advisory Services, Llc | 0 | -100,00 | 0 | |||||
| 2026-02-17 | 13F | Credit Agricole S A | 154.443 | 1.288 | ||||||
| 2025-11-14 | 13F | Nomura Holdings Inc | 0 | -100,00 | 0 | -100,00 | ||||
| 2026-04-15 | 13F | Brady Martz Wealth Solutions, LLC | 16.715 | 46,67 | 180 | 88,42 | ||||
| 2026-01-27 | 13F | Zurcher Kantonalbank (Zurich Cantonalbank) | 82.467 | 16,12 | 691 | 54,02 | ||||
| 2026-02-11 | 13F | J.w. Cole Advisors, Inc. | 0 | -100,00 | 0 | |||||
| 2026-02-17 | 13F | Citadel Advisors Llc | Call | 178.700 | -19,50 | 1.490 | 6,20 | |||
| 2026-02-17 | 13F | Citadel Advisors Llc | 1.536.849 | -57,22 | 12.817 | -43,54 | ||||
| 2026-02-17 | 13F | Citadel Advisors Llc | Put | 176.500 | 0,17 | 1.472 | 32,26 | |||
| 2026-02-17 | 13F | D. E. Shaw & Co., Inc. | 208.800 | -56,74 | 1.747 | -42,64 | ||||
| 2026-04-08 | 13F | First Heartland Consultants, Inc. | 0 | -100,00 | 0 | |||||
| 2026-02-10 | 13F | Rothschild Investment Llc | 700 | 0,00 | 6 | 25,00 | ||||
| 2026-01-27 | 13F | Fiscal Wisdom Wealth Management, LLC | 268.373 | -39,85 | 2.238 | -21,11 | ||||
| 2026-01-29 | 13F | Vanguard Group Inc | 187.506 | 0,00 | 1.568 | 32,66 | ||||
| 2026-02-17 | 13F | DZ BANK AG Deutsche Zentral Genossenschafts Bank, Frankfurt am Main | 2.200.000 | -12,00 | 18.348 | 16,36 | ||||
| 2026-02-17 | 13F | XTX Topco Ltd | 88.341 | 280,67 | 737 | 404,11 | ||||
| 2026-02-13 | 13F | DLD Asset Management, LP | Put | 100.000 | 834 | |||||
| 2025-11-14 | 13F | Cubist Systematic Strategies, LLC | 65.747 | 415 | ||||||
| 2026-04-15 | 13F | Cypress Wealth Services, LLC | 14.062 | -31,06 | 151 | -11,18 | ||||
| 2026-02-03 | 13F | McIlrath & Eck, LLC | 1.545 | 0,00 | 13 | 33,33 | ||||
| 2026-02-17 | 13F | Investment Management Corp of Ontario | 26.800 | 224 | ||||||
| 2026-02-17 | 13F/A | Cantor Fitzgerald, L. P. | 0 | -100,00 | 0 | -100,00 | ||||
| 2026-02-11 | 13F | Metis Global Partners, LLC | 24.468 | 0,00 | 205 | 32,47 | ||||
| 2026-04-20 | 13F | Sowell Financial Services LLC | 20.777 | 0,00 | 223 | 28,90 | ||||
| 2026-02-17 | 13F | Susquehanna Advisors Group, Inc. | 326.100 | 2.720 | ||||||
| 2026-02-10 | 13F | Connor, Clark & Lunn Investment Management Ltd. | 3.483.113 | 2,40 | 29.132 | 35,78 | ||||
| 2026-02-13 | 13F | Eschler Asset Management LLP | 0 | -100,00 | 0 | -100,00 | ||||
| 2026-02-17 | 13F | Cetera Investment Advisers | 27.748 | 87,17 | 231 | 148,39 | ||||
| 2026-02-10 | 13F | Quantbot Technologies LP | 674.460 | 55,13 | 5.625 | 104,73 | ||||
| 2026-02-17 | 13F | Garden State Investment Advisory Services LLC | 11.218 | 94 | ||||||
| 2026-04-21 | 13F | PharVision Advisers, LLC | 0 | -100,00 | 0 | |||||
| 2026-02-05 | 13F | Cambridge Investment Research Advisors, Inc. | 105.455 | 25,07 | 1 | |||||
| 2026-02-17 | 13F | Balyasny Asset Management Llc | 353.243 | 2.954 | ||||||
| 2025-11-14 | 13F | Point72 Asia (Singapore) Pte. Ltd. | 38.068 | 241 | ||||||
| 2026-04-20 | 13F | Morton Brown Family Wealth, LLC | 13 | 85,71 | 0 | |||||
| 2026-02-11 | 13F | Jpmorgan Chase & Co | 354.855 | -62,41 | 2.959 | -50,39 | ||||
| 2026-02-17 | 13F | Qube Research & Technologies Ltd | 88.150 | -55,87 | 735 | -41,76 | ||||
| 2026-02-17 | 13F | Amundi | 162.681 | 17,78 | 1.357 | 37,25 | ||||
| 2026-01-20 | 13F | AdvisorNet Financial, Inc | 0 | -100,00 | 0 | |||||
| 2026-02-06 | 13F | Auxano Advisors, LLC | 280.000 | 2.335 | ||||||
| 2026-04-21 | 13F | Decker Retirement Planning Inc. | 165 | 2 | ||||||
| 2026-02-02 | 13F | Wolverine Asset Management Llc | Put | 0 | -100,00 | 0 | -100,00 | |||
| 2026-02-03 | 13F | Ballentine Partners, LLC | 12.765 | 2,84 | 106 | 35,90 | ||||
| 2026-02-09 | 13F | Catalyst Funds Management Pty Ltd | 0 | -100,00 | 0 | -100,00 | ||||
| 2026-04-07 | 13F | Farther Finance Advisors, LLC | 623 | 0,00 | 7 | 20,00 | ||||
| 2026-04-16 | 13F | SG Americas Securities, LLC | 277.449 | 3 | ||||||
| 2026-04-28 | 13F | Golden State Wealth Management, LLC | 1.070 | 11 | ||||||
| 2026-04-28 | 13F | DGS Capital Management, LLC | 24.428 | -5,83 | 262 | 21,30 | ||||
| 2026-02-12 | 13F | Marex Group plc | 0 | -100,00 | 0 | -100,00 | ||||
| 2026-02-13 | 13F | Ieq Capital, Llc | 10.034 | 0,11 | 84 | 31,75 | ||||
| 2026-01-23 | 13F | Baillie Gifford & Co | 4.221.271 | 35.248 | ||||||
| 2026-02-09 | 13F | Fidelis Capital Partners, LLC | 50.000 | 0,00 | 417 | 31,96 | ||||
| 2026-02-13 | 13F | JustInvest LLC | 31.965 | 8,27 | 267 | 43,01 | ||||
| 2025-11-07 | 13F | Shell Asset Management Co | 3.253 | -70,09 | 0 | |||||
| 2026-02-11 | 13F | LPL Financial LLC | 94.550 | 28,59 | 789 | 69,83 | ||||
| 2026-02-17 | 13F | Tower Research Capital LLC (TRC) | 14.543 | -7,45 | 121 | 22,22 | ||||
| 2026-02-17 | 13F | Point72 Asset Management, L.P. | Call | 56.100 | 468 | |||||
| 2026-02-09 | 13F | Employees Retirement System of Texas | 7.310 | 0 | ||||||
| 2026-02-17 | 13F | Guggenheim Capital Llc | 257.086 | -6,01 | 2.144 | 24,07 | ||||
| 2026-02-05 | 13F | Allworth Financial LP | 1.073 | 136,87 | 9 | 300,00 | ||||
| 2026-02-13 | 13F | National Bank Of Canada /fi/ | Call | 20 | -78,72 | 17 | -72,88 | |||
| 2026-02-17 | 13F | Engineers Gate Manager LP | 172.909 | 1.442 | ||||||
| 2026-02-11 | 13F | Simplex Trading, Llc | Call | 106.000 | -63,10 | 884 | 88.300,00 | |||
| 2026-04-13 | 13F | IFP Advisors, Inc | 488 | 5 | ||||||
| 2026-02-11 | 13F | Simplex Trading, Llc | Put | 71.900 | -6,87 | 600 | ||||
| 2026-02-13 | 13F | National Bank Of Canada /fi/ | 138.407 | 1.157 | ||||||
| 2026-02-11 | 13F | Simplex Trading, Llc | 71.788 | -2,61 | 599 | |||||
| 2025-11-14 | 13F | Luminist Capital LLC | 0 | -100,00 | 0 | -100,00 | ||||
| 2026-01-28 | 13F | U S Global Investors Inc | 250.000 | -84,00 | 2.085 | -78,89 | ||||
| 2026-04-16 | 13F | SG Americas Securities, LLC | Put | 173.100 | 0 | |||||
| 2026-02-06 | 13F | EverSource Wealth Advisors, LLC | 7.503 | 18,47 | 63 | 55,00 | ||||
| 2026-02-10 | 13F | Td Asset Management Inc | 680.782 | 157,03 | 5.702 | 241,17 | ||||
| 2026-02-13 | 13F | Manufacturers Life Insurance Company, The | 222.210 | 887,60 | 1.862 | 1.210,56 | ||||
| 2026-02-17 | 13F | ExodusPoint Capital Management, LP | 0 | -100,00 | 0 | -100,00 | ||||
| 2026-02-17 | 13F | Point72 Asset Management, L.P. | 0 | -100,00 | 0 | -100,00 | ||||
| 2025-11-12 | 13F | Us Bancorp \de\ | 0 | -100,00 | 0 | -100,00 | ||||
| 2026-02-17 | 13F | Orion Resource Partners LP | 359.004 | 244,08 | 3.003 | 356,23 | ||||
| 2026-02-09 | 13F | Geode Capital Management, Llc | 149.818 | 11,58 | 1.279 | 51,72 | ||||
| 2026-02-17 | 13F | Two Sigma Investments, Lp | 1.867.147 | 1.174,81 | 15.572 | 1.583,46 | ||||
| 2026-02-11 | 13F | Tradition Wealth Management, LLC | 22.546 | 29,23 | 188 | 70,91 | ||||
| 2026-02-13 | 13F | Great West Life Assurance Co /can/ | 330.512 | 56,63 | 3 | 100,00 | ||||
| 2026-02-13 | 13F | Wells Fargo & Company/mn | 5.958 | -7,73 | 50 | 22,50 | ||||
| 2026-02-13 | 13F | Morgan Stanley | 4.692.989 | 77,17 | 39.140 | 133,79 | ||||
| 2025-11-12 | 13F | Bellwether Advisors, LLC | 0 | -100,00 | 0 | |||||
| 2026-02-17 | 13F | PDT Partners, LLC | 666.129 | 859,62 | 5.556 | 1.168,26 | ||||
| 2026-02-11 | 13F | Buckingham Strategic Partners | 13.206 | 110 | ||||||
| 2026-02-17 | 13F | 683 Capital Management, LLC | 200.000 | -38,46 | 1.668 | -18,79 | ||||
| 2026-02-17 | 13F | New Vernon Capital Holdings II LLC | 12.087 | 0,00 | 139 | 81,58 | ||||
| 2025-12-18 | 13F | Danske Bank A/s | 0 | -100,00 | 0 | |||||
| 2026-02-17 | 13F | Lazard Asset Management Llc | 51.622 | -24,91 | 432 | -0,46 | ||||
| 2026-02-13 | 13F | BRITISH COLUMBIA INVESTMENT MANAGEMENT Corp | 116.116 | 971 | ||||||
| 2026-02-09 | 13F | Harbour Investments, Inc. | 15.125 | -35,30 | 126 | -14,29 | ||||
| 2026-02-13 | 13F | OMERS ADMINISTRATION Corp | 0 | -100,00 | 0 | -100,00 | ||||
| 2026-02-11 | 13F | Deutsche Bank Ag\ | 37.360 | 43,57 | 312 | 89,63 | ||||
| 2026-04-27 | 13F | Leonteq Securities AG | 7.350 | 110 | ||||||
| 2026-02-12 | 13F | Hrt Financial Lp | 44.654 | 0 | ||||||
| 2026-02-13 | 13F | Kestra Advisory Services, LLC | 10.799 | 90 | ||||||
| 2026-02-12 | 13F | Jane Street Group, Llc | Call | 90.500 | 298,68 | 755 | 427,27 | |||
| 2026-02-17 | 13F | Schonfeld Strategic Advisors LLC | 0 | -100,00 | 0 | |||||
| 2026-02-12 | 13F | Jane Street Group, Llc | 1.574.304 | -13,59 | 13.130 | 14,04 | ||||
| 2026-01-28 | 13F | Geneos Wealth Management Inc. | 1.180 | 0,00 | 10 | 28,57 | ||||
| 2026-02-12 | 13F | Jane Street Group, Llc | Put | 39.700 | 331 | |||||
| 2026-02-13 | 13F | Pine Valley Investments Ltd Liability Co | 22.100 | -32,00 | 184 | -10,24 | ||||
| 2026-01-26 | 13F | Welch Group, LLC | 0 | -100,00 | 0 | -100,00 | ||||
| 2026-02-17 | 13F | Jump Financial, LLC | 0 | -100,00 | 0 | -100,00 | ||||
| 2025-11-14 | 13F | Ubs Asset Management Americas Inc | 0 | -100,00 | 0 | -100,00 | ||||
| 2026-02-13 | 13F | Quarry LP | 1.615 | -96,80 | 13 | -95,92 | ||||
| 2026-02-17 | 13F | Russell Investments Group, Ltd. | 94.648 | 31,73 | 793 | 74,83 | ||||
| 2026-04-22 | 13F | Pictet Asset Management Holding SA | 67.391 | -54,09 | 722 | -41,25 | ||||
| 2026-02-12 | 13F | CIBC Private Wealth Group, LLC | 712 | 0,00 | 6 | 25,00 | ||||
| 2026-02-13 | 13F | Verition Fund Management LLC | 130.490 | 1.088 | ||||||
| 2026-01-29 | 13F | UBS Group AG | 2.774.715 | -1,06 | 23.141 | 30,56 | ||||
| 2026-02-17 | 13F | Susquehanna International Group, Llp | Put | 163.000 | -36,99 | 1.359 | -16,83 | |||
| 2026-02-17 | 13F | Susquehanna International Group, Llp | Call | 307.400 | 24,76 | 2.564 | 64,61 | |||
| 2026-02-10 | 13F | Acadian Asset Management Llc | 1.154.000 | 343,85 | 10 | 800,00 | ||||
| 2026-02-17 | 13F | Boothbay Fund Management, Llc | 36.765 | 307 | ||||||
| 2026-02-17 | 13F | Two Sigma Advisers, Lp | 3.322.900 | 25,11 | 27.713 | 65,10 | ||||
| 2026-02-13 | 13F | Barclays Plc | 17.720 | 195,93 | 148 | 297,30 | ||||
| 2025-11-14 | 13F | Axa S.a. | 0 | -100,00 | 0 | -100,00 | ||||
| 2026-02-17 | 13F | Crabel Capital Management, LLC | 0 | -100,00 | 0 | -100,00 | ||||
| 2026-02-17 | 13F | Ameriprise Financial Inc | 32.139 | -2,13 | 268 | 29,47 | ||||
| 2026-02-17 | 13F | IHT Wealth Management, LLC | 0 | -100,00 | 0 | -100,00 | ||||
| 2026-02-13 | 13F | Blueshift Asset Management, LLC | 0 | -100,00 | 0 | |||||
| 2026-02-17 | 13F | Brevan Howard Capital Management LP | 48.720 | -9,97 | 406 | 18,71 | ||||
| 2026-03-03 | 13F/A | Caitong International Asset Management Co., Ltd | 9.777 | 82 | ||||||
| 2026-02-13 | 13F | Smartleaf Asset Management LLC | 88 | 0,00 | 1 | |||||
| 2026-02-17 | 13F | Raymond James Financial Inc | 18.876 | -45,11 | 157 | -27,65 | ||||
| 2026-02-17 | 13F | Susquehanna International Group, Llp | 595.660 | -56,59 | 4.968 | -42,72 | ||||
| 2026-02-13 | 13F | Colony Group, LLC | 11.426 | 0,00 | 95 | 31,94 | ||||
| 2026-02-17 | 13F | Tudor Investment Corp Et Al | 1.337.464 | -1,10 | 11.154 | 30,52 | ||||
| 2026-03-16 | 13F/A | Rockefeller Capital Management L.P. | 1.003 | 0,00 | 8 | 33,33 | ||||
| 2026-04-07 | 13F | Signaturefd, Llc | 11.901 | 0,00 | 128 | 28,28 | ||||
| 2026-01-29 | 13F | Sava Infond d.o.o. | 325.000 | 2.710 | ||||||
| 2026-02-17 | 13F | Millennium Management Llc | 2.999.671 | -22,13 | 25.050 | 2,93 | ||||
| 2026-02-17 | 13F | Public Employees Retirement System Of Ohio | 209.140 | 34,94 | 1.751 | 79,04 | ||||
| 2026-04-20 | 13F | Williams & Novak, LLC | 0 | -100,00 | 0 | |||||
| 2026-02-17 | 13F | Voloridge Investment Management, Llc | 2.863.819 | 101,96 | 23.884 | 166,53 | ||||
| 2026-02-12 | 13F | Renaissance Technologies Llc | 2.464.396 | -26,92 | 20.553 | -3,56 | ||||
| 2026-02-10 | 13F | Bank of New York Mellon Corp | 15.574 | 0,00 | 130 | 31,63 |