Grundlæggende statistik
| Institutionelle aktier (lange) | 8.375.531 - 89,75% (ex 13D/G) - change of -4,07MM shares -32,73% MRQ |
| Institutionel værdi (lang) | $ 472.970 USD ($1000) |
Institutionelt ejerskab og aktionærer
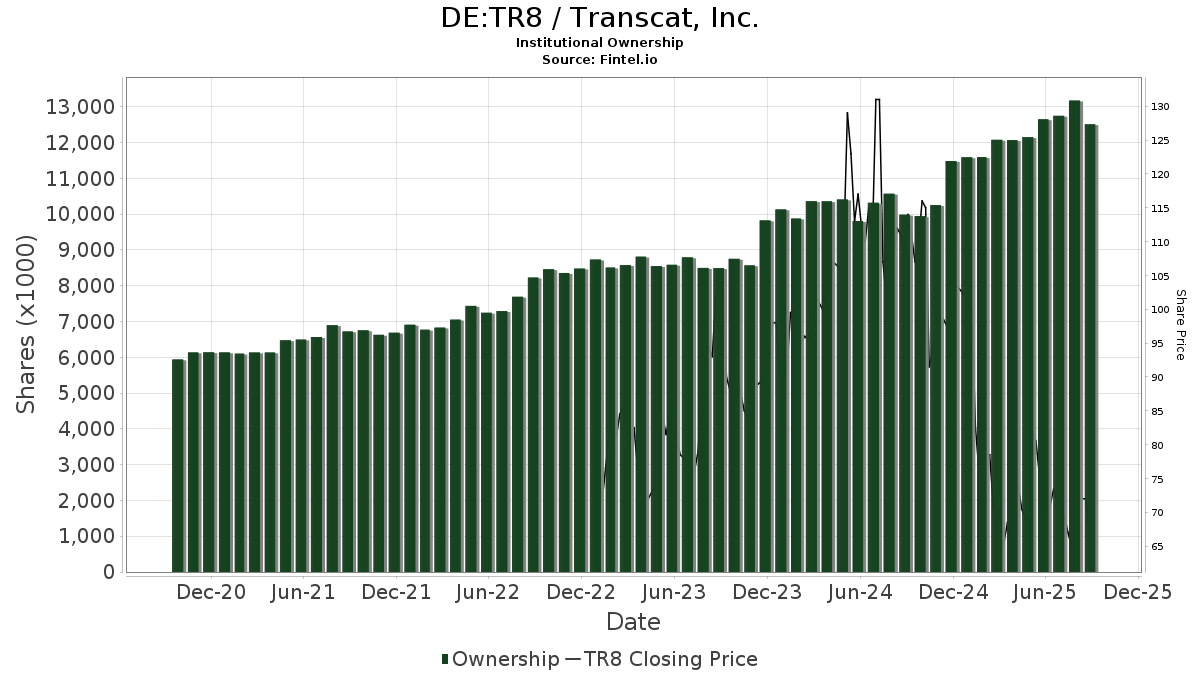
Transcat, Inc. (DE:TR8) har 156 institutionelle ejere og aktionærer, der har indsendt 13D/G- eller 13F-formularer til Securities Exchange Commission (SEC). Disse institutioner har i alt 8,375,531 aktier. Største aktionærer omfatter Conestoga Capital Advisors, LLC, Neuberger Berman Group LLC, BlackRock, Inc., Hood River Capital Management LLC, Vanguard Group Inc, Royce & Associates Lp, Riverbridge Partners Llc, Dimensional Fund Advisors Lp, Wellington Management Group Llp, and Geode Capital Management, Llc .
Transcat, Inc. (BST:TR8) institutionel ejerskabsstruktur viser aktuelle positioner i virksomheden efter institutioner og fonde, samt seneste ændringer i positionsstørrelse. Større aktionærer kan omfatte individuelle investorer, investeringsforeninger, hedgefonde eller institutioner. Skema 13D angiver, at investoren besidder (eller besidder) mere end 5 % af virksomheden og har til hensigt (eller har til hensigt at) aktivt at forfølge en ændring i forretningsstrategi. Skema 13G indikerer en passiv investering på over 5%.
The share price as of March 27, 2026 is 62,50 / share. Previously, on March 31, 2025, the share price was 67,50 / share. This represents a decline of 7,41% over that period.
Fondens stemningsscore
Fund Sentiment Score (fka Ownership Accumulation Score) finder de aktier, der bliver mest købt af fonde. Det er resultatet af en sofistikeret, multi-faktor kvantitativ model, der identificerer virksomheder med de højeste niveauer af institutionel akkumulering. Scoringsmodellen bruger en kombination af den samlede stigning i oplyste ejere, ændringerne i porteføljeallokeringer i disse ejere og andre målinger. Tallet går fra 0 til 100, hvor højere tal indikerer et højere niveau af akkumulering for sine jævnaldrende, og 50 er gennemsnittet.
Opdateringsfrekvens: Dagligt
Se Ownership Explorer, som giver en liste over højest rangerende virksomheder.
AI+ Ask Fintel’s AI assistant about Transcat, Inc..
Select a question to share a public post with an AI-crafted answer.
Thinking of good questions…
13F og NPORT arkivering
Detaljer om 13F-arkivering er gratis. Detaljer om NP-ansøgninger kræver et premium-medlemskab. Grønne rækker angiver nye positioner. Røde rækker angiver lukkede positioner. Klik på linket ikon for at se den fulde transaktionshistorik.
Opgrader
for at låse premium-data op og eksportere til Excel ![]() .
.
| Fil dato | Kilde | Investor | Type | Gennemsnitlig pris (Øst) |
Aktier | Δ Aktier (%) |
Rapporteret Værdi ($1000) |
Δ Værdi (%) |
Port Alloc (%) |
|
|---|---|---|---|---|---|---|---|---|---|---|
| 2026-02-17 | 13F | Raymond James Financial Inc | 23.774 | 8,34 | 1.349 | -16,06 | ||||
| 2026-02-12 | 13F | Steward Partners Investment Advisory, Llc | 252 | -12,20 | 14 | -33,33 | ||||
| 2026-02-17 | 13F | Tower Research Capital LLC (TRC) | 567 | -24,10 | 32 | -40,74 | ||||
| 2025-11-14 | 13F | Point72 Europe (London) LLP | 117 | 9 | ||||||
| 2026-02-13 | 13F | Manufacturers Life Insurance Company, The | 0 | -100,00 | 0 | |||||
| 2026-02-12 | 13F | Commonwealth Equity Services, Llc | 7.534 | -1,13 | 427 | |||||
| 2025-09-29 | NP | CFSSX - Column Small Cap Select Fund | 7.170 | 1,80 | 602 | -2,28 | ||||
| 2026-02-17 | 13F | Optiver Holding B.V. | 74 | 0,00 | 4 | -20,00 | ||||
| 2026-02-11 | 13F | Simplex Trading, Llc | 396 | 22 | ||||||
| 2026-03-10 | 13F | Montanaro Asset Management Ltd | 40.000 | 0,00 | 2.269 | -22,51 | ||||
| 2025-11-14 | 13F | Point72 (DIFC) Ltd | 444 | 32 | ||||||
| 2026-02-17 | 13F | Russell Investments Group, Ltd. | 6.425 | 1,13 | 364 | -21,72 | ||||
| 2026-02-13 | 13F | Morgan Stanley | 65.510 | 44,69 | 3.716 | 12,13 | ||||
| 2025-11-03 | 13F | Broadcrest Asset Management, LLC | 130.802 | -34,60 | 9.575 | -44,31 | ||||
| 2026-01-20 | 13F | Princeton Global Asset Management LLC | 250 | 0,00 | 14 | -22,22 | ||||
| 2026-02-03 | 13F | Premier Fund Managers Ltd | 0 | -100,00 | 0 | |||||
| 2026-02-10 | 13F | Goldman Sachs Group Inc | 34.187 | -11,46 | 1.939 | -31,39 | ||||
| 2026-02-17 | 13F | Citadel Advisors Llc | 102.081 | 43,17 | 5.791 | 10,96 | ||||
| 2026-02-11 | 13F | Franklin Resources Inc | 5.951 | 338 | ||||||
| 2026-01-29 | 13F | Vanguard Group Inc | 530.782 | 0,00 | 30.111 | -22,50 | ||||
| 2026-02-17 | 13F | Aquatic Capital Management LLC | 0 | -100,00 | 0 | |||||
| 2026-02-09 | 13F | Royce & Associates Lp | 390.546 | 15,28 | 22.156 | -10,66 | ||||
| 2026-02-09 | 13F | Roubaix Capital, LLC | 116.111 | 268,16 | 6.587 | 185,36 | ||||
| 2025-11-13 | 13F | Glenmede Investment Management, LP | 4.804 | -8,65 | 352 | -22,35 | ||||
| 2026-02-10 | 13F | Envestnet Asset Management Inc | 14.733 | -61,65 | 836 | -70,31 | ||||
| 2026-02-11 | 13F | Deutsche Bank Ag\ | 7.053 | 4,63 | 400 | -18,86 | ||||
| 2026-01-23 | 13F | TFC Financial Management | 0 | -100,00 | 0 | |||||
| 2026-02-11 | 13F | Los Angeles Capital Management Llc | 6.674 | 493 | ||||||
| 2026-02-17 | 13F | Wellington Management Group Llp | 248.539 | 677,66 | 14.100 | 502,78 | ||||
| 2026-02-10 | 13F | Bank of New York Mellon Corp | 29.788 | -9,54 | 1.690 | -29,92 | ||||
| 2026-02-12 | 13F | Ironwood Investment Management Llc | 7.241 | 411 | ||||||
| 2026-02-09 | 13F | Quest Partners LLC | 591 | -65,07 | 34 | -73,17 | ||||
| 2026-02-19 | 13F/A | T. Rowe Price Investment Management, Inc. | 59 | 0 | ||||||
| 2026-02-13 | 13F | Verition Fund Management LLC | 14.360 | 59,88 | 815 | 23,90 | ||||
| 2026-02-06 | 13F | IFP Advisors, Inc | 5 | 66,67 | 0 | |||||
| 2025-11-14 | 13F | Colony Group, LLC | 0 | -100,00 | 0 | -100,00 | ||||
| 2026-02-17 | 13F | Hood River Capital Management LLC | 545.816 | 14,37 | 30.964 | -11,36 | ||||
| 2026-02-17 | 13F | Engineers Gate Manager LP | 5.798 | -54,45 | 329 | -64,77 | ||||
| 2026-02-13 | 13F | Essex Investment Management Co Llc | 0 | -100,00 | 0 | |||||
| 2026-02-10 | 13F | Intech Investment Management Llc | 6.021 | 8,72 | 342 | -15,80 | ||||
| 2026-02-17 | 13F | Tudor Investment Corp Et Al | 9.174 | 520 | ||||||
| 2026-02-17 | 13F | Fred Alger Management, Llc | 0 | -100,00 | 0 | |||||
| 2026-02-17 | 13F | Two Sigma Investments, Lp | 38.008 | 243,75 | 2.156 | 166,50 | ||||
| 2025-10-09 | 13F | Voya Investment Management Llc | 0 | -100,00 | 0 | |||||
| 2026-02-13 | 13F | Needham Investment Management Llc | 124.370 | 33,02 | 7.056 | 3,08 | ||||
| 2026-01-26 | 13F | Cwm, Llc | 684 | 5,23 | 0 | |||||
| 2026-02-13 | 13F | State Street Corp | 218.808 | -2,14 | 12.413 | -24,16 | ||||
| 2026-01-13 | 13F | Riverbridge Partners Llc | 337.505 | -17,12 | 19.147 | -35,77 | ||||
| 2025-11-07 | 13F | Gsa Capital Partners Llp | 0 | -100,00 | 0 | |||||
| 2026-02-13 | 13F | BNP Paribas Asset Management Holding S.A. | 142 | 69,05 | 0 | |||||
| 2025-09-29 | NP | RSSL - Global X Russell 2000 ETF | 4.676 | -16,35 | 357 | -19,41 | ||||
| 2026-01-29 | 13F | Comerica Bank | 86.778 | 1,97 | 4.923 | -20,98 | ||||
| 2025-10-30 | 13F | Universal- Beteiligungs- und Servicegesellschaft mbH | 0 | -100,00 | 0 | |||||
| 2026-02-09 | 13F | White Pine Capital Llc | 0 | -100,00 | 0 | |||||
| 2026-01-15 | 13F | Nisa Investment Advisors, Llc | 0 | -100,00 | 0 | |||||
| 2026-02-12 | 13F | BlackRock, Inc. | 680.564 | 2,07 | 38.608 | -20,90 | ||||
| 2025-11-14 | 13F | Petrus Trust Company, LTA | 0 | -100,00 | 0 | |||||
| 2026-02-10 | 13F | Bnp Paribas Arbitrage, Sa | 33.737 | -18,81 | 1.914 | -37,09 | ||||
| 2026-02-17 | 13F | Silvercrest Asset Management Group Llc | 83.507 | 0,00 | 4.737 | -22,50 | ||||
| 2026-02-17 | 13F | Point72 Asset Management, L.P. | 29.294 | 123,24 | 1.662 | 73,02 | ||||
| 2025-10-30 | 13F | Twin Peaks Wealth Advisors, LLC | 0 | -100,00 | 0 | |||||
| 2026-01-05 | 13F | GAMMA Investing LLC | 0 | -100,00 | 0 | |||||
| 2026-02-13 | 13F | Citigroup Inc | 2.725 | 0,33 | 155 | -22,22 | ||||
| 2026-02-02 | 13F | Oppenheimer Asset Management Inc. | 9.520 | -41,76 | 540 | -54,85 | ||||
| 2026-02-12 | 13F | CIBC Private Wealth Group, LLC | 2 | -98,02 | 0 | -100,00 | ||||
| 2025-11-07 | 13F | Hardy Reed LLC | 0 | -100,00 | 0 | |||||
| 2026-02-11 | 13F | Jpmorgan Chase & Co | 39.381 | 28,20 | 2.234 | -0,62 | ||||
| 2026-01-20 | 13F | Signaturefd, Llc | 177 | 0,00 | 10 | -16,67 | ||||
| 2026-02-13 | 13F | Charles Schwab Investment Management Inc | 71.833 | -6,72 | 4.075 | -27,70 | ||||
| 2026-02-17 | 13F | Janus Henderson Group Plc | 5.097 | 0,00 | 290 | -22,31 | ||||
| 2026-02-17 | 13F | Dark Forest Capital Management Lp | 0 | -100,00 | 0 | |||||
| 2026-02-09 | 13F | Huntington National Bank | 1 | -96,30 | 0 | -100,00 | ||||
| 2026-02-17 | 13F | Clear Street Markets Llc | 0 | -100,00 | 0 | |||||
| 2026-02-17 | 13F | California State Teachers Retirement System | 9.722 | -0,07 | 552 | -22,61 | ||||
| 2026-02-03 | 13F | SBI Securities Co., Ltd. | 0 | -100,00 | 0 | |||||
| 2026-01-09 | 13F | Park Place Capital Corp | 150 | 0,00 | 9 | -20,00 | ||||
| 2026-02-17 | 13F | Numerai GP LLC | 11.356 | 18,43 | 644 | -8,13 | ||||
| 2026-02-13 | 13F | Quarry LP | 314 | 18 | ||||||
| 2026-02-13 | 13F | Morgan Dempsey Capital Management Llc | 0 | -100,00 | 0 | |||||
| 2025-11-14 | 13F | Peak6 Llc | Call | 0 | -100,00 | 0 | -100,00 | |||
| 2026-02-13 | 13F | Walleye Capital LLC | 11.557 | -23,73 | 656 | -40,94 | ||||
| 2026-02-13 | 13F | Smartleaf Asset Management LLC | 92 | -21,37 | 5 | -37,50 | ||||
| 2026-02-13 | 13F | Wells Fargo & Company/mn | 10.158 | 60,58 | 576 | 24,41 | ||||
| 2026-02-17 | 13F | Ameriprise Financial Inc | 70.007 | 0,00 | 3.971 | -22,50 | ||||
| 2025-09-29 | NP | CFSLX - Column Small Cap Fund | 1.245 | 0,00 | 105 | -3,70 | ||||
| 2026-01-12 | 13F | Moody National Bank Trust Division | 14.619 | -1,43 | 829 | -23,59 | ||||
| 2026-02-06 | 13F | Legato Capital Management LLC | 0 | -100,00 | 0 | |||||
| 2026-01-26 | 13F | Annex Advisory Services, LLC | 17.193 | -41,02 | 975 | -54,29 | ||||
| 2026-02-13 | 13F | SRS Capital Advisors, Inc. | 33 | -15,38 | 2 | -50,00 | ||||
| 2026-02-17 | 13F | Jones Financial Companies Lllp | 1.237 | -24,30 | 70 | -41,67 | ||||
| 2026-01-22 | 13F | Advantage Alpha Capital Partners LP | 0 | -100,00 | 0 | |||||
| 2026-02-06 | 13F | Kilter Group LLC | 0 | -100,00 | 0 | |||||
| 2026-02-17 | 13F | ExodusPoint Capital Management, LP | 0 | -100,00 | 0 | -100,00 | ||||
| 2026-02-12 | 13F | MetLife Investment Management, LLC | 5.347 | 0,00 | 303 | -22,51 | ||||
| 2026-02-13 | 13F | Squarepoint Ops LLC | 6.387 | 58,17 | 362 | 22,71 | ||||
| 2026-02-17 | 13F | Price T Rowe Associates Inc /md/ | 5.265 | 8,94 | 0 | |||||
| 2026-02-17 | 13F | Two Sigma Advisers, Lp | 10.400 | 246,67 | 590 | 168,95 | ||||
| 2026-02-12 | 13F | Renaissance Technologies Llc | 95.200 | 109,69 | 5.401 | 62,50 | ||||
| 2026-02-17 | 13F | Polar Asset Management Partners Inc. | 0 | -100,00 | 0 | |||||
| 2026-02-12 | 13F | Nuveen, LLC | 17.247 | 0,00 | 978 | -22,50 | ||||
| 2026-02-13 | 13F | Bard Associates Inc | 150 | 9 | ||||||
| 2026-02-13 | 13F | Rhumbline Advisers | 11.423 | -14,50 | 648 | -33,74 | ||||
| 2025-11-14 | 13F | Skopos Labs, Inc. | 0 | -100,00 | 0 | |||||
| 2026-01-30 | 13F | Us Bancorp \de\ | 815 | -56,11 | 46 | -65,93 | ||||
| 2026-02-13 | 13F | Caitong International Asset Management Co., Ltd | 0 | -100,00 | 0 | |||||
| 2025-11-13 | 13F/A | Cynosure Management, Llc | 0 | -100,00 | 0 | -100,00 | ||||
| 2026-02-17 | 13F | Cardiff Park Advisors, Llc | 39.022 | 0,00 | 2.214 | -22,51 | ||||
| 2026-02-13 | 13F | Rice Hall James & Associates, Llc | 35.502 | 49,17 | 2.014 | 15,61 | ||||
| 2026-02-17 | 13F | Bamco Inc /ny/ | 203.477 | 6,22 | 11.543 | -17,68 | ||||
| 2026-02-09 | 13F | King Luther Capital Management Corp | 103.750 | 182,31 | 5.886 | 118,77 | ||||
| 2026-02-17 | 13F | Punch & Associates Investment Management, Inc. | 59.235 | 2,96 | 3.360 | -20,21 | ||||
| 2026-02-17 | 13F | Royal Bank Of Canada | 160.750 | -15,13 | 9.119 | -34,22 | ||||
| 2025-09-29 | NP | SUNAMERICA SERIES TRUST - SA Small Cap Index Portfolio Class 1 | 1.048 | 0,00 | 80 | -3,61 | ||||
| 2026-02-10 | 13F | Quantbot Technologies LP | 7.767 | -7,63 | 441 | -28,46 | ||||
| 2026-02-17 | 13F | Granahan Investment Management Inc/ma | 0 | -100,00 | 0 | |||||
| 2026-02-17 | 13F | Glenmede Trust Co Na | 4.800 | 0,78 | 272 | -23,16 | ||||
| 2026-02-13 | 13F | Marshall Wace, Llp | 4.161 | 236 | ||||||
| 2026-01-08 | 13F | Wealth Enhancement Advisory Services, Llc | 79.372 | -0,05 | 4.817 | -14,12 | ||||
| 2026-02-13 | 13F | Parkside Financial Bank & Trust | 890 | -7,19 | 50 | -28,57 | ||||
| 2026-02-13 | 13F | Police & Firemen's Retirement System of New Jersey | 2.168 | -17,85 | 123 | -36,79 | ||||
| 2026-02-17 | 13F | Advisory Services Network, LLC | 0 | -100,00 | 0 | |||||
| 2025-09-29 | NP | PRFZ - Invesco FTSE RAFI US 1500 Small-Mid ETF This fund is a listed as child fund of Invesco Ltd. and if that institution has disclosed ownership in this security, then these positions will not be double counted when calculating total shares and total value | 5.400 | 26,67 | 413 | 21,89 | ||||
| 2026-02-02 | 13F | Truist Financial Corp | 0 | -100,00 | 0 | |||||
| 2026-02-17 | 13F | Northern Trust Corp | 102.032 | -12,02 | 5.788 | -31,82 | ||||
| 2026-02-05 | 13F | Bessemer Group Inc | 7.035 | -28,36 | 0 | |||||
| 2026-02-17 | 13F | D. E. Shaw & Co., Inc. | Call | 14.500 | 178,85 | 823 | 116,32 | |||
| 2026-02-17 | 13F | Advisor Group Holdings, Inc. | 1.577 | -36,49 | 89 | -53,89 | ||||
| 2026-02-06 | 13F | Larson Financial Group LLC | 3 | 200,00 | 0 | |||||
| 2026-02-17 | 13F | Quantinno Capital Management LP | 5.114 | 65,02 | 290 | 28,32 | ||||
| 2026-02-13 | 13F | Caxton Associates Llp | 11.126 | 631 | ||||||
| 2026-02-12 | 13F | Dimensional Fund Advisors Lp | 252.767 | 5,39 | 14.340 | -18,32 | ||||
| 2026-02-17 | 13F | Susquehanna International Group, Llp | 20.877 | 151,80 | 1.184 | 95,38 | ||||
| 2026-02-17 | 13F | Alliancebernstein L.p. | 7.840 | -31,59 | 445 | -47,02 | ||||
| 2026-01-26 | 13F | Valmark Advisers, Inc. | 5.000 | 0,00 | 284 | -22,68 | ||||
| 2026-02-17 | 13F | Susquehanna International Group, Llp | Put | 5.000 | -12,28 | 284 | -32,13 | |||
| 2026-02-10 | 13F | Rothschild Investment Llc | 6 | 20,00 | 0 | |||||
| 2026-02-12 | 13F | Jane Street Group, Llc | Call | 4.200 | -19,23 | 238 | -37,37 | |||
| 2026-02-12 | 13F | Jane Street Group, Llc | 35.699 | -10,24 | 2.025 | -30,44 | ||||
| 2026-01-27 | 13F | Round Rock Advisors, LLC | 15.515 | 104,12 | 880 | 48,40 | ||||
| 2026-02-04 | 13F | First Eagle Investment Management, LLC | 127.957 | 7.259 | ||||||
| 2025-11-14 | 13F | Cubist Systematic Strategies, LLC | 10.207 | 747 | ||||||
| 2026-02-12 | 13F | New York State Common Retirement Fund | 3.069 | 0,00 | 174 | -22,32 | ||||
| 2026-02-11 | 13F | CenterBook Partners LP | 13.131 | 745 | ||||||
| 2026-01-28 | 13F | Klp Kapitalforvaltning As | 2.000 | 11,11 | 113 | -13,74 | ||||
| 2025-11-06 | 13F | Atria Investments Llc | 0 | -100,00 | 0 | |||||
| 2026-02-17 | 13F | Brevan Howard Capital Management LP | 7.695 | 437 | ||||||
| 2026-02-17 | 13F | Jump Financial, LLC | 0 | -100,00 | 0 | |||||
| 2026-02-11 | 13F | Ameritas Investment Partners, Inc. | 849 | 48 | ||||||
| 2026-02-06 | 13F | Diamond Hill Capital Management Inc | 43.802 | 600,38 | 2.485 | 443,54 | ||||
| 2026-02-17 | 13F | Cooper Creek Partners Management Llc | 18.427 | 0,00 | 1 | 0,00 | ||||
| 2026-02-02 | 13F | Kornitzer Capital Management Inc /ks | 58.780 | 3,67 | 3.335 | -19,66 | ||||
| 2026-02-17 | 13F | Man Group plc | 12.280 | 697 | ||||||
| 2026-02-05 | 13F | Allworth Financial LP | 5 | -50,00 | 0 | |||||
| 2026-02-19 | 13F | Invesco Ltd. | 14.741 | 22,65 | 836 | -4,89 | ||||
| 2026-02-09 | 13F | Legal & General Group Plc | 7.440 | -22,10 | 422 | -39,63 | ||||
| 2026-02-06 | 13F | Covestor Ltd | 0 | 0 | ||||||
| 2026-02-13 | 13F | Ubs Asset Management Americas Inc | 12.043 | 0,03 | 683 | -22,47 | ||||
| 2026-02-13 | 13F | Sterling Capital Management LLC | 292 | -9,88 | 17 | -30,43 | ||||
| 2026-02-17 | 13F | ArrowMark Colorado Holdings LLC | 133.738 | 56,66 | 7.587 | 21,40 | ||||
| 2026-01-23 | 13F | State of Alaska, Department of Revenue | 555 | 0,00 | 0 | |||||
| 2026-02-17 | 13F | MIRAE ASSET GLOBAL ETFS HOLDINGS Ltd. | 4.264 | -1,16 | 242 | -23,49 | ||||
| 2026-01-09 | 13F | SG Americas Securities, LLC | 27.732 | 112,60 | 2 | |||||
| 2026-02-14 | 13F | Howe & Rusling Inc | 8.310 | 0,00 | 471 | -22,53 | ||||
| 2026-02-13 | 13F | Neuberger Berman Group LLC | 850.242 | -3,13 | 48.234 | -24,92 | ||||
| 2026-02-17 | 13F | Canada Pension Plan Investment Board | 3.000 | 150,00 | 170 | 95,40 | ||||
| 2026-02-10 | 13F | Meramec Financial Planners, LLC | 38 | 3 | ||||||
| 2026-02-13 | 13F | Arkadios Wealth Advisors | 5.010 | -13,86 | 284 | -33,18 | ||||
| 2026-01-29 | 13F | UBS Group AG | 36.308 | -18,93 | 2.060 | -37,19 | ||||
| 2025-11-12 | 13F | CIBC Bancorp USA Inc. | 5.499 | 403 | ||||||
| 2026-02-05 | 13F | Amalgamated Bank | 288 | -7,69 | 0 | |||||
| 2026-01-27 | 13F | First Horizon Corp | 237 | 0,00 | 13 | -23,53 | ||||
| 2026-02-13 | 13F | Sei Investments Co | 34.533 | -25,54 | 1.959 | -42,28 | ||||
| 2025-11-14 | 13F | Lazard Asset Management Llc | 0 | -100,00 | 0 | |||||
| 2025-11-14 | 13F | State Of Wisconsin Investment Board | 0 | -100,00 | 0 | |||||
| 2026-01-09 | 13F | Diversified Trust Co | 5.051 | -18,14 | 287 | -36,59 | ||||
| 2025-11-14 | 13F | Susquehanna International Group, Llp | Call | 0 | -100,00 | 0 | -100,00 | |||
| 2026-01-16 | 13F | Linden Thomas Advisory Services, LLC | 10.597 | -2,24 | 601 | -24,21 | ||||
| 2026-02-17 | 13F | Boothbay Fund Management, Llc | 0 | -100,00 | 0 | |||||
| 2026-02-02 | 13F | Fifth Third Bancorp | 752 | -16,54 | 43 | -35,38 | ||||
| 2026-02-17 | 13F | PharVision Advisers, LLC | 4.688 | 266 | ||||||
| 2026-02-13 | 13F | Barclays Plc | 21.924 | 44,90 | 1.244 | -31,96 | ||||
| 2026-02-17 | 13F | Balyasny Asset Management Llc | 4.351 | 247 | ||||||
| 2025-09-29 | NP | KCXIX - Knights of Columbus U.S. All Cap Index Fund I Shares | 41 | 7,89 | 3 | 0,00 | ||||
| 2025-11-14 | 13F | Sherbrooke Park Advisers Llc | 0 | -100,00 | 0 | |||||
| 2026-02-02 | 13F | Conestoga Capital Advisors, LLC | 943.437 | -3,21 | 53.521 | -24,99 | ||||
| 2026-02-17 | 13F | Citadel Advisors Llc | Put | 0 | -100,00 | 0 | ||||
| 2026-02-06 | 13F | EverSource Wealth Advisors, LLC | 14 | 366,67 | 1 | |||||
| 2026-02-06 | 13F | Pnc Financial Services Group, Inc. | 1.562 | 2,09 | 89 | -20,72 | ||||
| 2026-02-09 | 13F | Geode Capital Management, Llc | 222.668 | -0,50 | 12.634 | -22,89 | ||||
| 2026-02-17 | 13F | Millennium Management Llc | 26.768 | -8,30 | 1.519 | -28,93 | ||||
| 2026-02-17 | 13F | Citadel Advisors Llc | Call | 0 | -100,00 | 0 | ||||
| 2026-02-03 | 13F | International Assets Investment Management, Llc | 41 | 2 | ||||||
| 2026-02-17 | 13F | Fmr Llc | 273 | -98,52 | 15 | -98,89 | ||||
| 2026-02-12 | 13F | Swiss National Bank | 18.315 | 2,23 | 1.039 | -20,75 | ||||
| 2026-02-12 | 13F | State Board Of Administration Of Florida Retirement System | 0 | -100,00 | 0 | |||||
| 2026-02-17 | 13F | 4D Advisors, LLC | 0 | -100,00 | 0 | |||||
| 2026-02-13 | 13F | Champlain Investment Partners, LLC | 0 | -100,00 | 0 | |||||
| 2026-02-17 | 13F | Ancora Advisors, LLC | 181 | -2,16 | 10 | -23,08 | ||||
| 2026-02-17 | 13F | XTX Topco Ltd | 6.693 | 380 | ||||||
| 2026-02-13 | 13F | Victory Capital Management Inc | 0 | -100,00 | 0 | |||||
| 2026-01-29 | 13F | Teachers Retirement System Of The State Of Kentucky | 34.789 | 2 | ||||||
| 2026-02-17 | 13F | Bank Of America Corp /de/ | 28.504 | -58,35 | 1.617 | -67,72 | ||||
| 2026-02-17 | 13F | Graham Capital Management, L.P. | 5.508 | 13,85 | 312 | -11,86 | ||||
| 2026-01-23 | 13F | Farther Finance Advisors, LLC | 14 | 1 | ||||||
| 2025-11-03 | 13F | Arizona State Retirement System | 0 | -100,00 | 0 |
Other Listings
| US:TRNS | 71,32 $ |