Grundlæggende statistik
| Institutionelle aktier (lange) | 32.372.265 - 97,78% (ex 13D/G) - change of -9,58MM shares -22,84% MRQ |
| Institutionel værdi (lang) | $ 1.668.312 USD ($1000) |
Institutionelt ejerskab og aktionærer
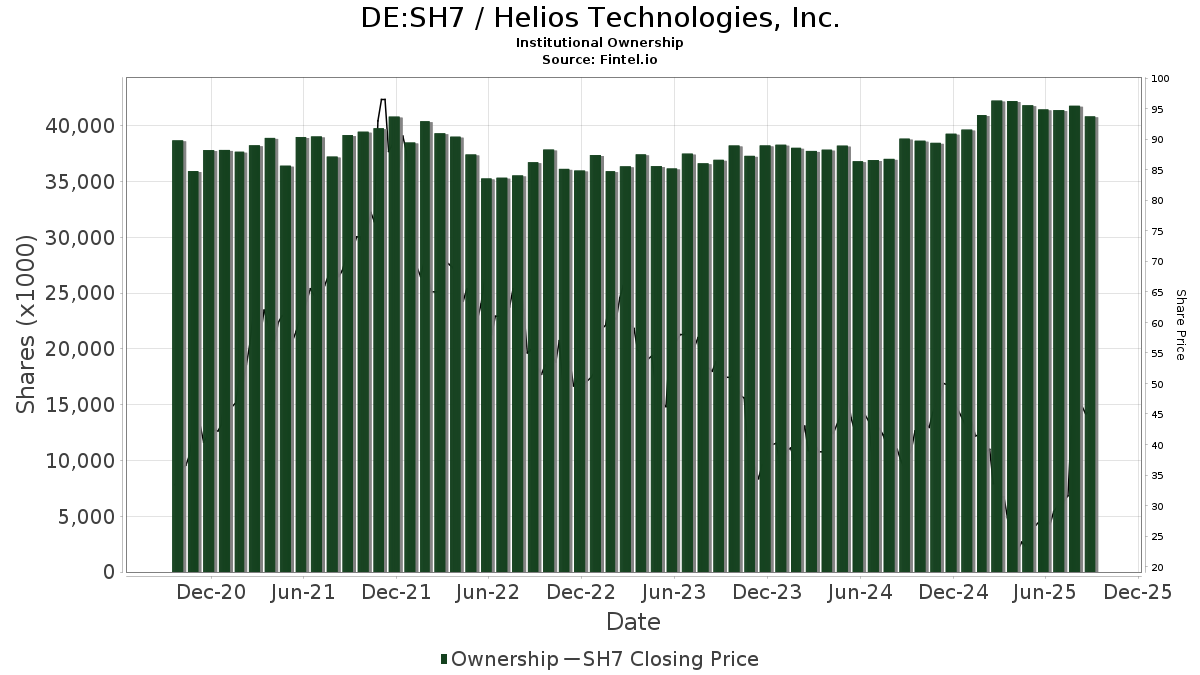
Helios Technologies, Inc. (DE:SH7) har 217 institutionelle ejere og aktionærer, der har indsendt 13D/G- eller 13F-formularer til Securities Exchange Commission (SEC). Disse institutioner har i alt 32,372,265 aktier. Største aktionærer omfatter Vanguard Group Inc, BlackRock, Inc., Wellington Management Group Llp, Dimensional Fund Advisors Lp, Conestoga Capital Advisors, LLC, Sara-Bay Financial, Barrow Hanley Mewhinney & Strauss Llc, Thrivent Financial For Lutherans, Jennison Associates Llc, and State Street Corp .
Helios Technologies, Inc. (DB:SH7) institutionel ejerskabsstruktur viser aktuelle positioner i virksomheden efter institutioner og fonde, samt seneste ændringer i positionsstørrelse. Større aktionærer kan omfatte individuelle investorer, investeringsforeninger, hedgefonde eller institutioner. Skema 13D angiver, at investoren besidder (eller besidder) mere end 5 % af virksomheden og har til hensigt (eller har til hensigt at) aktivt at forfølge en ændring i forretningsstrategi. Skema 13G indikerer en passiv investering på over 5%.
The share price as of April 17, 2026 is 56,50 / share. Previously, on April 22, 2025, the share price was 21,80 / share. This represents an increase of 159,17% over that period.
Fondens stemningsscore
Fund Sentiment Score (fka Ownership Accumulation Score) finder de aktier, der bliver mest købt af fonde. Det er resultatet af en sofistikeret, multi-faktor kvantitativ model, der identificerer virksomheder med de højeste niveauer af institutionel akkumulering. Scoringsmodellen bruger en kombination af den samlede stigning i oplyste ejere, ændringerne i porteføljeallokeringer i disse ejere og andre målinger. Tallet går fra 0 til 100, hvor højere tal indikerer et højere niveau af akkumulering for sine jævnaldrende, og 50 er gennemsnittet.
Opdateringsfrekvens: Dagligt
Se Ownership Explorer, som giver en liste over højest rangerende virksomheder.
AI+ Ask Fintel’s AI assistant about Helios Technologies, Inc..
Select a question to share a public post with an AI-crafted answer.
Thinking of good questions…
13F og NPORT arkivering
Detaljer om 13F-arkivering er gratis. Detaljer om NP-ansøgninger kræver et premium-medlemskab. Grønne rækker angiver nye positioner. Røde rækker angiver lukkede positioner. Klik på linket ikon for at se den fulde transaktionshistorik.
Opgrader
for at låse premium-data op og eksportere til Excel ![]() .
.
| Fil dato | Kilde | Investor | Type | Gennemsnitlig pris (Øst) |
Aktier | Δ Aktier (%) |
Rapporteret Værdi ($1000) |
Δ Værdi (%) |
Port Alloc (%) |
|
|---|---|---|---|---|---|---|---|---|---|---|
| 2025-11-14 | 13F | Qube Research & Technologies Ltd | 0 | -100,00 | 0 | |||||
| 2026-04-07 | 13F | Central Pacific Bank - Trust Division | 160 | -97,88 | 10 | -97,52 | ||||
| 2026-01-28 | 13F | Teacher Retirement System Of Texas | 6.951 | 0,00 | 372 | 2,49 | ||||
| 2026-04-07 | 13F | Farther Finance Advisors, LLC | 440 | 900,00 | 30 | 1.400,00 | ||||
| 2026-02-02 | 13F | Pinnacle Wealth Management Advisory Group, LLC | 9.912 | 129,18 | 530 | 135,56 | ||||
| 2026-02-06 | 13F | Cullen/frost Bankers, Inc. | 357 | 7,21 | 19 | 11,76 | ||||
| 2026-02-13 | 13F | Formula Growth Ltd | 10.010 | -9,00 | 535 | -6,63 | ||||
| 2026-01-27 | 13F | Zurcher Kantonalbank (Zurich Cantonalbank) | 16.087 | 52,63 | 860 | 56,65 | ||||
| 2026-02-13 | 13F | Dynamic Technology Lab Private Ltd | 0 | -100,00 | 0 | |||||
| 2025-11-14 | 13F | Lazard Asset Management Llc | 0 | -100,00 | 0 | |||||
| 2026-02-02 | 13F | Conestoga Capital Advisors, LLC | 1.552.064 | -6,50 | 83.020 | -4,07 | ||||
| 2026-02-13 | 13F | Boston Partners | 6.732 | -4,79 | 360 | -2,17 | ||||
| 2026-02-13 | 13F | Y-Intercept (Hong Kong) Ltd | 6.693 | 5,00 | 358 | 7,83 | ||||
| 2026-02-13 | 13F | BNP Paribas Asset Management Holding S.A. | 356 | 82,56 | 0 | |||||
| 2026-02-11 | 13F | Barrow Hanley Mewhinney & Strauss Llc | 993.961 | -14,86 | 53.167 | -12,64 | ||||
| 2026-02-17 | 13F | Bank Of America Corp /de/ | 658.896 | -16,59 | 35.244 | -14,41 | ||||
| 2026-02-17 | 13F | California State Teachers Retirement System | 31.739 | 3,36 | 1.698 | 6,06 | ||||
| 2026-02-12 | 13F | Moneta Group Investment Advisors Llc | 10.025 | 0,00 | 536 | 2,68 | ||||
| 2026-02-13 | 13F | Stifel Financial Corp | 47.860 | -4,48 | 2.560 | -1,99 | ||||
| 2026-02-13 | 13F | Great West Life Assurance Co /can/ | 2.899 | -80,44 | 0 | |||||
| 2026-02-17 | 13F | Engineers Gate Manager LP | 9.576 | 512 | ||||||
| 2026-04-13 | 13F | Massmutual Trust Co Fsb/adv | 54 | 0,00 | 3 | 50,00 | ||||
| 2026-04-15 | 13F | Fortitude Family Office, LLC | 36 | 2 | ||||||
| 2026-02-11 | 13F | Ameritas Investment Partners, Inc. | 2.772 | 148 | ||||||
| 2025-11-14 | 13F | Cubist Systematic Strategies, LLC | 0 | -100,00 | 0 | |||||
| 2026-02-09 | 13F | Geode Capital Management, Llc | 787.520 | -0,07 | 42.132 | 2,54 | ||||
| 2026-02-11 | 13F | Franklin Resources Inc | 29.036 | 145,26 | 1.553 | 151,70 | ||||
| 2026-02-13 | 13F | Quarry LP | 112 | -90,38 | 6 | -91,67 | ||||
| 2026-02-17 | 13F | Aquatic Capital Management LLC | 0 | -100,00 | 0 | |||||
| 2026-02-17 | 13F | Fmr Llc | 24.725 | 3,56 | 1.323 | 6,27 | ||||
| 2026-02-12 | 13F | Quadrant Capital Group Llc | 88 | 91,30 | 5 | 100,00 | ||||
| 2026-02-12 | 13F | Commonwealth Equity Services, Llc | 13.071 | 8,21 | 699 | |||||
| 2026-02-17 | 13F | Captrust Financial Advisors | 17.296 | 7,87 | 925 | 10,78 | ||||
| 2026-02-11 | 13F | LPL Financial LLC | 5.689 | 5,06 | 304 | 7,80 | ||||
| 2026-04-14 | 13F | Congress Asset Management Co /ma | 70.353 | 16,21 | 4.553 | 40,58 | ||||
| 2026-02-10 | 13F | Goldman Sachs Group Inc | 320.220 | -14,73 | 17.129 | -12,50 | ||||
| 2026-02-13 | 13F | Ieq Capital, Llc | 3.901 | 0,00 | 209 | 2,46 | ||||
| 2026-02-17 | 13F | Silvercrest Asset Management Group Llc | 285.418 | 15.267 | ||||||
| 2026-02-11 | 13F | Jpmorgan Chase & Co | 25.945 | 1,19 | 1.388 | 3,82 | ||||
| 2026-02-12 | 13F | State Board Of Administration Of Florida Retirement System | 9.295 | 0,00 | 497 | 2,69 | ||||
| 2025-11-14 | 13F | Petrus Trust Company, LTA | 0 | -100,00 | 0 | |||||
| 2026-02-13 | 13F | Pinnacle Wealth Planning Services, Inc. | 194 | 10 | ||||||
| 2025-11-14 | 13F | Frontier Capital Management Co Llc | 0 | -100,00 | 0 | |||||
| 2026-02-09 | 13F | Hartland & Co., LLC | 3.750 | -0,16 | 201 | 2,56 | ||||
| 2026-02-17 | 13F | Cetera Investment Advisers | 3.920 | -7,55 | 210 | -5,43 | ||||
| 2026-02-09 | 13F | King Luther Capital Management Corp | 52.273 | 0,16 | 2.796 | 2,79 | ||||
| 2025-11-14 | 13F | Gotham Asset Management, LLC | 0 | -100,00 | 0 | |||||
| 2026-02-11 | 13F | Group One Trading, L.p. | 3.344 | 736,00 | 179 | 790,00 | ||||
| 2026-02-13 | 13F | American Century Companies Inc | 176.225 | 22,22 | 9.426 | 25,41 | ||||
| 2026-02-10 | 13F | Acadian Asset Management Llc | 813 | 0 | ||||||
| 2026-02-06 | 13F | Covestor Ltd | 2 | -71,43 | 0 | |||||
| 2026-02-14 | 13F | Rockefeller Capital Management L.P. | 294.148 | -47,71 | 15.734 | -46,35 | ||||
| 2026-02-17 | 13F | Dark Forest Capital Management Lp | 29.264 | 30,46 | 1.565 | 33,88 | ||||
| 2026-01-26 | 13F | Cwm, Llc | 1.910 | 1,27 | 0 | |||||
| 2026-02-13 | 13F | First Trust Advisors Lp | 10.928 | -82,22 | 585 | -81,77 | ||||
| 2026-04-14 | 13F | Clean Yield Group | 6.307 | -2,32 | 408 | 18,26 | ||||
| 2026-02-10 | 13F | Quantbot Technologies LP | 0 | -100,00 | 0 | |||||
| 2026-02-13 | 13F | Kennedy Capital Management, Inc. | 457.526 | -39,62 | 24.473 | -38,05 | ||||
| 2026-02-13 | 13F | State Street Corp | 795.883 | -1,63 | 42.572 | 0,94 | ||||
| 2026-02-17 | 13F | Credit Agricole S A | 25.000 | 1.337 | ||||||
| 2026-02-13 | 13F | Marshall Wace, Llp | 70.831 | 3.789 | ||||||
| 2026-01-26 | 13F | KBC Group NV | 1.333 | 0,00 | 0 | |||||
| 2026-02-13 | 13F | SRS Capital Advisors, Inc. | 85 | -88,32 | 5 | -89,19 | ||||
| 2026-02-10 | 13F | Bank of New York Mellon Corp | 167.270 | -8,59 | 8.947 | -6,21 | ||||
| 2026-02-13 | 13F | Wells Fargo & Company/mn | 37.590 | 45,55 | 2.011 | 49,33 | ||||
| 2026-02-10 | 13F | Bnp Paribas Arbitrage, Sa | 7.721 | 15,79 | 413 | 18,73 | ||||
| 2025-11-13 | 13F | Glenmede Investment Management, LP | 8.491 | -14,47 | 443 | 33,53 | ||||
| 2026-02-09 | 13F | Avalon Trust Co | 7.901 | -3,01 | 423 | -0,47 | ||||
| 2026-02-17 | 13F | CWM Advisors, LLC | 8.761 | 0,29 | 469 | 2,86 | ||||
| 2026-01-30 | 13F | Us Bancorp \de\ | 12.682 | -1,71 | 678 | 0,89 | ||||
| 2026-02-17 | 13F | Mirabella Financial Services Llp | 6.232 | 333 | ||||||
| 2026-02-17 | 13F | D. E. Shaw & Co., Inc. | 0 | -100,00 | 0 | |||||
| 2026-02-13 | 13F | Police & Firemen's Retirement System of New Jersey | 8.797 | -7,67 | 471 | -5,24 | ||||
| 2026-02-12 | 13F | Counterpoint Mutual Funds LLC | 0 | -100,00 | 0 | |||||
| 2026-02-17 | 13F | Optiver Holding B.V. | 84 | -65,00 | 4 | -66,67 | ||||
| 2026-02-13 | 13F | Aigen Investment Management, Lp | 0 | -100,00 | 0 | |||||
| 2026-01-28 | 13F | Arizona State Retirement System | 9.206 | -6,66 | 492 | -4,28 | ||||
| 2025-10-27 | 13F | Decker Retirement Planning Inc. | 0 | -100,00 | 0 | |||||
| 2026-02-17 | 13F | PharVision Advisers, LLC | 0 | -100,00 | 0 | |||||
| 2026-02-13 | 13F | Squarepoint Ops LLC | 48.534 | 2.596 | ||||||
| 2026-02-09 | 13F | Quest Partners LLC | 2.857 | 13,78 | 153 | 16,92 | ||||
| 2026-02-12 | 13F | Granite Investment Partners, LLC | 86.728 | -21,09 | 4.639 | -19,03 | ||||
| 2026-02-17 | 13F | Freestone Grove Partners LP | 0 | -100,00 | 0 | |||||
| 2026-01-29 | 13F | Vanguard Group Inc | 3.162.279 | -0,96 | 169.150 | 1,63 | ||||
| 2026-04-06 | 13F | Versant Capital Management, Inc | 1.077 | 0,00 | 70 | 21,05 | ||||
| 2026-02-17 | 13F | T. Rowe Price Investment Management, Inc. | 293.608 | -65,35 | 16 | -65,91 | ||||
| 2026-01-26 | 13F | Whittier Trust Co | 144 | 0,00 | 9 | 14,29 | ||||
| 2026-02-12 | 13F | EntryPoint Capital, LLC | 17.109 | 12,07 | 915 | 15,09 | ||||
| 2026-02-02 | 13F | Fifth Third Bancorp | 743 | -10,37 | 40 | -9,30 | ||||
| 2025-11-14 | 13F | ExodusPoint Capital Management, LP | 0 | -100,00 | 0 | |||||
| 2026-01-30 | 13F | Keybank National Association/oh | 4.143 | 222 | ||||||
| 2026-02-17 | 13F | Royal Bank Of Canada | 70.910 | -4,37 | 3.793 | -1,86 | ||||
| 2026-02-13 | 13F | C M Bidwell & Associates Ltd | 78 | 0,00 | 4 | 0,00 | ||||
| 2026-01-20 | 13F | Harbor Capital Advisors, Inc. | 144 | -1,37 | 0 | |||||
| 2026-02-17 | 13F | VARCOV Co. | 6.840 | 366 | ||||||
| 2026-02-05 | 13F | Allworth Financial LP | 257 | -60,52 | 14 | -60,61 | ||||
| 2026-02-13 | 13F | ACK Asset Management LLC | 780.378 | 1,35 | 41.742 | 3,99 | ||||
| 2026-04-15 | 13F | Third View Private Wealth, LLC | 0 | -100,00 | 0 | |||||
| 2026-02-13 | 13F | Morgan Stanley | 142.008 | -15,87 | 7.596 | -13,67 | ||||
| 2025-11-12 | 13F/A | Norges Bank | 111.609 | -26,27 | 5.324 | -26,35 | ||||
| 2025-11-14 | 13F | Point72 (DIFC) Ltd | 0 | -100,00 | 0 | |||||
| 2026-02-17 | 13F | Millennium Management Llc | 42.568 | 390,02 | 2.277 | 403,54 | ||||
| 2026-01-27 | 13F | GHP Investment Advisors, Inc. | 42.080 | 1,72 | 2.251 | 4,36 | ||||
| 2026-02-12 | 13F | Renaissance Technologies Llc | 23.500 | -34,72 | 1.257 | -33,00 | ||||
| 2026-04-17 | 13F | Bell Investment Advisors, Inc | 10 | 0,00 | 1 | |||||
| 2026-02-17 | 13F | Northern Trust Corp | 304.908 | -5,59 | 16.310 | -3,12 | ||||
| 2026-01-23 | 13F | Private Wealth Management Group, LLC | 19 | 0,00 | 1 | |||||
| 2026-02-10 | 13F | Semanteon Capital Management, LP | 0 | -100,00 | 0 | |||||
| 2026-02-13 | 13F | Ostrum Asset Management | 24.455 | 13,03 | 1.308 | 16,06 | ||||
| 2026-02-13 | 13F | Schroder Investment Management Group | 303.017 | -2,16 | 16.442 | 0,80 | ||||
| 2026-02-17 | 13F | Delaware Management Holdings, Inc. | 123.341 | 6.598 | ||||||
| 2026-02-17 | 13F | Zacks Investment Management | 33.267 | -2,41 | 1.779 | 0,11 | ||||
| 2026-02-10 | 13F | Rothschild Investment Llc | 94 | 4,44 | 5 | 25,00 | ||||
| 2026-02-10 | 13F | Envestnet Asset Management Inc | 97.855 | -9,28 | 5.234 | -6,90 | ||||
| 2026-02-17 | 13F | Aster Capital Management (DIFC) Ltd | 0 | -100,00 | 0 | |||||
| 2026-01-15 | 13F | Nisa Investment Advisors, Llc | 9.362 | -0,83 | 501 | 1,63 | ||||
| 2026-02-12 | 13F | Dimensional Fund Advisors Lp | 1.612.365 | -0,89 | 86.247 | 1,70 | ||||
| 2026-04-13 | 13F | Mather Group, Llc. | 25 | 2 | ||||||
| 2026-02-17 | 13F | Alliancebernstein L.p. | 36.850 | 0,00 | 1.971 | 2,66 | ||||
| 2026-02-06 | 13F | EverSource Wealth Advisors, LLC | 254 | -7,97 | 14 | -7,14 | ||||
| 2026-02-12 | 13F | Nuveen, LLC | 320.917 | -4,35 | 17.166 | -1,85 | ||||
| 2026-02-06 | 13F | Bare Financial Services, Inc | 13 | -40,91 | 1 | -100,00 | ||||
| 2025-11-14 | 13F | Brevan Howard Capital Management LP | 0 | -100,00 | 0 | |||||
| 2026-01-29 | 13F | Pictet Asset Management Holding SA | 5.057 | 0,00 | 270 | 2,66 | ||||
| 2026-02-13 | 13F | Arrowstreet Capital, Limited Partnership | 582.421 | -2,01 | 31.154 | 0,55 | ||||
| 2026-02-11 | 13F | Los Angeles Capital Management Llc | 3.963 | 221 | ||||||
| 2026-02-04 | 13F | Ameritas Advisory Services, LLC | 7.068 | 378 | ||||||
| 2026-01-28 | 13F | Klp Kapitalforvaltning As | 7.000 | -5,41 | 374 | -2,86 | ||||
| 2026-02-17 | 13F | Quantinno Capital Management LP | 11.787 | 21,42 | 630 | 24,51 | ||||
| 2025-11-12 | 13F | Group One Trading, L.p. | Call | 0 | -100,00 | 0 | -100,00 | |||
| 2026-02-12 | 13F | New York State Common Retirement Fund | 30.952 | -63,14 | 1.656 | -62,19 | ||||
| 2026-02-10 | 13F | Natixis Advisors, L.p. | 57.621 | -6,10 | 3 | 0,00 | ||||
| 2025-11-14 | 13F | Verition Fund Management LLC | 0 | -100,00 | 0 | |||||
| 2026-02-09 | 13F | Huntington National Bank | 171 | 0,00 | 9 | 12,50 | ||||
| 2025-11-14 | 13F | DRW Securities, LLC | 0 | -100,00 | 0 | -100,00 | ||||
| 2026-02-11 | 13F | Inceptionr Llc | 0 | -100,00 | 0 | |||||
| 2026-02-17 | 13F | Aqr Capital Management Llc | 26.123 | 11,47 | 1.397 | 14,41 | ||||
| 2026-02-10 | 13F | Iat Reinsurance Co Ltd. | 300.000 | 0,00 | 16.047 | 2,61 | ||||
| 2026-02-05 | 13F | Pinnacle Associates Ltd | 26.407 | 0,05 | 1.413 | 2,69 | ||||
| 2026-02-06 | 13F | Aviance Capital Partners, LLC | 7.087 | 0,00 | 379 | 2,71 | ||||
| 2026-02-17 | 13F | Two Sigma Advisers, Lp | 6.000 | -81,07 | 321 | -80,63 | ||||
| 2025-11-14 | 13F | Point72 Asset Management, L.P. | 0 | -100,00 | 0 | |||||
| 2026-02-17 | 13F | Ameriprise Financial Inc | 519.542 | -2,80 | 27.790 | -0,26 | ||||
| 2026-02-10 | 13F | Connor, Clark & Lunn Investment Management Ltd. | 24.761 | 75,70 | 1.324 | 80,38 | ||||
| 2025-11-04 | 13F | State of Wyoming | 0 | -100,00 | 0 | |||||
| 2026-02-11 | 13F | Simplex Trading, Llc | Call | 1.500 | 114,29 | 80 | ||||
| 2026-02-13 | 13F | Rhumbline Advisers | 45.252 | -13,62 | 2.421 | -11,39 | ||||
| 2026-02-11 | 13F | Simplex Trading, Llc | Put | 700 | 0,00 | 37 | ||||
| 2026-02-17 | 13F | Trexquant Investment LP | 52.553 | -35,10 | 2.811 | -33,40 | ||||
| 2026-02-11 | 13F | Simplex Trading, Llc | 1.404 | 75 | ||||||
| 2026-01-30 | 13F | Jennison Associates Llc | 796.101 | 42.583 | ||||||
| 2026-02-12 | 13F | CIBC Private Wealth Group, LLC | 165 | 0,00 | 9 | 0,00 | ||||
| 2026-02-13 | 13F | Charles Schwab Investment Management Inc | 429.390 | -1,42 | 22.968 | 1,15 | ||||
| 2026-01-28 | 13F | Salomon & Ludwin, LLC | 150 | 0,00 | 8 | 14,29 | ||||
| 2026-04-07 | 13F | Signaturefd, Llc | 486 | 0,00 | 31 | 24,00 | ||||
| 2026-02-17 | 13F | MIRAE ASSET GLOBAL ETFS HOLDINGS Ltd. | 15.414 | -0,02 | 824 | 2,62 | ||||
| 2025-11-14 | 13F | Skopos Labs, Inc. | 0 | -100,00 | 0 | |||||
| 2026-04-06 | 13F | GAMMA Investing LLC | 266 | 20,91 | 17 | 54,55 | ||||
| 2026-02-13 | 13F | Citigroup Inc | 3.872 | -24,68 | 207 | -22,76 | ||||
| 2025-11-13 | 13F | Jump Financial, LLC | 0 | -100,00 | 0 | |||||
| 2026-02-13 | 13F | Neuberger Berman Group LLC | 704.395 | -0,71 | 37.708 | 1,90 | ||||
| 2026-02-13 | 13F | Victory Capital Management Inc | 195.278 | -30,27 | 10.445 | -28,45 | ||||
| 2026-02-03 | 13F | Mitsubishi UFJ Kokusai Asset Management Co., Ltd. | 88 | 0,00 | 5 | 0,00 | ||||
| 2026-01-28 | 13F | B. Metzler seel. Sohn & Co. AG | 13.378 | -24,67 | 716 | -22,70 | ||||
| 2026-02-17 | 13F | XTX Topco Ltd | 7.147 | 382 | ||||||
| 2025-11-07 | 13F | Gsa Capital Partners Llp | 0 | -100,00 | 0 | |||||
| 2026-02-17 | 13F | Janus Henderson Group Plc | 474.982 | -10,57 | 25.406 | -8,24 | ||||
| 2026-02-17 | 13F | Jones Financial Companies Lllp | 167 | 9 | ||||||
| 2026-02-09 | 13F | Legal & General Group Plc | 34.080 | -9,03 | 1.823 | -6,66 | ||||
| 2026-02-13 | 13F | Sterling Capital Management LLC | 27.358 | 1.090,51 | 1.463 | 1.129,41 | ||||
| 2025-11-12 | 13F | CIBC Bancorp USA Inc. | 10.932 | 570 | ||||||
| 2026-02-17 | 13F | Graham Capital Management, L.P. | 4.366 | -38,46 | 234 | -36,86 | ||||
| 2026-01-29 | 13F | D.a. Davidson & Co. | 24.487 | 1.310 | ||||||
| 2026-04-08 | 13F | Legacy Wealth Asset Management, LLC | 4.017 | -4,04 | 260 | 16,14 | ||||
| 2026-02-10 | 13F | Intech Investment Management Llc | 12.744 | 0,00 | 682 | 2,56 | ||||
| 2026-04-14 | 13F | USA Financial Portformulas Corp | 274 | 18 | ||||||
| 2026-02-11 | 13F | Deutsche Bank Ag\ | 26.077 | 4,00 | 1.395 | 6,66 | ||||
| 2026-02-13 | 13F | Rice Hall James & Associates, Llc | 44.460 | -8,06 | 2.378 | -5,67 | ||||
| 2026-04-17 | 13F | Sara-Bay Financial | 1.153.896 | -4,24 | 74.669 | 14,20 | ||||
| 2026-01-29 | 13F | UBS Group AG | 76.191 | -17,57 | 4.075 | -15,42 | ||||
| 2026-02-13 | 13F | SG Capital Management LLC | 197.600 | 10.570 | ||||||
| 2026-02-17 | 13F | State Of Wisconsin Investment Board | 37.687 | -5,13 | 2.016 | -2,66 | ||||
| 2026-02-17 | 13F | Bayesian Capital Management, LP | 0 | -100,00 | 0 | |||||
| 2026-04-13 | 13F | IFP Advisors, Inc | 17 | 0,00 | 1 | |||||
| 2026-02-12 | 13F | BlackRock, Inc. | 2.468.752 | 0,35 | 132.054 | 2,97 | ||||
| 2026-02-17 | 13F | Wellington Management Group Llp | 1.997.527 | 114,86 | 106.848 | 120,47 | ||||
| 2026-02-11 | 13F | Parallel Advisors, LLC | 56 | -5,08 | 3 | -33,33 | ||||
| 2026-02-17 | 13F | Public Employees Retirement System Of Ohio | 641 | -2,44 | 34 | 0,00 | ||||
| 2025-11-14 | 13F | Tudor Investment Corp Et Al | 0 | -100,00 | 0 | |||||
| 2026-04-17 | 13F | Leeward Investments, LLC - MA | 149.265 | 9.659 | ||||||
| 2026-02-09 | 13F | Jackson Creek Investment Advisors LLC | 0 | -100,00 | 0 | |||||
| 2026-03-03 | 13F/A | Caitong International Asset Management Co., Ltd | 0 | -100,00 | 0 | |||||
| 2026-01-29 | 13F | UMA Financial Services, Inc. | 42 | 75,00 | 2 | 100,00 | ||||
| 2025-11-14 | 13F | Two Sigma Investments, Lp | 0 | -100,00 | 0 | |||||
| 2026-02-17 | 13F | Balyasny Asset Management Llc | 22.787 | 432,66 | 1.219 | 446,19 | ||||
| 2026-01-23 | 13F | Deprince Race & Zollo Inc | 233.025 | -72,46 | 12.465 | -71,75 | ||||
| 2026-02-17 | 13F | Creative Planning | 34.719 | 5,67 | 1.857 | 8,47 | ||||
| 2026-02-13 | 13F | Bridgefront Capital, LLC | 0 | -100,00 | 0 | |||||
| 2026-02-17 | 13F | Voloridge Investment Management, Llc | 25.257 | -49,72 | 1.351 | -48,43 | ||||
| 2026-02-18 | 13F | EP Wealth Advisors, Inc. | 6.792 | -1,91 | 363 | 57,14 | ||||
| 2026-02-05 | 13F | Amalgamated Bank | 1.043 | -10,78 | 0 | |||||
| 2026-01-23 | 13F | State of Alaska, Department of Revenue | 1.848 | 0,00 | 0 | |||||
| 2026-02-13 | 13F | Ubs Asset Management Americas Inc | 50.681 | -17,89 | 2.711 | -15,76 | ||||
| 2026-02-17 | 13F | Schonfeld Strategic Advisors LLC | 5.072 | 271 | ||||||
| 2026-02-13 | 13F | Barclays Plc | 54.289 | 10,31 | 2.904 | 13,18 | ||||
| 2026-01-29 | 13F | Dunhill Financial, LLC | 1 | 0 | ||||||
| 2026-02-17 | 13F | Citadel Advisors Llc | 114.639 | 19,70 | 6.132 | 22,84 | ||||
| 2026-02-17 | 13F | Advisor Group Holdings, Inc. | 2.942 | 14,08 | 158 | 12,95 | ||||
| 2026-02-17 | 13F | Citadel Advisors Llc | Call | 25.700 | 137,96 | 1.375 | 144,05 | |||
| 2026-04-13 | 13F | Creative Financial Designs Inc /adv | 321 | 0,00 | 21 | 17,65 | ||||
| 2026-03-12 | 13F/A | Peak6 Llc | 3.993 | 214 | ||||||
| 2026-02-05 | 13F | Gamco Investors, Inc. Et Al | 51.217 | -20,15 | 2.740 | -18,07 | ||||
| 2026-02-13 | 13F | Public Employees Retirement Association Of Colorado | 5.187 | 0,00 | 0 | |||||
| 2026-02-09 | 13F | Harbour Investments, Inc. | 380 | 20 | ||||||
| 2026-02-12 | 13F | Voya Investment Management Llc | 486.803 | 7.923,78 | 26.039 | 8.140,19 | ||||
| 2026-02-17 | 13F | Canada Pension Plan Investment Board | 4.800 | -25,00 | 257 | -23,12 | ||||
| 2026-02-06 | 13F | Diamond Hill Capital Management Inc | 34.930 | -88,01 | 1.868 | -87,70 | ||||
| 2026-02-13 | 13F | Manufacturers Life Insurance Company, The | 0 | -100,00 | 0 | |||||
| 2026-02-17 | 13F | Advisory Services Network, LLC | 0 | -100,00 | 0 | |||||
| 2026-02-05 | 13F | Gabelli Funds Llc | 97.859 | 0,00 | 5.234 | 2,61 | ||||
| 2026-01-22 | 13F | Advantage Alpha Capital Partners LP | 0 | -100,00 | 0 | |||||
| 2026-02-17 | 13F | Price T Rowe Associates Inc /md/ | 39.490 | 3,78 | 2 | 100,00 | ||||
| 2026-04-13 | 13F | True Wealth Design, LLC | 14 | 0,00 | 1 | |||||
| 2026-02-05 | 13F | Thrivent Financial For Lutherans | 925.769 | -39,51 | 50 | -37,97 | ||||
| 2026-02-13 | 13F | Ceredex Value Advisors LLC | 191.800 | -0,52 | 10.259 | 2,08 | ||||
| 2025-11-14 | 13F | National Bank Of Canada /fi/ | 0 | -100,00 | 0 | |||||
| 2026-01-28 | 13F | Universal- Beteiligungs- und Servicegesellschaft mbH | 10.103 | 540 | ||||||
| 2026-02-12 | 13F | Swiss National Bank | 65.400 | 1,24 | 3.498 | 3,89 | ||||
| 2026-02-17 | 13F | Driehaus Capital Management Llc | 295.499 | 65,62 | 15.806 | 69,96 | ||||
| 2026-02-03 | 13F | SBI Securities Co., Ltd. | 210 | 105,88 | 11 | 120,00 | ||||
| 2026-02-19 | 13F | Invesco Ltd. | 68.594 | 5,99 | 3.669 | 8,78 | ||||
| 2026-02-12 | 13F | Campbell & CO Investment Adviser LLC | 14.530 | 777 | ||||||
| 2026-02-13 | 13F | Truvestments Capital Llc | 3.750 | 0,00 | 201 | 2,56 | ||||
| 2026-02-04 | 13F | Virginia Retirement Systems Et Al | 9.200 | 95,74 | 492 | 100,82 | ||||
| 2026-02-05 | 13F | Bessemer Group Inc | 274.708 | 0,32 | 15 | 0,00 | ||||
| 2026-02-17 | 13F | Tower Research Capital LLC (TRC) | 1.715 | 19,10 | 92 | 21,33 | ||||
| 2026-02-06 | 13F | Global Retirement Partners, LLC | 1.239 | 66 | ||||||
| 2026-02-06 | 13F | Pnc Financial Services Group, Inc. | 274 | -2,14 | 15 | 0,00 | ||||
| 2026-01-28 | 13F | Barrett & Company, Inc. | 250 | 0,00 | 13 | 0,00 | ||||
| 2026-04-16 | 13F | SG Americas Securities, LLC | 5.115 | -70,12 | 0 | |||||
| 2026-04-16 | 13F | Vaughan Nelson Investment Management, L.p. | 693.072 | -8,65 | 44.849 | 10,51 | ||||
| 2026-02-13 | 13F | Prudential Financial Inc | 13.189 | 66,80 | 705 | 71,12 | ||||
| 2025-11-14 | 13F | Jain Global LLC | 0 | -100,00 | 0 | |||||
| 2026-02-06 | 13F | ProShare Advisors LLC | 6.065 | 6,89 | 324 | 9,83 | ||||
| 2026-02-06 | 13F | Larson Financial Group LLC | 42 | 110,00 | 2 | 100,00 | ||||
| 2026-02-09 | 13F | William Blair Investment Management, Llc | 587.343 | -20,17 | 31.417 | -18,09 | ||||
| 2025-11-10 | 13F | MAI Capital Management | 0 | -100,00 | 0 | |||||
| 2026-02-10 | 13F | Root Financial Partners, LLC | 3 | 50,00 | 0 | |||||
| 2025-11-14 | 13F | Hrt Financial Lp | 0 | -100,00 | 0 | |||||
| 2026-01-29 | 13F | Comerica Bank | 131.458 | -3,04 | 7.032 | -0,51 | ||||
| 2026-02-09 | 13F | Royce & Associates Lp | 361.799 | -2,24 | 19.353 | 0,31 | ||||
| 2026-02-12 | 13F | MetLife Investment Management, LLC | 280.032 | -33,83 | 14.979 | -32,11 | ||||
| 2026-02-12 | 13F | Wasatch Advisors Inc | 590.185 | -30,95 | 31.569 | -29,15 | ||||
| 2026-02-17 | 13F | Susquehanna International Group, Llp | 42.572 | 59,49 | 2.277 | 63,70 | ||||
| 2026-02-17 | 13F | Susquehanna International Group, Llp | Put | 18.500 | -3,65 | 990 | -1,10 | |||
| 2026-02-17 | 13F | Kemnay Advisory Services Inc. | 1.952 | 104 | ||||||
| 2026-02-13 | 13F | Sei Investments Co | 150.121 | 97,13 | 8.030 | 102,29 | ||||
| 2026-02-12 | 13F | Castleark Management Llc | 146.749 | 119,23 | 7.850 | 124,96 | ||||
| 2026-02-17 | 13F | Glenmede Trust Co Na | 8.233 | -19,99 | 440 | 33,33 | ||||
| 2026-01-16 | 13F | Standard Life Aberdeen plc | 255.773 | 13.681 | ||||||
| 2026-02-17 | 13F | Susquehanna International Group, Llp | Call | 31.700 | -7,31 | 1.696 | -4,88 | |||
| 2026-02-17 | 13F | Raymond James Financial Inc | 140.380 | -19,82 | 7.509 | -17,74 | ||||
| 2026-02-17 | 13F | Russell Investments Group, Ltd. | 157.401 | -49,68 | 8.419 | -48,37 | ||||
| 2026-02-12 | 13F | Triumph Capital Management | 700 | 0,00 | 37 | 2,78 | ||||
| 2026-02-12 | 13F | Jane Street Group, Llc | 158.968 | 132,00 | 8.503 | 138,05 |
Other Listings
| US:HLIO | 68,73 $ |