Grundlæggende statistik
| Institutionelle aktier (lange) | 164.446.320 - 66,60% (ex 13D/G) - change of -10,34MM shares -5,92% MRQ |
| Institutionel værdi (lang) | $ 198.374 USD ($1000) |
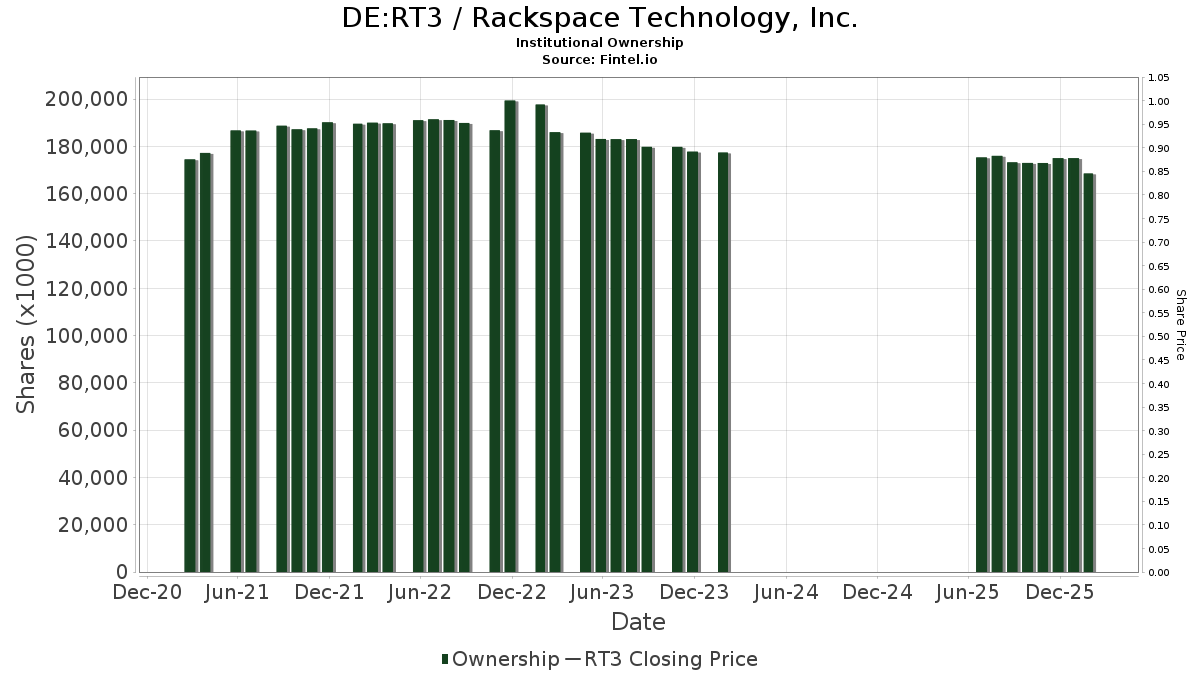
Institutionelt ejerskab og aktionærer
Rackspace Technology, Inc. (DE:RT3) har 116 institutionelle ejere og aktionærer, der har indsendt 13D/G- eller 13F-formularer til Securities Exchange Commission (SEC). Disse institutioner har i alt 164,446,320 aktier. Største aktionærer omfatter Apollo Management Holdings, L.P., Vanguard Group Inc, BlackRock, Inc., CastleKnight Management LP, Geode Capital Management, Llc, State Street Corp, Renaissance Technologies Llc, Morgan Stanley, Janus Henderson Group Plc, and UBS Group AG .
Rackspace Technology, Inc. (DB:RT3) institutionel ejerskabsstruktur viser aktuelle positioner i virksomheden efter institutioner og fonde, samt seneste ændringer i positionsstørrelse. Større aktionærer kan omfatte individuelle investorer, investeringsforeninger, hedgefonde eller institutioner. Skema 13D angiver, at investoren besidder (eller besidder) mere end 5 % af virksomheden og har til hensigt (eller har til hensigt at) aktivt at forfølge en ændring i forretningsstrategi. Skema 13G indikerer en passiv investering på over 5%.
Fondens stemningsscore
Fund Sentiment Score (fka Ownership Accumulation Score) finder de aktier, der bliver mest købt af fonde. Det er resultatet af en sofistikeret, multi-faktor kvantitativ model, der identificerer virksomheder med de højeste niveauer af institutionel akkumulering. Scoringsmodellen bruger en kombination af den samlede stigning i oplyste ejere, ændringerne i porteføljeallokeringer i disse ejere og andre målinger. Tallet går fra 0 til 100, hvor højere tal indikerer et højere niveau af akkumulering for sine jævnaldrende, og 50 er gennemsnittet.
Opdateringsfrekvens: Dagligt
Se Ownership Explorer, som giver en liste over højest rangerende virksomheder.
AI+ Ask Fintel’s AI assistant about Rackspace Technology, Inc..
Select a question to share a public post with an AI-crafted answer.
Thinking of good questions…
13F og NPORT arkivering
Detaljer om 13F-arkivering er gratis. Detaljer om NP-ansøgninger kræver et premium-medlemskab. Grønne rækker angiver nye positioner. Røde rækker angiver lukkede positioner. Klik på linket ikon for at se den fulde transaktionshistorik.
Opgrader
for at låse premium-data op og eksportere til Excel ![]() .
.
| Fil dato | Kilde | Investor | Type | Gennemsnitlig pris (Øst) |
Aktier | Δ Aktier (%) |
Rapporteret Værdi ($1000) |
Δ Værdi (%) |
Port Alloc (%) |
|
|---|---|---|---|---|---|---|---|---|---|---|
| 2026-04-16 | 13F | SG Americas Securities, LLC | 35.036 | 0 | ||||||
| 2026-04-21 | 13F | Ground Swell Capital, LLC | 14.762 | 14 | ||||||
| 2026-02-13 | 13F | Centiva Capital, LP | 48.491 | 47 | ||||||
| 2026-02-17 | 13F | Alliancebernstein L.p. | 290.750 | 0,00 | 282 | -31,05 | ||||
| 2026-02-10 | 13F | Bnp Paribas Arbitrage, Sa | 18.947 | -83,19 | 18 | -88,61 | ||||
| 2026-02-17 | 13F | Ameriprise Financial Inc | 227.169 | 0,00 | 221 | -31,25 | ||||
| 2026-04-21 | 13F | AEGON USA Investment Management, LLC | 0 | -100,00 | 0 | |||||
| 2026-02-18 | 13F | GWM Advisors LLC | 300 | 0,00 | 0 | |||||
| 2026-02-06 | 13F | EverSource Wealth Advisors, LLC | 647 | -39,02 | 1 | -100,00 | ||||
| 2025-11-14 | 13F | Empower Advisory Group, LLC | 0 | -100,00 | 0 | -100,00 | ||||
| 2026-04-15 | 13F | Fortitude Family Office, LLC | 1.111 | 1 | ||||||
| 2026-04-20 | 13F | Kestra Private Wealth Services, Llc | 21.600 | -7,10 | 21 | -4,55 | ||||
| 2026-02-10 | 13F | Rothschild Investment Llc | 32 | 0 | ||||||
| 2026-02-13 | 13F | Citigroup Inc | 108.434 | -12,68 | 105 | -40,00 | ||||
| 2026-02-11 | 13F | Ameritas Investment Partners, Inc. | 7.773 | 8 | ||||||
| 2026-02-13 | 13F | SRS Capital Advisors, Inc. | 0 | -100,00 | 0 | |||||
| 2026-02-05 | 13F | AustralianSuper Pty Ltd | 0 | -100,00 | 0 | -100,00 | ||||
| 2026-02-13 | 13F | Barclays Plc | 153.348 | 9,36 | 149 | -24,87 | ||||
| 2026-04-08 | 13F | Wealth Enhancement Advisory Services, Llc | 138.246 | 119 | ||||||
| 2026-02-17 | 13F | Advisor Group Holdings, Inc. | 324 | 0,00 | 0 | |||||
| 2026-02-17 | 13F | Royal Bank Of Canada | 5.361 | -96,84 | 5 | -97,91 | ||||
| 2026-02-13 | 13F | Quinn Opportunity Partners LLC | 57.750 | 0,00 | 56 | -30,86 | ||||
| 2025-11-14 | 13F | Scientech Research LLC | 0 | -100,00 | 0 | |||||
| 2026-02-17 | 13F | Two Sigma Advisers, Lp | 482.800 | 12,70 | 469 | -22,52 | ||||
| 2026-04-23 | 13F | SJS Investment Consulting Inc. | 417 | 0 | ||||||
| 2026-02-12 | 13F | BlackRock, Inc. | 5.910.141 | 1,40 | 5.738 | -30,17 | ||||
| 2026-02-13 | 13F | Charles Schwab Investment Management Inc | 724.016 | -0,05 | 703 | -31,24 | ||||
| 2026-02-05 | 13F | Amalgamated Bank | 2.627 | 39,96 | 0 | |||||
| 2026-02-17 | 13F | Aqr Capital Management Llc | 130.256 | -18,34 | 126 | -43,75 | ||||
| 2026-02-17 | 13F | Fmr Llc | 6.026 | -57,94 | 6 | -75,00 | ||||
| 2025-10-31 | 13F | Chilton Capital Management Llc | 0 | -100,00 | 0 | |||||
| 2026-04-15 | 13F | Merit Financial Group, LLC | 52.783 | 52 | ||||||
| 2026-02-06 | 13F | Covestor Ltd | 58 | -1,69 | 0 | |||||
| 2025-11-14 | 13F | Susquehanna Fundamental Investments, Llc | 0 | -100,00 | 0 | -100,00 | ||||
| 2026-02-12 | 13F | Nuveen, LLC | 90.686 | 0,00 | 88 | -30,71 | ||||
| 2026-02-20 | 13F | Sunbelt Securities, Inc. | 0 | -100,00 | 0 | |||||
| 2026-04-24 | 13F | Strs Ohio | 205.900 | 0,00 | 202 | 1,01 | ||||
| 2026-02-06 | 13F | Gsa Capital Partners Llp | 801.850 | 26,18 | 1 | |||||
| 2026-02-12 | 13F | Jane Street Group, Llc | Call | 44.700 | 43 | |||||
| 2026-02-12 | 13F | Jane Street Group, Llc | 10.098 | -92,53 | 10 | -95,26 | ||||
| 2026-02-13 | 13F | Mariner, LLC | 0 | -100,00 | 0 | |||||
| 2025-11-14 | 13F | Wolverine Trading, Llc | Call | 10.900 | -28,29 | 15 | -21,05 | |||
| 2026-04-22 | 13F | Sterling Capital Management LLC | 2.387 | -46,28 | 2 | -50,00 | ||||
| 2026-02-11 | 13F | Parallel Advisors, LLC | 45 | 0,00 | 0 | |||||
| 2026-01-30 | 13F | R Squared Ltd | 0 | -100,00 | 0 | |||||
| 2025-11-14 | 13F | Eqis Capital Management, Inc. | 0 | -100,00 | 0 | -100,00 | ||||
| 2026-02-12 | 13F | Steward Partners Investment Advisory, Llc | 64.828 | 3.385,38 | 63 | 3.000,00 | ||||
| 2025-11-10 | 13F | Raiffeisen Bank International AG | 0 | -100,00 | 0 | -100,00 | ||||
| 2026-02-09 | 13F | Legal & General Group Plc | 8.172 | 0,00 | 8 | -36,36 | ||||
| 2026-02-06 | 13F | HighTower Advisors, LLC | 10.000 | -0,65 | 10 | -35,71 | ||||
| 2026-02-09 | 13F | Harbour Investments, Inc. | 100 | 0 | ||||||
| 2026-02-17 | 13F | Susquehanna International Group, Llp | Call | 0 | -100,00 | 0 | -100,00 | |||
| 2026-04-07 | 13F | Farther Finance Advisors, LLC | 1.650 | 5.400,00 | 2 | |||||
| 2026-02-13 | 13F | Walleye Capital LLC | 0 | -100,00 | 0 | -100,00 | ||||
| 2026-02-13 | 13F | State Street Corp | 1.858.141 | 0,83 | 1.804 | -30,56 | ||||
| 2026-04-22 | 13F | Parcion Private Wealth LLC | 11.126 | 11 | ||||||
| 2025-11-14 | 13F | Mount Yale Investment Advisors, LLC | 0 | -100,00 | 0 | |||||
| 2026-04-24 | 13F | Root Financial Partners, LLC | 372 | 0 | ||||||
| 2026-01-28 | 13F | Kapitalo Investimentos Ltda | 0 | -100,00 | 0 | |||||
| 2026-02-17 | 13F | Brevan Howard Capital Management LP | 18.601 | 18 | ||||||
| 2026-02-17 | 13F | Janus Henderson Group Plc | 1.050.353 | 70,72 | 1.020 | 17,53 | ||||
| 2026-02-17 | 13F | Public Employees Retirement System Of Ohio | 79.026 | 0,00 | 77 | -31,53 | ||||
| 2026-02-19 | 13F | Invesco Ltd. | 152.865 | -41,66 | 148 | -59,89 | ||||
| 2026-02-05 | 13F | Northwestern Mutual Wealth Management Co | 279.115 | 46.034,71 | 39.946 | |||||
| 2026-02-17 | 13F | D. E. Shaw & Co., Inc. | 0 | -100,00 | 0 | -100,00 | ||||
| 2026-02-17 | 13F | Susquehanna International Group, Llp | Put | 81.300 | 79 | |||||
| 2026-02-12 | 13F | Hrt Financial Lp | 0 | -100,00 | 0 | |||||
| 2026-02-17 | 13F | Susquehanna International Group, Llp | 95.393 | -74,89 | 93 | -82,80 | ||||
| 2026-02-13 | 13F | Victory Capital Management Inc | 11.050 | 11 | ||||||
| 2026-02-17 | 13F | Jump Financial, LLC | 34.960 | 34 | ||||||
| 2026-01-12 | 13F | Daymark Wealth Partners, Llc | 14.405 | 14 | ||||||
| 2026-02-05 | 13F | Allworth Financial LP | 119 | 417,39 | 0 | |||||
| 2026-02-12 | 13F | New York State Common Retirement Fund | 7.050 | 0,00 | 7 | -33,33 | ||||
| 2026-04-13 | 13F | True Wealth Design, LLC | 2.986 | 10.959,26 | 3 | |||||
| 2026-02-17 | 13F | Two Sigma Investments, Lp | 660.976 | -1,89 | 642 | -32,46 | ||||
| 2026-02-17 | 13F | Jones Financial Companies Lllp | 505 | 0,00 | 0 | |||||
| 2026-02-17 | 13F | MIRAE ASSET GLOBAL ETFS HOLDINGS Ltd. | 39.812 | 3,19 | 39 | -29,63 | ||||
| 2026-02-12 | 13F | Cibc World Markets Corp | 0 | -100,00 | 0 | |||||
| 2026-02-13 | 13F | Jacobs Levy Equity Management, Inc | 680.435 | -3,34 | 661 | -33,47 | ||||
| 2026-02-14 | 13F | Rockefeller Capital Management L.P. | 75 | 0,00 | 0 | |||||
| 2026-02-10 | 13F | NINE MASTS CAPITAL Ltd | 40.237 | 39 | ||||||
| 2026-02-17 | 13F | Tower Research Capital LLC (TRC) | 7.052 | -11,32 | 7 | -45,45 | ||||
| 2026-02-17 | 13F | XTX Topco Ltd | 44.189 | -65,82 | 43 | -76,92 | ||||
| 2026-02-17 | 13F | Atom Investors LP | 10.810 | 10 | ||||||
| 2026-02-17 | 13F | Millennium Management Llc | 276.759 | -58,04 | 269 | -71,18 | ||||
| 2026-02-17 | 13F | Northern Trust Corp | 620.368 | -6,68 | 602 | -35,75 | ||||
| 2026-02-17 | 13F | Voleon Capital Management Lp | 0 | -100,00 | 0 | |||||
| 2026-02-17 | 13F | California State Teachers Retirement System | 5.133 | 5,88 | 5 | -33,33 | ||||
| 2026-04-21 | 13F | Pallas Capital Advisors LLC | 124.000 | 121 | ||||||
| 2026-02-03 | 13F | SBI Securities Co., Ltd. | 60 | -70,59 | 0 | |||||
| 2026-02-17 | 13F | Apollo Management Holdings, L.P. | 129.609.000 | 0,00 | 125.837 | -31,14 | ||||
| 2026-02-17 | 13F | Price T Rowe Associates Inc /md/ | 46.112 | 0,00 | 0 | |||||
| 2026-02-09 | 13F | Geode Capital Management, Llc | 2.408.000 | 4,19 | 2.338 | -28,26 | ||||
| 2026-02-17 | 13F | Creative Planning | 0 | -100,00 | 0 | -100,00 | ||||
| 2026-02-13 | 13F | Walleye Trading LLC | Call | 40.900 | 40 | |||||
| 2026-02-13 | 13F | Walleye Trading LLC | 120 | 0 | ||||||
| 2026-02-12 | 13F | Federated Hermes, Inc. | 719.747 | 4,35 | 699 | -28,19 | ||||
| 2026-01-26 | 13F | Mountain Hill Investment Partners Corp. | 800 | 0,00 | 1 | -100,00 | ||||
| 2026-02-13 | 13F | Walleye Trading LLC | Put | 38.600 | 37 | |||||
| 2026-02-17 | 13F | State Of Wisconsin Investment Board | 170.500 | 1,73 | 166 | -30,08 | ||||
| 2026-02-12 | 13F | Renaissance Technologies Llc | 1.790.900 | -0,27 | 1.739 | -31,33 | ||||
| 2026-02-06 | 13F | ProShare Advisors LLC | 15.276 | 6,86 | 15 | -30,00 | ||||
| 2026-02-17 | 13F | CastleKnight Management LP | 3.159.780 | -19,71 | 3.068 | -44,73 | ||||
| 2026-02-17 | 13F | Optiver Holding B.V. | 560 | -61,38 | 1 | -100,00 | ||||
| 2026-04-13 | 13F | IFP Advisors, Inc | 7.772 | 2.832,83 | 8 | |||||
| 2026-02-11 | 13F | Cerity Partners LLC | 19.323 | 89,11 | 19 | 28,57 | ||||
| 2026-02-17 | 13F | Bridgeway Capital Management Inc | 350.000 | 34,62 | 340 | -7,38 | ||||
| 2026-02-17 | 13F | Russell Investments Group, Ltd. | 50.439 | 19,82 | 49 | -18,64 | ||||
| 2026-02-13 | 13F | Verition Fund Management LLC | 117.400 | 9,89 | 114 | -24,67 | ||||
| 2026-02-17 | 13F | Quadrature Capital Ltd | 0 | -100,00 | 0 | |||||
| 2026-02-11 | 13F | Deutsche Bank Ag\ | 56.100 | 0,00 | 54 | -31,65 | ||||
| 2026-04-21 | 13F | Wedbush Securities Inc | 45.682 | 0 | ||||||
| 2025-11-12 | 13F | Us Bancorp \de\ | 0 | -100,00 | 0 | |||||
| 2026-02-17 | 13F | Aquatic Capital Management LLC | 118.472 | 115 | ||||||
| 2026-02-13 | 13F | Police & Firemen's Retirement System of New Jersey | 13.440 | 0,00 | 13 | -27,78 | ||||
| 2026-01-29 | 13F | UBS Group AG | 812.410 | 208,19 | 789 | 112,40 | ||||
| 2026-02-10 | 13F | Goldman Sachs Group Inc | 292.242 | -39,32 | 284 | -58,32 | ||||
| 2026-02-13 | 13F | Walleye Capital LLC | Put | 25.000 | 0,00 | 24 | -31,43 | |||
| 2026-02-11 | 13F | Group One Trading, L.p. | Put | 1.200 | -20,00 | 1 | -50,00 | |||
| 2026-02-13 | 13F | Rhumbline Advisers | 105.018 | -9,85 | 102 | -38,41 | ||||
| 2026-02-17 | 13F | Raymond James Financial Inc | 13.546 | -96,94 | 13 | -97,92 | ||||
| 2026-02-11 | 13F | Group One Trading, L.p. | 5.671 | 6 | ||||||
| 2026-04-06 | 13F | GAMMA Investing LLC | 462 | -24,26 | 0 | |||||
| 2026-02-11 | 13F | Group One Trading, L.p. | Call | 73.500 | 163,44 | 71 | 82,05 | |||
| 2026-03-06 | 13F | Hsbc Holdings Plc | 32.021 | 0,00 | 31 | -29,55 | ||||
| 2025-11-14 | 13F | Wolverine Trading, Llc | Put | 0 | -100,00 | 0 | -100,00 | |||
| 2026-02-17 | 13F | Engineers Gate Manager LP | 0 | -100,00 | 0 | |||||
| 2026-02-17 | 13F | Citadel Advisors Llc | Put | 14.500 | 8,21 | 14 | -22,22 | |||
| 2026-02-17 | 13F | Citadel Advisors Llc | Call | 57.400 | 105,00 | 56 | 41,03 | |||
| 2026-02-13 | 13F | Morgan Stanley | 1.110.386 | -50,83 | 1.078 | -66,14 | ||||
| 2026-02-18 | 13F | Mackenzie Financial Corp | 68.635 | 2,14 | 68 | -28,72 | ||||
| 2025-11-14 | 13F | Dark Forest Capital Management Lp | 22.799 | 0,00 | 29 | 0,00 | ||||
| 2026-02-13 | 13F | Ieq Capital, Llc | 15.190 | -39,76 | 15 | -60,00 | ||||
| 2026-02-17 | 13F | Citadel Advisors Llc | 19.383 | -95,92 | 19 | -97,31 | ||||
| 2026-02-13 | 13F | Wells Fargo & Company/mn | 244.939 | 13,37 | 238 | -22,04 | ||||
| 2025-11-14 | 13F | Graham Capital Management, L.P. | 0 | -100,00 | 0 | |||||
| 2026-04-08 | 13F | NorthCrest Asset Manangement, LLC | 14.011 | 13 | ||||||
| 2026-01-26 | 13F | Cwm, Llc | 5.509 | -20,34 | 0 | |||||
| 2026-02-10 | 13F | Savant Capital, LLC | 0 | -100,00 | 0 | |||||
| 2026-04-24 | 13F | Raiffeisen Bank International AG | Call | 1.875 | 0,00 | 2 | 0,00 | |||
| 2026-02-17 | 13F | Bank Of America Corp /de/ | 114.807 | -66,64 | 111 | -77,11 | ||||
| 2026-02-09 | 13F | Hartland & Co., LLC | 23 | -72,94 | 0 | |||||
| 2026-02-10 | 13F | State of Wyoming | 0 | -100,00 | 0 | |||||
| 2026-04-17 | 13F | Krilogy Financial LLC | 14.788 | 20 | ||||||
| 2026-02-10 | 13F | Intech Investment Management Llc | 37.670 | 5,44 | 37 | -28,00 | ||||
| 2026-02-17 | 13F | Advisory Services Network, LLC | 0 | -100,00 | 0 | |||||
| 2026-04-23 | 13F | Marquette Asset Management, LLC | 1.665 | 2 | ||||||
| 2026-02-09 | 13F | Sawgrass Asset Management Llc | 31.306 | 61,80 | 30 | 11,11 | ||||
| 2026-02-11 | 13F | Jpmorgan Chase & Co | 369.308 | -74,78 | 359 | -82,66 | ||||
| 2026-02-10 | 13F | Bank of New York Mellon Corp | 177.186 | -12,64 | 172 | -39,65 | ||||
| 2026-02-11 | 13F | Simplex Trading, Llc | Put | 21.500 | 150,00 | 21 | ||||
| 2026-01-15 | 13F | Nisa Investment Advisors, Llc | 199 | -90,21 | 0 | -100,00 | ||||
| 2026-01-29 | 13F | Vanguard Group Inc | 6.473.046 | 2,93 | 6.285 | -29,12 | ||||
| 2026-02-11 | 13F | Simplex Trading, Llc | 3.783 | 4 | ||||||
| 2026-02-11 | 13F | Simplex Trading, Llc | Call | 40.600 | 322,92 | 39 |
Other Listings
| US:RXT | 1,58 $ |